Construction of a redox-related gene signature for overall survival prediction and immune infiltration in non-small-cell lung cancer
- PMID: 36052170
- PMCID: PMC9425056
- DOI: 10.3389/fmolb.2022.942402
Construction of a redox-related gene signature for overall survival prediction and immune infiltration in non-small-cell lung cancer
Abstract
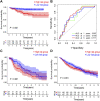
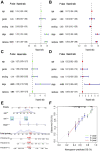
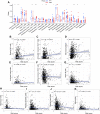
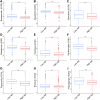
Background: An imbalance in the redox homeostasis has been reported in multiple cancers and is associated with a poor prognosis of disease. However, the prognostic value of redox-related genes in non-small-cell lung cancer (NSCLC) remains unclear. Methods: RNA sequencing data, DNA methylation data, mutation, and clinical data of NSCLC patients were downloaded from The Cancer Genome Atlas and Gene Expression Omnibus databases. Redox-related differentially expressed genes (DEGs) were used to construct the prognostic signature using least absolute shrinkage and selection operator (LASSO) regression analysis. Kaplan-Meier survival curve and receiver operator characteristic (ROC) curve analyses were applied to validate the accuracy of the gene signature. Nomogram and calibration plots of the nomogram were constructed to predict prognosis. Pathway analysis was performed using gene set enrichment analysis. The correlations of risk score with tumor stage, immune infiltration, DNA methylation, tumor mutation burden (TMB), and chemotherapy sensitivity were evaluated. The prognostic signature was validated using GSE31210, GSE26939, and GSE68465 datasets. Real-time polymerase chain reaction (PCR) was used to validate dysregulated genes in NSCLC. Results: A prognostic signature was constructed using the LASSO regression analysis and was represented as a risk score. The high-risk group was significantly correlated with worse overall survival (OS) (p < 0.001). The area under the ROC curve (AUC) at the 5-year stage was 0.657. The risk score was precisely correlated with the tumor stage and was an independent prognostic factor for NSCLC. The constructed nomogram accurately predicted the OS of patients after 1-, 3-, and 5-year periods. DNA replication, cell cycle, and ECM receptor interaction were the main pathways enriched in the high-risk group. In addition, the high-risk score was correlated with higher TMB, lower methylation levels, increased infiltrating macrophages, activated memory CD4+ T cells, and a higher sensitivity to chemotherapy. The signature was validated in GSE31210, GSE26939, and GSE68465 datasets. Real-time PCR validated dysregulated mRNA expression levels in NSCLC. Conclusions: A prognostic redox-related gene signature was successfully established in NSCLC, with potential applications in the clinical setting.
Keywords: NSCLC; cancer prognosis; gene signature; immune infiltration; redox homeostasis.
Copyright © 2022 Miao, Yang, Gao, Yin, Zhu, Liu, He and Chen.
Conflict of interest statement
The authors declare that the research was conducted in the absence of any commercial or financial relationships that could be construed as a potential conflict of interest.
Figures


Similar articles
-
Signature based on RNA-binding protein-related genes for predicting prognosis and guiding therapy in non-small cell lung cancer.Front Genet. 2022 Sep 2;13:930826. doi: 10.3389/fgene.2022.930826. eCollection 2022. Front Genet. 2022. PMID: 36118863 Free PMC article.
-
Construction of a novel mRNA-signature prediction model for prognosis of bladder cancer based on a statistical analysis.BMC Cancer. 2021 Jul 27;21(1):858. doi: 10.1186/s12885-021-08611-z. BMC Cancer. 2021. PMID: 34315402 Free PMC article.
-
Identification of a glycolysis- and lactate-related gene signature for predicting prognosis, immune microenvironment, and drug candidates in colon adenocarcinoma.Front Cell Dev Biol. 2022 Aug 23;10:971992. doi: 10.3389/fcell.2022.971992. eCollection 2022. Front Cell Dev Biol. 2022. PMID: 36081904 Free PMC article.
-
Comprehensive FGFR3 alteration-related transcriptomic characterization is involved in immune infiltration and correlated with prognosis and immunotherapy response of bladder cancer.Front Immunol. 2022 Jul 26;13:931906. doi: 10.3389/fimmu.2022.931906. eCollection 2022. Front Immunol. 2022. PMID: 35958598 Free PMC article.
-
An Intratumor Heterogeneity-Related Signature for Predicting Prognosis, Immune Landscape, and Chemotherapy Response in Colon Adenocarcinoma.Front Med (Lausanne). 2022 Jul 7;9:925661. doi: 10.3389/fmed.2022.925661. eCollection 2022. Front Med (Lausanne). 2022. PMID: 35872794 Free PMC article.
Cited by
-
Redoxhigh phenotype mediated by KEAP1/STK11/SMARCA4/NRF2 mutations diminishes tissue-resident memory CD8+ T cells and attenuates the efficacy of immunotherapy in lung adenocarcinoma.Oncoimmunology. 2024 Apr 9;13(1):2340154. doi: 10.1080/2162402X.2024.2340154. eCollection 2024. Oncoimmunology. 2024. PMID: 38601319 Free PMC article.
References
-
- Alemohammad H., Najafzadeh B., Asadzadeh Z., Baghbanzadeh A., Ghorbaninezhad F., Najafzadeh A., et al. (2021). The importance of immune checkpoints in immune monitoring: A future paradigm shift in the treatment of cancer. Biomed. Pharmacother. = Biomedecine Pharmacother. 146, 112516. 10.1016/j.biopha.2021.112516 - DOI - PubMed
-
- Brown J. S., O'Carrigan B., Jackson S. P., Yap T. A. (2017). Targeting DNA repair in cancer: Beyond PARP inhibitors. Cancer Discov. 7, 20–37. 10.1158/2159-8290.cd-16-0860 - DOI - PMC - PubMed
LinkOut - more resources
Full Text Sources
Research Materials

