. 2022 Nov 1;28(21):4757-4770.
doi: 10.1158/1078-0432.CCR-22-1357.

p53 Inhibits Bmi-1-driven Self-Renewal and Defines Salivary Gland Cancer Stemness

Affiliations

p53 Inhibits Bmi-1-driven Self-Renewal and Defines Salivary Gland Cancer Stemness

Christie Rodriguez-Ramirez et al. Clin Cancer Res. .

Abstract

Purpose: Mucoepidermoid carcinoma (MEC) is a poorly understood salivary gland malignancy with limited therapeutic options. Cancer stem cells (CSC) are considered drivers of cancer progression by mediating tumor recurrence and metastasis. We have shown that clinically relevant small molecule inhibitors of MDM2-p53 interaction activate p53 signaling and reduce the fraction of CSC in MEC. Here we examined the functional role of p53 in the plasticity and self-renewal of MEC CSC.

Experimental design: Using gene silencing and therapeutic activation of p53, we analyzed the cell-cycle profiles and apoptosis levels of CSCs in MEC cell lines (UM-HMC-1, -3A, -3B) via flow cytometry and looked at the effects on survival/self-renewal of the CSCs through sphere assays. We evaluated the effect of p53 on tumor development (N = 51) and disease recurrence (N = 17) using in vivo subcutaneous and orthotopic murine models of MEC. Recurrence was followed for 250 days after tumor resection.

Results: Although p53 activation does not induce MEC CSC apoptosis, it reduces stemness properties such as self-renewal by regulating Bmi-1 expression and driving CSC towards differentiation. In contrast, downregulation of p53 causes expansion of the CSC population while promoting tumor growth. Remarkably, therapeutic activation of p53 prevented CSC-mediated tumor recurrence in preclinical trials.

Conclusions: Collectively, these results demonstrate that p53 defines the stemness of MEC and suggest that therapeutic activation of p53 might have clinical utility in patients with salivary gland MEC.


Conflict of interest statement

Conflict of Interest: The remaining authors declare no potential conflicts of interest.

Figures

Figure 1:
Figure 1:. p53 regulates the fraction of mucoepidermoid carcinoma cancer stem cells in vitro.
A, Western blot showing baseline protein levels for MDM2, p53, p21 and Bmi-1 in human mucoepidermoid carcinoma (MEC) cell lines (UM-HMC-1, UM-HMC-3A, UM-HMC-3B). B, Western blots of MEC cells treated for 24 and 48 hours with MI-773, a 1st generation small molecule inhibitor of the MDM2-p53 interaction. C, Graph depicting the fraction of cancer stem cells (ALDHhighCD44high) measured by flow cytometry of MEC cell lines treated with MI-773 for 72 hours. D, Western blots verifying the impact on p53 protein expression in cells transduced with shRNA-p53 sequences. E, Graphs depicting cell density measurements of p53-silenced or vector control cells treated with MI-773 for 48 hours. Data was normalized against vehicle control. Graph inserts: half-maximal inhibitory concentrations (IC50) for MI-773. F, Western blots for MDM2, p53 and p21 of p53-silenced and control cells treated with MI-773 for 48 hours. G, Graph summarizing flow cytometry analysis of the ALDHhighCD44high cell fraction in vector control and p53-silenced cells treated with MI-773 for 72 hours. All results are representative of at least two independent experiments. Data was analyzed by two-tailed student’s t-test (α=0.05) in two group comparisons or one-way ANOVA followed by post-hoc Tukey (α=0.05) for multiple group comparisons. * P<0.05, ** P<0.001, *** P<0.0001, ns=not significant.
Figure 2:
Figure 2:. p53 silencing increases tumor growth and expands the fraction of cancer stem cells in vivo.
A, Macroscopic image of subcutaneous xenograft tumors generated with UM-HMC-3A cells transduced with shRNA-p53 or vector controls. B, Kaplan-Meier curves depicting tumor-free survival from (A). Failure was defined as tumors that reached a volume of 200 mm3. C, Graph depicting tumor weights at study endpoint. D, Macroscopic image of orthotopic xenograft tumors generated with UM-HMC-3A cells transduced with shRNA-p53 or vector control and injected in the submandibular glands of mice. E, Kaplan-Meier curves depicting tumor-free survival from (D). Failure was defined when salivary gland tumors were palpable. F, Graph depicting the weight of the submandibular glands at study endpoint. G, Photomicrographs of H&E and immunohistochemical analysis of ALDH1 in subcutaneous tumors from (A), scale bar = 100 μM. H, Average ALDH1 scores of 5 randomly selected microscopic fields per tumor (G). Microscopic fields were scored as follows: 0 – no cells with ALDH1 staining; 1 – up to 10 cells stained for ALDH1; 2 – more than 10 cells with high ALDH1 expression. I, Macroscopic image of subcutaneous xenograft tumors generated with UM-HMC-3B cells. J, Kaplan-Meier curves depicting tumor-free survival. Failure was defined as tumors that reached a volume of 200 mm3. K, Graph depicting tumor weight at study endpoint. L, Fraction of cancer stem cells (ALDHhighCD44high) in tumors generated with UM-HMC-3B cells transduced with shRNA-p53 or vector control. M, Macroscopic image of orthotopic xenograft tumors generated with UM-HMC-3B cells. N, Kaplan-Meier curves depicting tumor-free survival. Failure was defined when salivary gland tumors were palpable. O, Weight of the submandibular glands at study endpoint. P, Orthotopic xenograft experiment with UM-HMC-3B cells was repeated (n=13) and the fraction of cancer stem cells was analyzed. Graph depicting the fraction of cancer stem cells (ALDHhighCD44high) in tumors generated with UM-HMC-3B cells transduced with p53 shRNA or vector control. Samples with less than 3,000 tumor cells obtained from digested tissues were excluded from flow cytometry analysis. Kaplan-Meier graphs were analyzed using Gehan-Breslow-Wilcoxon test. All other data was analyzed by two-tailed student’s t-test. *P<0.05.
Figure 3:
Figure 3:. p53 activation does not preferentially kill cancer stem cells.
UM-HMC cell lines were treated with either vehicle or MI-773 (1μM) and subsequently analyzed for apoptotic cells using Annexin V staining. A, Graphs showing Annexin V staining in the bulk cell population 24–72 hours after MI-773 treatment. B, Graphs depicting the fraction of cancer stem cells (ALDHhighCD44high) in (A). C, Graphs showing the fraction of cancer stem cells (ALDHhighCD44high) undergoing apoptosis after treatment with MI-773 or vehicle control. All results are representative of at least two independent experiments. Data was analyzed by two-way ANOVA followed by post-hoc Bonferroni. *P<0.05, **P<0.01, ***P<0.001, ****P<0.0001, ns=not significant.
Figure 4:
Figure 4:. Activation of p53-p21 signaling shifts the cell cycle of mucoepidermoid carcinoma stem cells.
The cell cycle of UM-HMC cells was analyzed with DyeCycle-Orange after being treated with vehicle or MI-773 for 24 hours. A, Representative cell cycle plots for bulk (top) and cancer stem cells (bottom), ALDHhighCD44high, treated with vehicle or 1 μM MI-773 for 24 hours. Gates for the different cell cycle states were set based on the general cell population and kept the same for the cancer stem cells. B, Quantification of bulk and cancer stem cells in each phase of the cell cycle from (A). C, Western blot depicting the effect of shRNA-p21 or vector controls on p21 protein levels in UM-HMC cells. D, Western blot depicting the impact of increasing concentrations of MI-773 for 48 hours on p53 pathway activation in UM-HMC cells transduced with shRNA-p21 or vector control. E, Representative cell cycle plots of bulk cells or cancer stem cells (ALDHhighCD44high) in UM-HMC cells transduced with shRNA-p21 or vector control and treated with vehicle or MI-773 for 24 hours. F, Quantification of the cell cycle phases of bulk or cancer stem cells (ALDHhighCD44high) in UM-HMC cells transduced with shRNA-p21 or vector control. All results are representative of at least two independent experiments. Means not sharing any lower-case letters are significantly different by two-way ANOVA followed by post-hoc Tukey (α=0.001). ***P<0.001, ****P<0.0001, ns=not significant.
Figure 5:
Figure 5:. p53 activation blocks self-renewal and induces differentiation of cancer stem cells.
A-C, UM-HMC cell lines were sorted for cancer stem cells (ALDHhighCD44high) and non-cancer stem cells (ALDHlowCD44low) after being treated with MI-773 for 72 hours. Immediately after, (A) the collected cells were used to make whole-cell lysates for western blot analysis or (B) cultured in a 4-well chamber slide for two days prior to fixing and staining for pan-Cytokeratin and Dapi (scale bar=100μm). C, Graph depicting quantification of pan-Cytokeratin expression in (B). D-F, Cells were sorted for cancer stem cells and immediately plated in a 4-well chamber slide and cultured for 24 hours prior to treatment with 1 μM MI-773. D, Slides were fixed at 48- and 72-hours post-treatment and subsequently stained for pan-Cytokeratin and Bmi-1(scale bar=100μm). E, Graph depicting quantification of nuclear Bmi-1 expression in cancer stem cells or non-cancer stem cells. F, Graph depicting quantification of pan-Cytokeratin expression in cells treated with 1 μM MI-773 or vehicle. G, Representative micrographs of spheres formed from unsorted cells plated in sphere conditions and treated the following day with increasing doses of MI-773 for 7–9 days. H, Quantification of (G). I, Representative micrographs of spheres formed from unsorted UM-HMC cells plated in sphere conditions and treated 5 days after being plated. J, Quantification of (I). K, Representative micrograph of primary salispheres formed by UM-HMC cells transduced with shRNA-p53 or vector control cells. L, Quantification of (K). M, Microscopic view of single cell capture microfluidic device showing sphere growth over time (scale bar=100μm). N, Graph depicting sphere diameter from single cell salispheres generated by UM-HMC cells transduced with shRNA-p53 or vector control cells. Dotted lines depict cut-off for minimum sphere size (100μm). O, Graph depicting the number of secondary salispheres generated from UM-HMC-3B primary salispheres previously treated with MI-773 or vehicle for 7–9 days. P, Western blot of primary salispheres generated by UM-HMC cells transduced with shRNA-p53 or vector control cells. All results are representative of at least two independent experiments. Immunofluorescence was measured as the mean gray value normalized to DAPI. At least 5 arbitrary areas were selected for quantification. All sphere micrographs and quantification was done 7–9 days after being plated, unless noted otherwise. Two-tailed student’s t-test (α=0.05) was used for two group comparisons, two-way ANOVA with post-hoc Tukey (α=0.05) was used for pan-Cytokeratin time course, and one-way ANOVA with post-hoc Tukey (α=0.05) was used for all other comparisons. *P<0.05, ****P<0.0001. Means not sharing any lower-case letters are significantly different to each other.
Figure 6:
Figure 6:. Therapeutic induction of p53 prevents MEC tumor recurrence in mice.
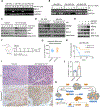
A, Reverse transcription polymerase chain reaction (RT-PCR) for Bmi-1, p21 and GAPDH of cells treated for 24 hours with increasing concentrations of MI-773. B, RT-PCR depicting time-course expression of Bmi-1 and GAPDH in cells treated with 10 μM MI-773. C, Western blot of cells treated with 10 μM MI-773 for 3 hours prior to addition of 25 μg/mL cycloheximide for up to 24 hours. D, Western blot of UM-HMC-3A cells treated for 24 hours with increasing concentrations of MD-224 (MDM2 degrader), or MI-1061 (MDM2 inhibitor used as a positive control for p53 activation). E, Western blot of UM-HMC-1 cells treated for 2 hours with 10 μM MG132 followed by 10 μM MI-773 for 4 hours. F, Schematic showing experimental design of tumor recurrence study. UM-HMC-3B subcutaneous xenograft tumors were allowed to grow to an average volume of 800 mm3 then randomly assigned to a treatment group. Mice were treated via oral gavage with either vehicle (N=9) or one dose of 200 mg/kg of MI-773 (N=8) three days prior to tumor resection. Weekly maintenance treatments of MI-773 (200 mg/kg) were given for four weeks after tumor resection. Mice were monitored weekly for tumor recurrence by palpability. G, Graph depicting tumor volumes in both experimental groups at start of treatment. H, Kaplan-Meier curves depicting tumor-free survival. Failure was defined as palpable subcutaneous tumors. Kaplan-Meier graphs were analyzed using the Gehan-Breslow-Wilcoxon test. I, Photomicrographs of hematoxylin/eosin staining (HE) and immunohistochemistry for Cytokeratin-7 of xenograft tumors three days after treatment with 200 mg/kg MI-773 (F). J, Graph depicting the quantification of Cytokeratin-7-positive cells in these tumors (F). K, Representation of the proposed effect of p53 on cancer stemness. p53 activation can be achieved by using small molecule inhibitors that block the interaction between p53 and its negative regulator MDM2. This leads to accumulation of p53 protein and activation of downstream signaling such as p53, the transcriptional target p21 and regulation of Bmi-1 protein expression. Downregulation of p53 results in increased cancer stem self-renewal leading to an expansion of the cancer stem cell population and increased tumor growth. Meanwhile, p53 activation results in decreased cancer stem cell self-renewal and increased differentiation resulting in depletion of the cancer stem pool and reduced tumor recurrence. This mechanism is partly mediated through the regulation of Bmi-1 protein expression by p53.

Similar articles

Cited by

References

    1. Seethala RR, Stenman G. Update from the 4th edition of the world health organization classification of head and neck tumours: tumors of the salivary gland. Head Neck Pathol 2017;11(1):55–67. - PMC - PubMed
    1. Chintakuntlawar AV, Okuno SH, Price KA. Systemic therapy for recurrent or metastatic salivary gland malignancies. Cancers Head Neck 2016;1:11. - PMC - PubMed
    1. Sultan I, Rodriguez-Galindo C, Al-Sharabati S, Guzzo M, Casanova M, Ferrari A. Salivary gland carcinomas in children and adolescents: a population-based study, with comparison to adult cases. Head Neck 2011;33(10):1476–81. - PubMed
    1. Jee KJ, Persson M, Heikinheimo K, Passador-Santos F, Aro K, Knuutila S, et al. Genomic profiles and CRTC1-MAML2 fusion distinguish different subtypes of mucoepidermoid carcinoma. Mod Pathol 2013;26(2):213–22. - PubMed
    1. Kang H, Tan M, Bishop JA, Jones S, Sausen M, Ha PK, et al. Whole-exome sequencing of salivary gland mucoepidermoid carcinoma. Clin Cancer Res 2017;23(1):283–8. - PMC - PubMed

Publication types

MeSH terms

Substances