. 2022 Oct 3;221(10):e202206140.
doi: 10.1083/jcb.202206140. Epub 2022 Sep 1.

Mid51/Fis1 mitochondrial oligomerization complex drives lysosomal untethering and network dynamics

Affiliations

Mid51/Fis1 mitochondrial oligomerization complex drives lysosomal untethering and network dynamics

Yvette C Wong et al. J Cell Biol. .

Abstract

Lysosomes are highly dynamic organelles implicated in multiple diseases. Using live super-resolution microscopy, we found that lysosomal tethering events rarely undergo lysosomal fusion, but rather untether over time to reorganize the lysosomal network. Inter-lysosomal untethering events are driven by a mitochondrial Mid51/Fis1 complex that undergoes coupled oligomerization on the outer mitochondrial membrane. Importantly, Fis1 oligomerization mediates TBC1D15 (Rab7-GAP) mitochondrial recruitment to drive inter-lysosomal untethering via Rab7 GTP hydrolysis. Moreover, inhibiting Fis1 oligomerization by either mutant Fis1 or a Mid51 oligomerization mutant potentially associated with Parkinson's disease prevents lysosomal untethering events, resulting in misregulated lysosomal network dynamics. In contrast, dominant optic atrophy-linked mutant Mid51, which does not inhibit Mid51/Fis1 coupled oligomerization, does not disrupt downstream lysosomal dynamics. As Fis1 conversely also regulates Mid51 oligomerization, our work further highlights an oligomeric Mid51/Fis1 mitochondrial complex that mechanistically couples together both Drp1 and Rab7 GTP hydrolysis machinery at mitochondria-lysosome contact sites. These findings have significant implications for organelle networks in cellular homeostasis and human disease.


Figures

Figure 1.
Figure 1.
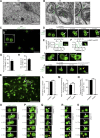
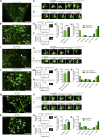
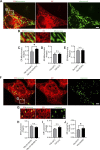
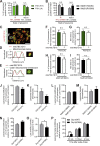
Inter-lysosomal tethering modulates lysosomal network dynamics. (A and B) TEM of two lysosomes tethered together (L, arrows) in untreated HeLa cells. Inset (B) shows inter-lysosomal tether. Scale bars, 1 μm (A); 50 nm (B). (C–F) Super-resolution SIM of inter-lysosomal (L-L) tethering (white arrows, D) in live HeLa cells (LAMP1-mGFP). Inset (D) shows inter-lysosomal tether formation. Corresponding linescans before tether formation (precontact; t = 0 s) and subsequent tethering (contact; t = 7 s) are shown in E and F. Scale bars, 1 μm (C); 0.5 μm (D). Video 1 corresponds to D. (G) Quantification of percentage of lysosomes in an inter-lysosomal tether (duration >10 s) from confocal live-cell microscopy videos (n = 25 cells). (H) Quantification of minimum duration of inter-lysosomal tethering (n = 88 events from 25 cells). (I) Examples of SIM imaging of L-L tethers (white arrows) in live HeLa cells (LAMP1-mGFP). Scale bar, 0.5 μm. (J) SIM imaging of L-L tethering (white arrows) and subsequent L-L contact untethering (yellow arrow) in live HeLa cells (LAMP1-mGFP). Scale bar, 0.5 μm. (K) Confocal microscopy image of lysosomes in live HeLa cells (LAMP1-mGFP) showing inset corresponding to O (t = 0 s). Scale bar, 5 μm. (L) The majority of inter-lysosomal tethers undergo untethering events rather than fusion within 120 s of initial contact formation (n = 64 events from 25 cells). (M and N) Rate of lysosomal untethering events vs. fusion events in live HeLa cells in events/min (M) and frequency of events over time of lysosomal untethering events vs. fusion events (%; N; n = 149 total events from 14 cells). (O–S) Confocal time-lapse microscopy of L-L tethering (white arrows) and subsequent untethering (yellow arrows) in live HeLa cells (LAMP1-mGFP). Scale bars, 0.5 μm. Video 2 corresponds to S. Mean ± SEM; unpaired two-tailed t test (L, M, and N); ***, P < 0.001 (L, M, and N).
Figure S1.
Figure S1.
EM and super-resolution imaging of inter-lysosomal tethering dynamics. (A) TEM of inter-lysosomal tethering (L) near mitochondria (M) in untreated HeLa cells. Scale bar, 50 nm. (B) Quantification of percentage of lysosomes in an inter-lysosomal tether (distance between lysosomal membranes <30 nm) from EM images (n = 38 cells). Mean ± SEM. (C and D) Super-resolution live-cell SIM of inter-lysosomal tethering (white arrows) in live HeLa cells (LAMP1-mGFP). Scale bars, 0.5 μm. (E) Confocal time-lapse imaging of inter-lysosomal (L-L) tethering over time (white arrows) in live HeLa cells (LAMP1-mGFP). Scale bar, 0.5 μm. (F and G) Confocal time-lapse microscopy of lysosomal clusters composed of multiple inter-lysosomal tethers (white arrows, inset in G) which subsequently untether (yellow arrows, inset in G). Scale bars, 5 μm (F); 0.5 μm (G). Video 3 corresponds to G. (H–J) Quantification of state of inter-lysosomal tether (remain tethered or undergo untethering event) after 30 s (H), 60 s (I) or 120 s (J) of initial tether formation (n = 88 events from 25 cells). (K and L) Super-resolution live-cell SIM showing L-L untethering event marked by mitochondria–lysosome (M-L) untethering event (yellow arrows, inset in L) in live HeLa cells (mitochondria mApple-TOM20; lysosome LAMP1-mGFP). Scale bars, 5 μm (K); 0.5 μm (L). (M–P) Linescans corresponding to L showing inter-lysosomal tethering (L-L) and mitochondria–lysosome tethering (M-L) at t = 0 s (M and N) followed by inter-lysosomal untethering and mitochondria–lysosome untethering events at t = 7 s (O and P; mitochondria mApple-TOM20; lysosome LAMP1-mGFP). Mean ± SEM; unpaired two-tailed t test (H–J); N.S. not significant (I); *, P = 0.02 (H); *, P = 0.029 (J).
Figure 2.
Figure 2.
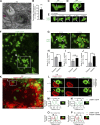
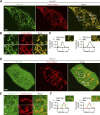
Mitochondrial contacts promote inter-lysosomal untethering events. (A) Super-resolution SIM of lysosomes (LAMP1-mGFP) and mitochondria (mApple-TOM20) in live HeLa cells showing inset corresponding to C (t = 0 s). Scale bar, 5 μm. (B) Confocal microscopy of lysosomes (LAMP1-mGFP) and mitochondria (mApple-TOM20) in live HeLa cells showing inset corresponding to D (t = 0 s). Scale bar, 5 μm. (C) SIM imaging of inter-lysosomal (L-L) untethering (yellow arrow; bottom) event marked by mitochondria–lysosome (M-L) untethering event (yellow arrow; top) in live HeLa cell (mitochondria mApple-TOM20; lysosome LAMP1-mGFP). Scale bar, 0.5 μm. Video 4 corresponds to C. (D) Confocal time-lapse microscopy showing lysosomal cluster of L-L tethers subsequently undergoing untethering events (yellow arrows; bottom) marked by mitochondria–lysosome (M-L) untethering (yellow arrows; top) in live HeLa cells (mitochondria mApple-TOM20; lysosome LAMP1-mGFP). Scale bar, 0.5 μm. Video 5 corresponds to D. (E and F) Linescans showing inter-lysosomal tethering (L-L) and mitochondria–lysosome tethering (M-L) from SIM imaging corresponding to C (t = 84 s) before untethering events. (G) The majority of inter-lysosomal untethering events are marked by mitochondria (Observed), compared with mitochondrial localization by random chance (Expected) in live HeLa cells (n = 97 events from 24 cells). (H and I) Quantification of fate of L-L tethering (remain tethered or undergo untethering event) after 10 s of no mitochondrial tether (H; n = 18 total events from 11 cells (– mitochondria), or a mitochondria–lysosome (M-L) untethering event (I; n = 86 total events from 24 cells (M-L contact untether). (J and K) Histogram of L-L untethering event compared with mitochondria–lysosome (M-L) formation (J) or untethering (K; n >80 events from 24 cells). (L and M) Histogram of L-L initial formation compared with mitochondria–lysosome (M-L) formation (L) or untethering (M; n >80 events from 24 cells). Mean ± SEM; Fisher’s exact test (G), unpaired two-tailed t test (H and I); ***, P < 0.001 (G and H); *, P = 0.0171 (I).
Figure S2.
Figure S2.
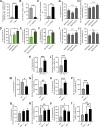
Rab7 GTP hydrolysis and Drp1 GTP hydrolysis machinery regulate inter-lysosomal tethers. (A) Percentage of inter-lysosomal (L-L) untethering events marked by no mitochondria (− Mito) or by mitochondria in contact with at least one of the two lysosomes (+ Mito; n = 97 total events from 24 cells). (B) Mitochondria–lysosome (M-L) untethering is more closely coupled to L-L untethering vs. formation (n = 86 total events from 24 cells). (C) Mitochondria–lysosome (M-L) formation is more closely coupled to L-L formation vs. untethering (n = 80 total events from 24 cells). (D) Quantification of increased percentage of lysosomes in inter-lysosomal tether upon inhibition of Rab7 GTP hydrolysis by constitutively active GTP-bound mutant Rab7(Q67L) in live HeLa cells; n = 25 cells (Control); n = 13 cells (Rab7(WT)); n = 15 cells (Rab7(Q67L)). (E) Quantification of increased percentage of lysosomes in inter-lysosomal tether by the Rab7-GAP mutant TBC1D15(D397A) that has defective GAP activity in live HeLa cells; n = 18 cells (TBC1D15(WT)); n = 24 cells (TBC1D15(D397A)). (F) Quantification of increased percentage of lysosomes in inter-lysosomal tether by mutant Fis1 (LA) that has defective oligomerization and is unable to recruit TBC1D15 to mitochondria in live HeLa cells; n = 26 cells (Fis1(WT)); n = 16 cells (Fis1(LA)). (G and H) Quantification of percentage of lysosomes in mitochondria–lysosome (M-L) tethers (G) and mitochondria–lysosome (M-L) tethering duration (H) for SKIP(WT) and mutants SKIP(AAA) and SKIP(ΔRUN); n = 75 events from 15 cells (SKIP(WT)); n = 80 events from 16 cells (SKIP(AAA)); n = 75 events from 14 cells (SKIP(ΔRUN)). (I and J) Quantification of percentage of lysosomes in L-L tethers (I) and L-L tethering duration (J) for SKIP(WT) and mutants SKIP(AAA) and SKIP(ΔRUN); n = 75 events from 15 cells (SKIP(WT)); n = 71 events from 16 cells (SKIP(AAA)); n = 75 events from 14 cells (SKIP(ΔRUN)). (K and L) Loss of Fis1 disrupts inter-lysosomal contact formation (K) and tethering duration (L); n = 31 events from 10 cells (WT HCT116); n = 75 events from 15 cells (Fis1−/− HCT116). (M and N) Loss of Mid51 disrupts mitochondria–lysosome contact formation (M) and tethering duration (N); n = 67 events from 15 cells (WT HeLa); n = 65 events from 15 cells (Mid51−/− HeLa). (O and P) Loss of Mid51 disrupts inter-lysosomal contact formation (O) and tethering duration (P); n = 55 events from 15 cells (WT HeLa); n = 65 events from 15 cells (Mid51−/− HeLa). (Q and R) Loss of Drp1 and Mff disrupt mitochondria–lysosome contact tethering duration (R) but not contact formation (Q); n = 47 events from 10 cells (WT HCT116); n = 55 events from 11 cells (Drp1−/− HCT116); n = 75 events from 15 cells (Mff/ HCT116). (S and T) Loss of Drp1 and Mff disrupt inter-lysosomal contact formation (S) and tethering duration (T); n = 31 events from 10 cells (WT HCT116); n = 55 events from 11 cells (Drp1−/− HCT116); n = 72 events from 15 cells (Mff/ HCT116). Mean ± SEM; unpaired two-tailed t test (A–C, E, F, and K–P); ANOVA with Tukey’s post hoc test (D, G–J, and Q–T); N.S. not significant (G–J); ***, P < 0.001 (A–C and E); *, P = 0.02 (D); *, P = 0.02 (F); ***, P = 0.0005 (K); ***, P = 0.0006 (L); *, P = 0.0102 (M); **, P = 0.0058 (N); ***, P = 0.0004 (O); ***, P = 0.0003 (P); *, P = 0.031 (R, WT vs. Drp1−/−); **, P = 0.0061 (R, WT vs. Mff−/−); *, P = 0.0105 (S, WT vs. Drp1−/−); *, P = 0.0305 (S, WT vs. Mff−/−); **, P = 0.0054 (T, WT vs. Drp1−/−); **, P = 0.0064 (T, WT vs. Mff/).
Figure 3.
Figure 3.
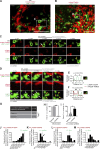
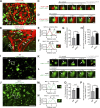
Inter-lysosomal untethering is mediated by Rab7 GTP hydrolysis via mitochondrial TBC1D15 recruitment by Fis1 oligomers. (A–F) Confocal time-lapse microscopy showing increased inter-lysosomal (L-L) tether formation (white arrows; A and B) and prolonged tethering (white arrows; insets in C and D) upon inhibition of Rab7 GTP hydrolysis by constitutively active GTP-bound mutant Rab7(Q67L) in live HeLa cells (Rab7(WT)-GFP or Rab7(Q67L)-GFP). Corresponding linescans show L-L untethering for Rab7(WT) (E) vs. prolonged tethering for Rab7(Q67L) (F). Scale bars, 5 μm (A, B); 0.5 μm (C, D). (G and H) Quantification and histogram of prolonged L-L tethering duration for Rab7(Q67L) (n = 39 events from 13 cells (Rab7(WT)); n = 42 events from 14 cells (Rab7(Q67L)). (I–N) Confocal time-lapse microscopy showing increased L-L tether formation (white arrows; I and J) and prolonged tethering (white arrows; insets in K and L) by the Rab7-GAP mutant TBC1D15(D397A) that has defective GAP activity in live HeLa cells (lysosome LAMP1-mGFP). Corresponding linescans show L-L untethering for TBC1D15(WT) (M) vs. prolonged tethering for TBC1D15(D397A) (N). Scale bars, 5 μm (I and J); 0.5 μm (K and L). (O and P) Quantification and histogram of prolonged L-L tethering duration for TBC1D15(D397A) (n = 51 events from 17 cells (TBC1D15(WT)); n = 48 events from 16 cells (TBC1D15(D397A)). (Q–V) Confocal time-lapse microscopy showing increased L-L tether formation (white arrows; Q and R) and prolonged tethering (white arrows; insets in S and T) by mutant Fis1 (LA) that has defective oligomerization and is unable to recruit TBC1D15 to mitochondria in live HeLa cells (lysosome LAMP1-mGFP). Corresponding linescans show L-L untethering for Fis1(WT) (U) vs. prolonged tethering for Fis1(LA) (V). Scale bars, 5 μm (Q and R); 0.5 μm (S and T). (W and X) Quantification and histogram of prolonged L-L tethering duration for Fis1(LA) (n = 54 events from 18 cells (Fis1(WT)); n = 36 events from 12 cells (Fis1(LA)). Mean ± SEM; unpaired two-tailed t test (G, O, and W); ***, P < 0.001 (G and W); *, P = 0.0327 (O).
Figure 4.
Figure 4.
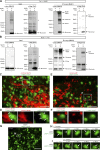
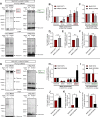
Coupled oligomerization of a mitochondrial Mid51/Fis1 complex. (A and B) Quantification of immunoprecipitated WT Mid51 (A) and coimmunoprecipitated WT Fis1 (B) in a Mid51/Fis1 complex, with and without Mid51, confirming that IP of Mid51 and co-IP of Fis1 is dependent on the presence of Mid51 (lane 2); n = 3 independent experiments. See Fig. S3 A for representative blots. (C and D) Quantification of immunoprecipitated WT Mid51 (C) and coimmunoprecipitated WT Fis1 (D) in a Mid51/Fis1 complex, with and without Fis1, confirming that co-IP of Fis1 is dependent on the presence of Fis1 (lane 2); n = 3 independent experiments. See Fig. S3 B for representative blots. (E) IP of myc-tagged WT Mid51 and co-IP of Flag-tagged Fis1(WT) or mutant Fis1(LA), with corresponding input. *, Nonspecific bands. (F and G) Protein quantification and stoichiometry of the immunoprecipitated mitochondrial Mid51/Fis1 complex with Fis1(WT) or Fis1(LA), revealing Fis1 species (monomer, tetramer; F) and Mid51 species (monomer, dimer, tetramer, and HMW; G), normalized to monomer levels per condition, quantified from IP immunoblot (n = 3 independent experiments). (H–J) Quantification showing coupled oligomerization of immunoprecipitated Mid51 and coimmunoprecipitated Fis1 in a Mid51/Fis1 complex. Fis1(LA) leads to normal Mid51/Fis1 binding (Fis1 IP monomer/Mid51 IP monomer ratio; H), decreased Fis1 oligomerization (Fis1 IP [tetramer/monomer ratio]; I) and decreased Mid51 oligomerization (Mid51 IP [HMW/monomer ratio]; J); quantified from IP immunoblot; n = 3 independent experiments. Mean ± SEM; unpaired two-tailed t test (A–D and H–J); ***, P < 0.001 (A, B, D, I, and J); N.S., not significant (C and H). Source data are available for this figure: SourceData F4.
Figure S3.
Figure S3.
Mid51 interacts with Fis1 in a Mid51/Fis1 complex and regulates mitochondrial and lysosomal tethering. (A) IP of myc-tagged WT Mid51 and co-IP of Flag-tagged WT Fis1, with corresponding input, with and without Mid51, confirming that IP of Mid51 and co-IP of Fis1 is dependent on the presence of Mid51 (lane 2). See Fig. 4, A and B, for quantification. *, Nonspecific bands. (B) IP of myc-tagged WT Mid51 and co-IP of Flag-tagged WT Fis1, with corresponding input, with and without Fis1, confirming that co-IP of Fis1 is dependent on the presence of Fis1 (lane 2). See Fig. 4, C and D, for quantification. *, Nonspecific bands. (C and D) Confocal time-lapse microscopy showing lysosomal cluster of inter-lysosomal tethers which are also tethered to mitochondria (white arrows, inset in D) in live HeLa cells expressing Mid51 (mitochondria mCherry-Mid51; lysosome LAMP1-mGFP). Scale bars, 5 μm (C); 0.5 μm (D). (E and F) Confocal time-lapse microscopy showing few inter-lysosomal tethers or mitochondria–lysosome tethers (inset in F) in live HeLa cells expressing Mff (mitochondria mCherry-Mff; lysosome LAMP1-mGFP). Scale bars, 5 μm (E); 0.5 μm (F). (G–I), Confocal time-lapse microscopy showing prolonged inter-lysosomal (L-L) tethering (white arrows; inset in H; I) in live HeLa cells expressing Mid51 (lysosome LAMP1-mGFP). Scale bars, 5 μm (G); 0.5 μm (H and I). Video 8 corresponds to H. Source data are available for this figure: SourceData FS3.
Figure 5.
Figure 5.
Regulation of lysosomal tethering dynamics by Mid51 on mitochondria. (A–F) Confocal time-lapse microscopy showing increased mitochondria-lysosomal (M-L) tether formation (white arrows; A and B) and prolonged M-L tethering (white arrows; insets in C and D) in live HeLa cells expressing Mid51 (mitochondria mCherry-Mid51; lysosome LAMP1-mGFP) compared with Mff (mitochondria mCherry-Mff). Corresponding linescans show M-L untethering for Mff (E) vs. prolonged tethering for Mid51 (F). Scale bars, 5 μm (A and B); 0.5 μm (C and D). Video 6 corresponds to D, and Video 7 corresponds to C. (G) Quantification of increased percentage of lysosomes in M-L tethers for Mid51; n = 13 cells (Mff); n = 25 cells (Mid51). (H) Quantification of prolonged M-L tethering duration for Mid51; n = 68 events from 13 cells (Mff); n = 151 events from 25 cells (Mid51). (I–N) Confocal time-lapse microscopy showing lysosomes (I and J) and prolonged inter-lysosomal (L-L) tethering (white arrows; insets in K and L) in live HeLa cells expressing Mid51 (mCherry-Mid51; lysosome LAMP1-mGFP) compared with Mff (mCherry-Mff). Corresponding linescans show L-L untethering for Mff (M) vs. prolonged tethering for Mid51 (N). Scale bars, 5 μm (I and J); 0.5 μm (K and L). (O) Quantification of percentage of lysosomes in L-L tethers; n = 13 cells (Mff); n = 25 cells (Mid51). (P) Quantification of prolonged L-L tethering duration for Mid51; n = 40 events from 13 cells (Mff); n = 68 events from 21 cells (Mid51). Mean ± SEM; unpaired two-tailed t test (G, H, O, and P); N.S., not significant (O); *, P = 0.029 (G); **, P = 0.002 (H); *, P = 0.035 (P).
Figure 6.
Figure 6.
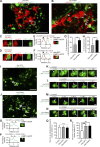
Drp1 GTP hydrolysis modulates lysosomal tethering dynamics. (A–F) Confocal time-lapse microscopy showing increased lysosomes in mitochondria–lysosome (M-L) tether formation (white arrows; A and B) and insets (white arrows; C and D) in live HeLa cells upon inhibition of Drp1 GTP hydrolysis by mutant Drp1 (K38A) (mitochondria mito-BFP [pseudocolored red]; lysosome LAMP1-mGFP). Corresponding linescans show M-L not in contact for Drp1(WT) (E) vs. M-L tethering for Drp1(K38A) (F). Scale bars, 5 μm (A and B); 0.5 μm (C and D). (G) Quantification of increased percentage of lysosomes in mitochondria–lysosome (M-L) tethers for Drp1(K38A); n = 21 cells (Drp1(WT)); n = 20 cells (Drp1(K38A)). (H) Quantification of increased percentage of lysosomes in inter-lysosomal (L-L) tethers for Drp1(K38A); n = 21 cells (Drp1(WT)); n = 20 cells (Drp1(K38A)). (I–P) Confocal time-lapse microscopy showing increased L-L tether formation (white arrows; I and J) and prolonged L-L tethering (white arrows; insets in K–N) in live HeLa cells expressing Drp1(WT) and Drp1(K38A) (lysosome LAMP1-mGFP). Corresponding linescans show prolonged L-L tethering for Drp1(WT) (O) and Drp1(K38A) (P). Scale bars, 5 μm (I and J); 0.5 μm (K–N). (Q) Quantification of mitochondria–lysosome (M-L) tethering duration for Drp1(WT) and Drp1(K38A); n = 38 events from 19 cells (control); n = 82 events from 21 cells (Drp1(WT)); n = 104 events from 19 cells (Drp1(K38A)). (R) Quantification of prolonged L-L tethering duration for Drp1(WT) and Drp1(K38A); n = 88 events from 25 cells (control); n = 36 events from 15 cells (Drp1(WT)); n = 58 events from 15 cells (Drp1(K38A)). Mean ± SEM; unpaired two-tailed t test (G and H), ANOVA with Tukey’s post hoc test (Q and R); N.S., not significant (Q); **, P = 0.0097 (G); *, P = 0.044 (H); ***, P < 0.001 (R).
Figure S4.
Figure S4.
Regulation of mitochondrial and lysosomal contacts with the ER. (A and B) Confocal microscopy image of ER contacts with mitochondria (inset in B) in live HeLa cells (ER, red [mCherry-ER]; mitochondria, green [mEmerald-TOMM20]). Scale bars, 5 μm (A); 1 μm (B). (C–E) Effect of TBC1D15 (WT vs. D397A), Fis1 (WT vs. LA), and Drp1 (WT vs. K38A) on ER-mitochondria contacts. C, n = 45 cells (TBC1D15(WT)); n = 57 cells (TBC1D15(D397A)); D, n = 33 cells (Fis1(WT)); n = 27 cells (Fis1(LA)); E, n = 29 cells (Drp1(WT)); n = 38 cells (Drp1(K38A)). (F and G) Confocal microscopy image of ER contacts with lysosomes (inset in G) in live HeLa cells (ER, red [mCherry-ER]; lysosome, green [mTagBFP2-Lysosomes-20]). Scale bars, 5 μm (F); 1 μm (G). (H–J) Effect of TBC1D15 (WT vs. D397A), Fis1 (WT vs. LA), and Drp1 (WT vs. K38A) on ER-lysosome contacts. H, n = 45 cells (TBC1D15(WT)); n = 57 cells (TBC1D15(D397A)); I, n = 33 cells (Fis1(WT)); n = 27 cells (Fis1(LA)); J, n = 19 cells (Drp1(WT)); n = 23 cells (Drp1(K38A)). Mean ± SEM; unpaired two-tailed t test (C–E and H–J); N.S., not significant (D, E, H, and I); *, P = 0.0157 (C); *, P = 0.0432 (J).
Figure S5.
Figure S5.
Fis1 oligomerization regulates TBC1D15 recruitment to mitochondria. (A–C) Confocal microscopy representative images of TBC1D15 recruitment to mitochondria in HeLa cells expressing Fis1(WT) (TBC1D15, green [YFP-TBC1D15]; mitochondria, red [Tom20-mApple]). Inset in B, corresponding linescans in C. Scale bars, 5 μm (A); 1 μm (B). (D–F) Confocal microscopy representative images of TBC1D15 in the cytosol in HeLa cells expressing Fis1(LA) oligomerization mutant (TBC1D15, green [YFP-TBC1D15]; mitochondria, red [Tom20-mApple]). Inset in E, corresponding linescans in F. Scale bars, 5 μm (D); 1 μm (E).
Figure 7.
Figure 7.
Distinct Mid51 mutants differentially modulate Fis1 oligomerization. (A) IP of myc-tagged Mid51(WT) or Drp1-binding domain mutant Mid51(Y240N) and co-IP of Flag-tagged Fis1, with corresponding input. *, Nonspecific bands. (B and C) Protein quantification and stoichiometry of the immunoprecipitated mitochondrial Mid51/Fis1 complex with Mid51(WT) or Mid51(Y240N) revealing Mid51 species (monomer, dimer, tetramer, and HMW; B) and Fis1 species (monomer, tetramer; C), normalized to monomer levels per condition, quantified from IP immunoblot (n = 3 independent experiments). (D–F) Quantification showing Drp1-binding domain mutant Mid51(Y240N) does not disrupt Fis1 oligomerization in a Mid51/Fis1 complex. Mid51(Y240N) shows normal Mid51/Fis1 binding (Fis1 IP monomer/Mid51 IP monomer ratio; D), Mid51 oligomerization (Mid51 IP [HMW/monomer ratio]; E), and Fis1 oligomerization (Fis1 IP [tetramer/monomer ratio]; F); quantified from IP immunoblot; n = 3 independent experiments. (G) IP of myc-tagged Mid51(WT) or oligomerization domain mutant Mid51(R169W) and co-IP of Flag-tagged Fis1, with corresponding input. *, Nonspecific bands. (H and I) Protein quantification and stoichiometry of the immunoprecipitated mitochondrial Mid51/Fis1 complex with Mid51(WT) or Mid51(R169W), revealing Mid51 species (monomer, dimer, tetramer, and HMW; H) and Fis1 species (monomer, tetramer; I), normalized to monomer levels per condition, quantified from IP immunoblot (n = 3 independent experiments). (J–L) Quantification showing oligomerization domain mutant Mid51(R169W) disrupts Fis1 oligomerization in a Mid51/Fis1 complex. Mid51(R169W) shows normal Mid51/Fis1 binding (Fis1 IP monomer/Mid51 IP monomer ratio; J), increased Mid51 oligomerization (Mid51 IP [HMW/monomer ratio]; K), and decreased Fis1 oligomerization (Fis1 IP [tetramer/monomer ratio]; L); quantified from IP immunoblot; n = 3 independent experiments. Mean ± SEM; unpaired two-tailed t test (D–F and J–L); N.S., not significant (D–F and J); *, P = 0.017 (K); *, P = 0.021 (L). Source data are available for this figure: SourceData F7.
Figure 8.
Figure 8.
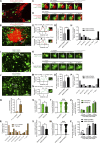
Distinct Mid51 mutants differentially regulate lysosomal tethering and network dynamics. (A–F) Confocal time-lapse microscopy showing prolonged mitochondria-lysosomal (M-L) tether formation (white arrows; insets in C and D) with oligomerization domain mutant Mid51(R169W) in live HeLa cells compared with Drp1-binding domain mutant Mid51(Y240N) (mitochondria mCherry-Mid51(Y240N) or mCherry-Mid51(R169W), lysosome LAMP1-mGFP). Corresponding linescans show M-L untethering for Mid51(Y240N) (E) vs. prolonged tethering for Mid51(R169W) (F). Scale bars, 5 μm (A and B); 0.5 μm (C and D). Video 9 corresponds to D. (G and H) Quantification and histogram of prolonged mitochondria–lysosome (M-L) tethering duration for Mid51(R169W); n = 101 events from 18 cells (Mid51(Y240N)); n = 99 events from 15 cells (Mid51(R169W)). (I–N) Confocal time-lapse microscopy showing prolonged inter-lysosomal (L-L) tether formation (white arrows; insets in K and L) with oligomerization domain mutant Mid51(R169W) in live HeLa cells compared with dominant optic atrophy mutant Mid51(Y240N) (lysosome LAMP1-mGFP). Corresponding linescans show M-L untethering for Mid51(Y240N) (M) vs. prolonged tethering for Mid51(R169W) (N). Scale bars, 5 μm (I and J); 0.5 μm (K and L). Video 10 corresponds to L. (O and P) Quantification and histogram of prolonged L-L tethering duration for Mid51(R169W); n = 51 events from 19 cells (Mid51(Y240N)); n = 55 events from 13 cells (Mid51(R169W)). (Q and R) Quantification and corresponding histogram showing the motility of individual lysosomes is increased after an untethering event (Free lyso) compared with while in an inter-lysosomal tether (In L-L contact; n = 18 events from 7 cells). (S–U) Quantification showing Fis1 (LA) oligomerization mutant disrupts lysosomal motility (S), lysosomal distribution (T), and lysosomal cargo trafficking dynamics (U). S, n = 82 events from 16 cells (Fis1(WT)); n = 79 events from 17 cells (Fis1(LA)); T, n = 2,994 lysosomes from 20 cells (Fis1(WT)); n = 4,141 lysosomes from 20 cells (Fis1(LA)); U, n = 20 cells (30 min), 20 cells (1.5 h), 19 cells (4 h; Fis1(WT)); n = 18 cells (30 min), 18 cells (1.5 h), 18 cells (4 h; Fis1(LA)). (V–X) Quantification showing Mid51(R169W) oligomerization mutant disrupts lysosomal motility (V), lysosomal distribution (W), and lysosomal cargo trafficking dynamics (X). V, n = 79 events from 17 cells (Mid51(Y240N); n = 74 events from 16 cells (Mid51(R169W)); W, n = 1,846 lysosomes from 15 cells (Mid51(Y240N)); n = 2,191 lysosomes from 15 cells (Mid51(R169W)); X, n = 12 cells (30 min), 15 cells (1.5 h), 13 cells (4 h; Mid51(Y240N)); n = 25 cells (30 min), 25 cells (1.5 h), 21 cells (4 h; Mid51(R169W)). Mean ± SEM; unpaired two-tailed t test (G, O, and Q–X); ***, P < 0.001 (G,T,W, and X); **, P = 0.002 (O); *, P = 0.0383 (Q); *, P = 0.0281 (S); *, P = 0.0396 (U); **, P = 0.0027 (V); **, P = 0.0021 (X).
Figure S6.
Figure S6.
Mid51 oligomerization domain mutant preferentially disrupts mitochondrial and lysosomal untethering dynamics. (A–C) Confocal time-lapse microscopy of mitochondria–lysosome (M-L) tethering (white arrows; inset in B) with corresponding linescan (C) showing prolonged M-L tethering duration by oligomerization domain mutant Mid51(R169W) in live HeLa cells (mitochondria mCherry-Mid51(R169W), lysosome LAMP1-mGFP). Scale bars, 5 μm (A); 0.5 μm (B). (D–F) Confocal time-lapse microscopy of inter-lysosomal (L-L) tethering (white arrows; inset in E) with corresponding linescan (F) showing prolonged L-L tethering duration by Mid51(R169W) in live HeLa cells (lysosome LAMP1-mGFP). Scale bars, 5 μm (D); 0.5 μm (E). (G and H) Quantification of percentage of lysosomes in mitochondria–lysosome (M-L) tethers (G) and L-L tethers (H) in Mid51(Y240N) and Mid51(R169W) conditions in live HeLa cells; n = 19 cells (Mid51(Y240N)); n = 15 cells (Mid51(R169W)). (I and J) Quantification in CRISPR-Cas9 genetically edited HCT116 mutant Mid51 cells of percentage of lysosomes in mitochondria–lysosome (M-L) tethers; I, n = 21 cells (Mid51(Y240N)); n = 18 cells (Mid51(R169W)); prolonged mitochondria–lysosome (M-L) tether duration by Mid51(R169W)); J; n = 38 events from 16 cells (Mid51(Y240N)); n = 36 events from 17 cells (Mid51(R169W)). Mean ± SEM; unpaired two-tailed t test (G–J); N.S., not significant (G–I); *, P = 0.019 (J).
Figure S7.
Figure S7.
Rab7 and TBC1D15 localization and regulation of lysosomal networks by Fis1 and Mid51. (A) Quantification of lysosomes in mitochondria–lysosome (M-L) tether (left) or not in M-L tether (right) for the percentage of lysosomes positive for Rab7 in Fis1(WT) and Fis1(LA) conditions in live HeLa cells; n = 181 total lysosomes from 19 cells (Fis1(WT)); n = 170 total lysosomes from 13 cells (Fis1(LA)). (B) Quantification of lysosomes in mitochondria–lysosome (M-L) tether (left) or not in M-L tether (right) for the percentage of lysosomes positive for Rab7 in Mid51(Y240N) and Mid51(R169W) conditions in live CRISPR-Cas9 genetically edited HCT116 mutant Mid51 cells; n = 55 total lysosomes from 10 cells Mid51(Y240N)); n = 71 total lysosomes from 13 cells (Mid51(R169W)). (C–E) Localization of mitochondrial-targeted TBC1D15 in live HeLa cells (mCherry-tagged mitoTBC1D15 artificially targeted to the outer mitochondrial membrane via the TOM20 transmembrane domain) showing localization around the mitochondrial matrix (mEmerald-mito) with corresponding linescan (D), and linescan showing colocalization with the outer mitochondrial membrane (mEmerald-TOM20; E). (F and G) Quantification of percentage of lysosomes in inter-lysosomal (L-L) tether (F) and L-L tether duration (G) in Fis1(LA) live HeLa cells with or without mitoTBC1D15 (n = 75 events from 15 cells [− mitoTBC1D15]; n = 75 events from 15 cells [+ mitoTBC1D15]). (H and I) Quantification of percentage of lysosomes in L-L tether (H) and L-L tether duration (I) in live CRISPR-Cas9 genetically edited HCT116 mutant Mid51(R169W) cells with or without mitoTBC1D15 (n = 75 events from 15 cells [− mitoTBC1D15]; n = 75 events from 15 cells [+ mitoTBC1D15]). (J and K) Fis1(LA) oligomerization mutant does not regulate lysosomal acidification (percentage of lysosomes positive for LysoTracker; J) or lysosomal density (normalized to Fis1(WT); K). J, n = 20 cells (Fis1(WT)), n = 18 cells (Fis1(LA)); K, n = 15 cells (Fis1(WT)), n = 15 cells (Fis1(LA)). (L and M) Mid51(R169W) oligomerization mutant does not regulate lysosomal acidification (percentage of lysosomes positive for LysoTracker; L) or lysosomal density (normalized to Mid51(Y240N); M). L, n = 21 cells (Mid51(Y240N)); n = 25 cells (Mid51(R169W)); M, n = 15 cells (Mid51(Y240N)), n = 15 cells (Mid51(R169W)). (N–P) Quantification showing Drp1(K38A) mutant does not regulate lysosomal acidification (N) but disrupts lysosomal motility (O) and lysosomal cargo trafficking dynamics (P). N, n = 26 cells (Drp1(WT)); n = 19 cells (Drp1(K38A)); O, n = 73 events from 16 cells (Drp1(WT)); n = 74 events from 16 cells (Drp1(K38A)); P, n = 21 cells (30 min), 17 cells (1.5 h), 15 cells (4 h; Drp1(WT)); n = 17 cells (30 min), 23 cells (1.5 h), 16 cells (4 h; Drp1(K38A)). Mean ± SEM; unpaired two-tailed t test (A, B, and F–P); N.S., not significant (A, B, and F–N); *, P = 0.037 (O); ***, P < 0.001 (P).
Figure S8.
Figure S8.
Model of mitochondrial and lysosomal network regulation via coupled Mid51/Fis1 oligomerization complex. (A) Model—Normal: (1 and 2) Mid51 and Fis1 undergo coupled oligomerization in a Mid51/Fis1 complex on the outer mitochondrial membrane; (3 and 4) Mid51 oligomers promote Drp1 oligomerization and subsequent Drp1 GTP hydrolysis via Mff (red arrow), while Fis1 oligomers promote TBC1D15 (Rab7-GAP) recruitment to mitochondria to drive Rab7 GTP hydrolysis at mitochondria–lysosome tethers (green arrow). Inhibiting either Mid51/Fis1 oligomerization (Fis1(LA)), Rab7 GTP hydrolysis (TBC1D15(D397A)), or Drp1 GTP hydrolysis (Drp1(K38A); Mid51) disrupts this pathway (grey arrows). See Discussion for details. (B) Rab7 GTP hydrolysis promotes mitochondria–lysosome and inter-lysosomal contact untethering, while Drp1 GTP hydrolysis promotes mitochondrial fission and inter-mitochondrial untethering, resulting in untethering events which help redistribute both mitochondrial and lysosomal networks. (C) Model—Mid51 mutants); left: Mid51(Y240N) Drp1-binding domain mutant which is linked to dominant optic atrophy disrupts Drp1 recruitment but not Mid51 oligomerization, leading to the selective inhibition of Drp1 GTP hydrolysis; right: Mid51(R169W) oligomerization domain mutant which is potentially linked to Parkinson’s disease disrupts Mid51 oligomerization but not Drp1 recruitment, leading to uncoupled and defective Fis1 oligomerization and the selective inhibition of Rab7 GTP hydrolysis, resulting in the misregulation of lysosomal tethering dynamics.

Similar articles

Cited by

References

    1. Ballabio, A., and Bonifacino J.S.. 2020. Lysosomes as dynamic regulators of cell and organismal homeostasis. Nat. Rev. Mol. Cell Biol. 21:101–118. 10.1038/s41580-019-0185-4 - DOI - PubMed
    1. Belton, T.B., Leisten E.D., Cisneros J., and Wong Y.C.. 2022. Live-cell microscopy of mitochondria-lysosome contact site formation and tethering dynamics. STAR Protoc. 3:101262. 10.1016/j.xpro.2022.101262 - DOI - PMC - PubMed
    1. Bonam, S.R., Wang F., and Muller S.. 2019. Lysosomes as a therapeutic target. Nat. Rev. Drug Discov. 18:923–948. 10.1038/s41573-019-0036-1 - DOI - PMC - PubMed
    1. Charif, M., Wong Y.C., Kim S., Guichet A., Vignal C., Zanlonghi X., Bensaid P., Procaccio V., Bonneau D., Amati-Bonneau P., et al. . 2021. Dominant mutations in MIEF1 affect mitochondrial dynamics and cause a singular late onset optic neuropathy. Mol. Neurodegener. 16:12. 10.1186/s13024-021-00431-w - DOI - PMC - PubMed
    1. Cisneros, J., Belton T.B., Shum G.C., Molakal C.G., and Wong Y.C.. 2022. Mitochondria-lysosome contact site dynamics and misregulation in neurodegenerative diseases. Trends Neurosci. 45:312–322. 10.1016/j.tins.2022.01.005 - DOI - PMC - PubMed

Publication types

MeSH terms