. 2022 Sep;25(9):1163-1178.
doi: 10.1038/s41593-022-01150-1. Epub 2022 Aug 30.

Aberrant astrocyte protein secretion contributes to altered neuronal development in multiple models of neurodevelopmental disorders

Affiliations

Aberrant astrocyte protein secretion contributes to altered neuronal development in multiple models of neurodevelopmental disorders

Alison L M Caldwell et al. Nat Neurosci. 2022 Sep.

Abstract

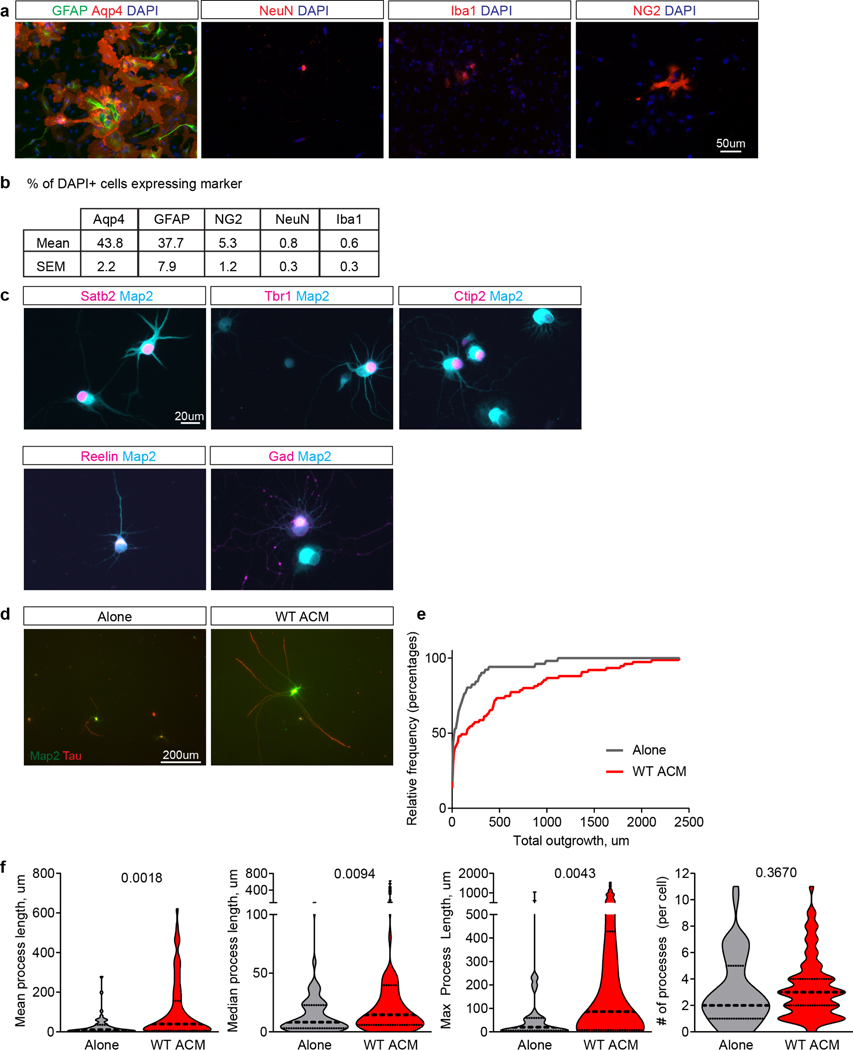
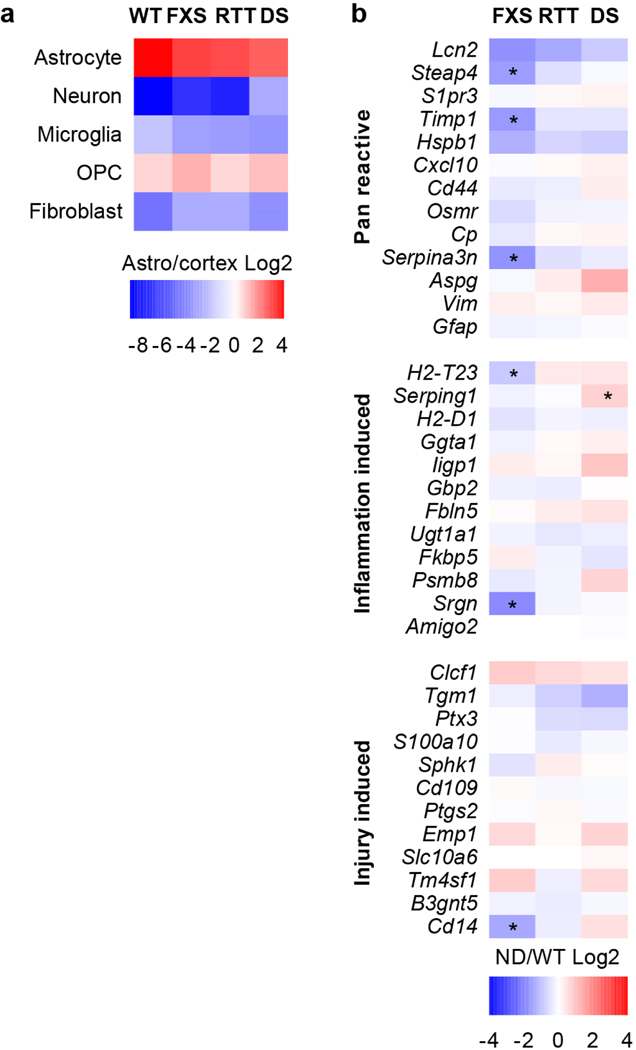
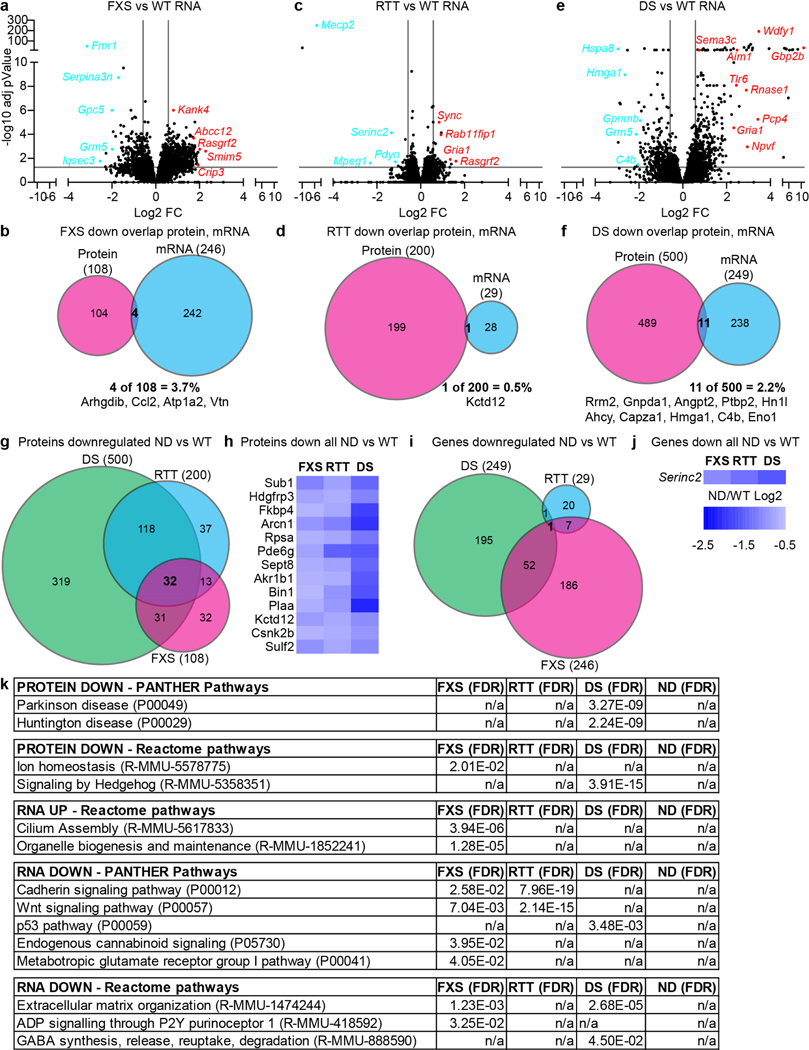
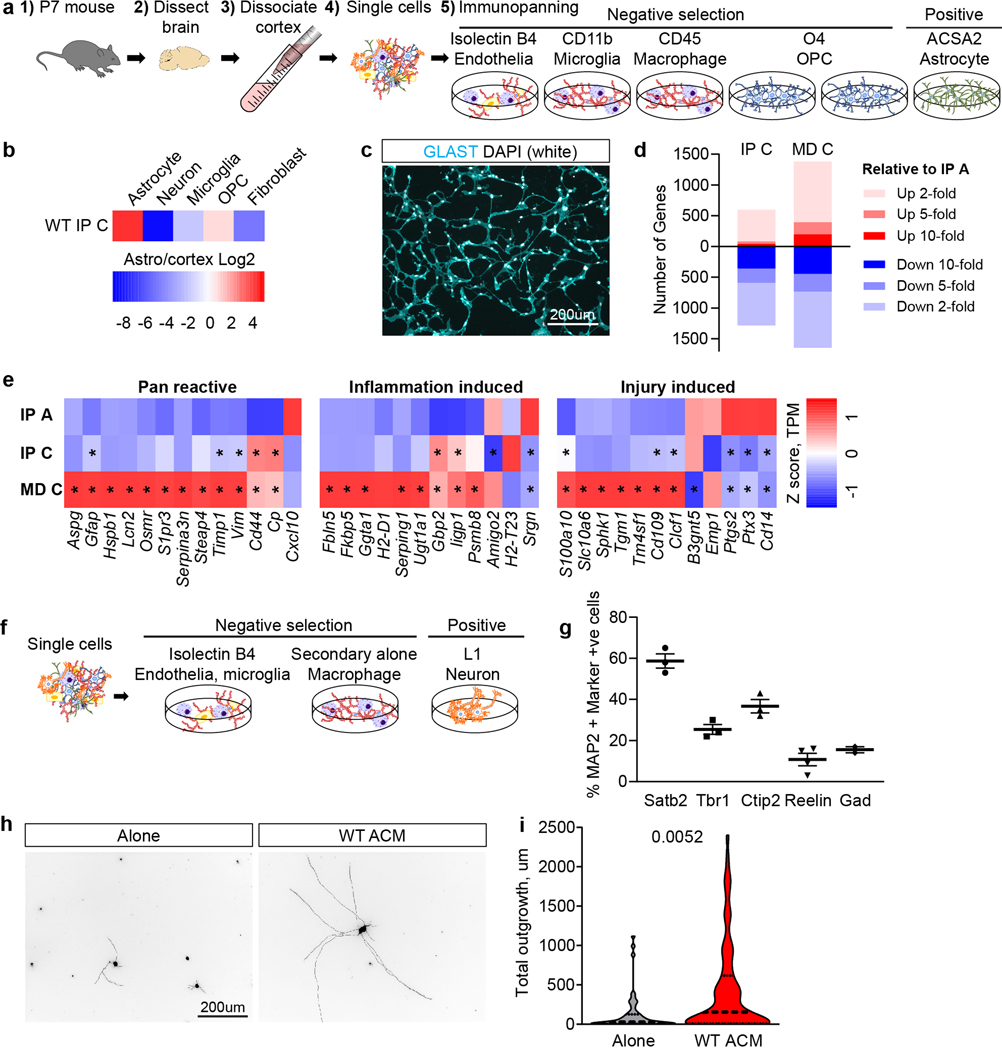
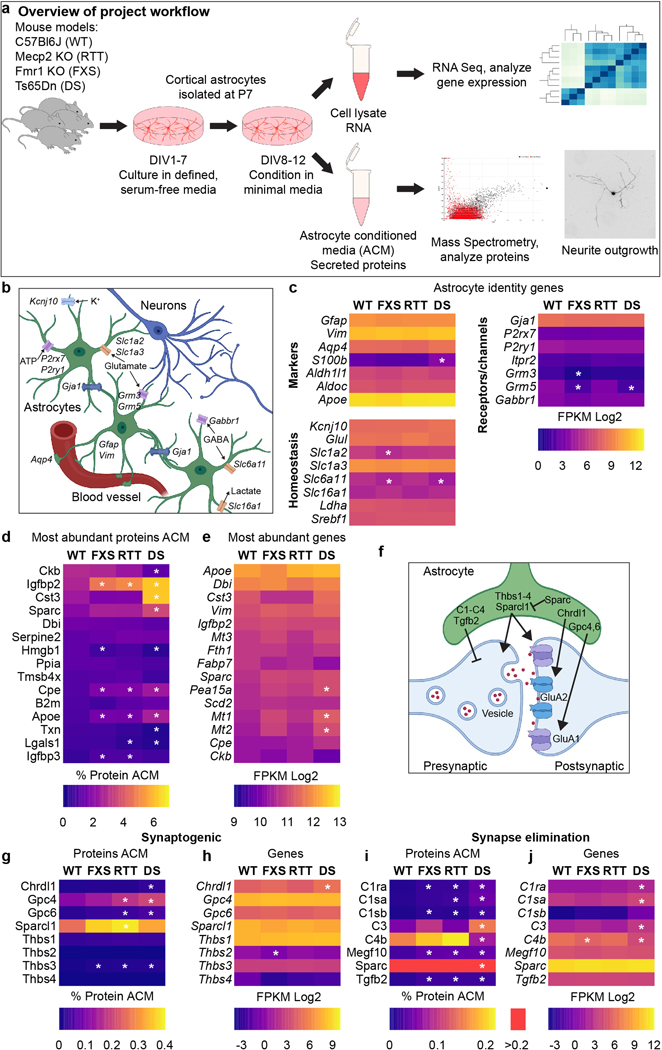
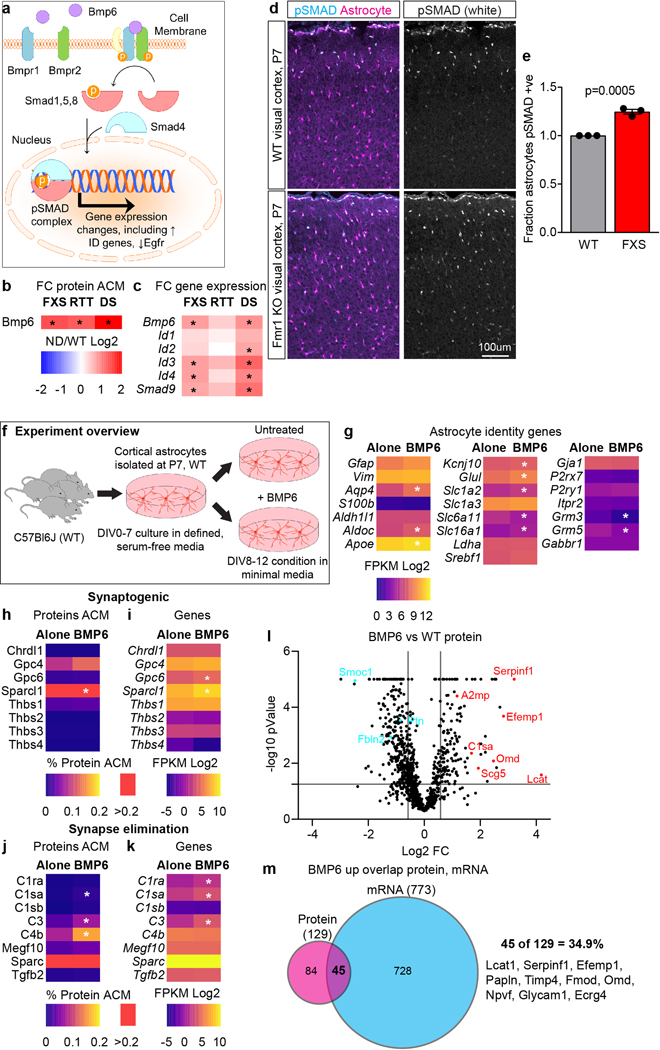
Astrocytes negatively impact neuronal development in many models of neurodevelopmental disorders (NDs); however, how they do this, and if mechanisms are shared across disorders, is not known. In this study, we developed a cell culture system to ask how astrocyte protein secretion and gene expression change in three mouse models of genetic NDs (Rett, Fragile X and Down syndromes). ND astrocytes increase release of Igfbp2, a secreted inhibitor of insulin-like growth factor (IGF). IGF rescues neuronal deficits in many NDs, and we found that blocking Igfbp2 partially rescues inhibitory effects of Rett syndrome astrocytes, suggesting that increased astrocyte Igfbp2 contributes to decreased IGF signaling in NDs. We identified that increased BMP signaling is upstream of protein secretion changes, including Igfbp2, and blocking BMP signaling in Fragile X and Rett syndrome astrocytes reverses inhibitory effects on neurite outgrowth. This work provides a resource of astrocyte-secreted proteins in health and ND models and identifies novel targets for intervention in diverse NDs.


Conflict of interest statement

Competing Interests

The authors declare no competing interests.

Figures

Extended Data Fig. 1.
Extended Data Fig. 1.. Immunopanned astrocyte and neuron cultures for study of NDs.
a,b. Immunostaining IP-astrocyte cultures for cell type markers reveals that the majority of cells express astrocyte-associated proteins Gfap and Aqp4, while rarely expressing NeuN (neuronal marker), Iba1 (microglial marker) or NG2 (oligodendrocyte precursor cell marker), N=15 experiments (3WT, 1 RTT, 3 FXS, 8 DS; no differences were observed between ND and WT expression of cell markers). c. Example images of WT immunopanned neurons cultured for 2 days in WT ACM, and immunostained for MAP2 to identify neurons and antibodies against cortical neuron layer-enriched marker genes. Data analyzed in Figure 1g. N=3 experiments SATB2, TBR1, CTIP2; N=4 Reelin; N=2 GAD. d. Example images from Figure 1h, prior to processing and analysis. WT neurons immunostained with MAP2 (dendrites, green) and tau (axon, red). e. Relative frequency of total neurite outgrowth, example experiment shown, same data as Figure 1i. f. Examination of additional measures of neurite growth for experiments in Figure 1h,i. Violin plot: dashed line median, dotted lines 25th and 75th percentile. Number of neurons: alone = 51, WT ACM = 75. Statistics by 2-sided Mann-Whitney test.
Extended Data Fig. 2.
Extended Data Fig. 2.. IP astrocytes reproduce in vivo alterations to ND astrocytes.
a. qRT-PCR for cell-type markers from mRNA collected from IP astrocytes compared to P7 mouse cortex demonstrates enrichment for astrocytes (Gfap), a depletion of neurons (Syt1), microglia (Cd68), fibroblasts (Fgfr4), and a decrease in oligodendrocyte precursor cells (OPCs; Cspg4) in WT and ND IP astrocyte cultures. N=6 cultures per genotype. WT data same as in Figure 1b. b. Reactive astrocyte markers from pan reactive, inflammation-induced and injury-induced reactive astrocytes are not consistently altered in IP astrocyte cultures from ND compared to WT, demonstrating cultures are not reactive. Data from RNA sequencing. N=6 cultures WT, RTT, FXS; 4 DS. *adjusted p<0.05, FPKM>1 and fold change ≥1.5 calculated with DESeq2.
Extended Data Fig. 3.
Extended Data Fig. 3.. Altered protein secretion and gene levels of ND astrocytes.
a,c,e. Volcano plot of genes expressed by astrocytes at FPKM >1, plotted as Log2FC against -log10 p-value comparing each disorder to WT: FXS (a), RTT (c) and DS (e). Each dot represents a gene; top right sector genes significantly upregulated (FC>1.5, adjusted p-value <0.05), examples in red; top left sector genes significantly downregulated (FC<−1.5, adjusted p-value <0.05), examples in turquoise, calculated with DESeq2. b,d,f. Venn diagram of overlap between proteins and genes with decreased level in FXS (b), RTT (d) and DS (f) ACM and astrocytes g,h. Venn diagram showing overlap in proteins downregulated in all ND (g), and heatmap of top altered proteins ranked by abundance in WT ACM (h). i,j. Venn diagram showing number of genes downregulated (i) and corresponding heatmap (j) of overlapping altered genes. Scale bar in j also applies to heatmap in h. k. Pathway analysis of proteins and genes altered in ND astrocytes compared to WT demonstrates some overlapping and some unique alterations in ND astrocyte function compared to WT, performed using PANTHER over-representation test with Fisher’s Exact test and FDR corrected. Proteomics, N=6 cultures per genotype, p<0.05, abundance >0.01%, fold change between WT and ND ≥1.5. RNASeq, N=6 cultures WT, RTT, FXS; 4 DS, adjusted p<0.05, FPKM>1, fold change between ND and WT ≥1.5.
Extended Data Fig. 4.
Extended Data Fig. 4.. Excess Igfbp2 in ACM inhibits neurite outgrowth.
a. Expression of IGF family members in cortical cell types (data from Zhang et al., 2014). b,c. Addition of Igfbp2 protein to WT ACM inhibits WT neurite outgrowth, which is reduced by adding IGF1. Addition of CPE protein to WT ACM does not inhibit WT neurite outgrowth. b. Example images of WT neurons cultured for 48 hours, conditions as marked (image merge of MAP2 + Tau). c. Quantification of total neurite outgrowth. Example experiment shown, repeated 2 times with same result, number of neurons: control alone=49, control ACM=50, CPE alone=36, CPE ACM=46, Igfbp2 alone=44, Igfbp2 ACM=48, Igfbp2 ACM + Igf1=39. d. smFISH against Igfbp2 mRNA in the P7 visual cortex in Aldh1l1-GFP mice to mark astrocytes, combined with probe for OPCs (Cspg4). See Figure 4g for quantification. N=3 WT mice. e. Example images from Figure 4d prior to processing and analysis. Neurons immunostained with MAP2 (dendrites, green) and tau (axon, red). f. Relative frequency distribution plot of total neurite outgrowth length, pooled data from 3 experiments, same data as Figure 4e. g. Adding the IgG control antibody to WT ACM does not alter neurite outgrowth. Example experiment shown, repeated twice with same result. Number of neurons: control alone=216, control ACM=333, Igfbp2-Ab alone=257, Igfbp2-Ab ACM=267, IgG con-Ab alone=277, IgG con-Ab ACM=266. Violin plots (c,g), dashed line marks median, dotted lines 25th and 75th percentile. Statistics by Kruskal-Wallis one-way ANOVA on ranks with Dunn’s test for multiple comparisons, p values compared to control alone condition (c).
Extended Data Fig. 5.
Extended Data Fig. 5.. Blocking Igfbp2 in RTT reduces neural developmental deficits.
a,c,e. Example images from Figure 5a,c,e prior to processing and analysis. Neurons cultured for 48 hours in RTT (a), FXS (c) or DS (e) ACM and immunostained with MAP2 (dendrites, green) and tau (axon, red). b,d,f. Relative frequency distribution plot of total neurite outgrowth, pooled data from 3 (b), 4 (d), 5 (f) experiments per graph, same data as Figure 5b,d,f. Number of neurons: RTT (b): alone=439, WT ACM=549, RTT ACM=633, RTT ACM + Igfbp2-Ab=621; FXS (d): alone=492, WT ACM=608, FXS ACM=621, FXS ACM + Igfbp2-Ab=647; DS (f): alone=716, WT ACM=992, DS ACM=765, DS ACM + Igfbp2-Ab=858. g. Relative frequency distribution plot of neuronal cell body size, pooled data from 3 experiments, same data as Figure 5g. h-l Cell body size of upper layer cortical neurons is not different between WT and RTT mice, and unaffected by the Igfbp2 neutralizing antibody. h. Schematic of the experiment: P2 mice were injected in the visual cortex with AAV synapsin-GFP +/− antibody, and tissue collected at P7 and GFP-expressing neurons imaged, with the region to be imaged identified by the presence of the fluorescently labeled antibody. i,j. Cell body area in upper layer neurons is unaltered in RTT compared to WT mice. i. Analysis by mice, graph average ± s.e.m., individual data points represent mice, N = 4 WT and 4 RTT mice, statistics by 2-sided T-test. j. Analysis by cells, graph individual data points represent cells, dashed line represents the mean, n = 162 WT and 177 RTT cells, statistics by 2-sided T-test. k,l. Cell body area in upper layer neurons in RTT mice is unaffected by an Igfbp2 neutralizing antibody. k. Analysis by mice, graph average ± s.e.m., individual data points represent mice, N = 5 control-Ab and 5 Igfbp2-Ab mice, statistics by 2-sided T-test. l. Analysis by cells, graph individual data points represent cells, dashed line represents the mean, n = 183 control-Ab and 195 Igfbp2-Ab cells, statistics by 2-sided T-test.
Extended Data Fig. 6.
Extended Data Fig. 6.. Activating WT astrocyte BMP signaling mimics ND astrocytes.
a. Relative expression of BMP family members in purified cell types in the cortex shows enrichment for BMP target genes in astrocytes (data from Zhang et al, 2014). b,c. BMP6-treated astrocytes have thinner more branched processes (b), and increased expression of both GFAP (cyan) and AQP4 (magenta) (c). Example images shown, experiment repeated 3 times with same effect. d. Volcano plot of genes expressed by astrocytes at FPKM >1, plotted as Log2FC against -log10 p-value comparing BMP6-treated and untreated WT astrocytes. Each dot represents a gene; top right sector genes significantly upregulated (FC>1.5, adjusted p-value <0.05), examples in red; top left sector genes significantly downregulated (FC<−1.5, adjusted p-value <0.05), examples in turquoise, calculated with DESeq2. e. Venn diagram showing overlap between proteins and genes downregulated in WT astrocytes treated with BMP6. For mass spectrometry and RNA Sequencing N=6 cultures, half of each culture treated with BMP6 and other half left untreated. Proteomics, p<0.05, abundance >0.01%, fold change ≥1.5 calculated with Patternlab. RNASeq, adjusted p<0.05, FPKM>1, fold change ≥1.5 calculated with DESeq2.
Extended Data Fig. 7.
Extended Data Fig. 7.. Blocking ND astrocyte BMP signaling reduces neural deficits.
a,b. BMP6-treated WT astrocytes show protein secretion (a) and gene expression (b) downregulations that overlap with ND astrocytes. N=6 cultures WT, FXS, RTT, DS, plus 6 cultures WT +/− BMP6 proteomics; N=6 cultures WT, FXS, RTT; 4 DS, plus 6 cultures WT +/− BMP6 RNA sequencing. c. Example images from Figure 7d prior to processing and analysis. Neurons immunostained with MAP2 (dendrites, green) and tau (axon, red). d. Relative frequency distribution plot of total neurite outgrowth length, same data as Figure 7e. Data from 3 experiments, number of neurons: alone=467, WT ACM=733, BMP6 WT ACM=610.e. Relative frequency distribution plot of total neurite outgrowth length, same data as Figure 7f. Data from 3 experiments, number of neurons: alone=378, WT ACM=380, BMP6 WT ACM=506, BMP6 WT ACM + Igfbp2 blocking Ab=335. f. Example images from Figure 7h prior to processing and analysis. Neurons immunostained with MAP2 (dendrites, green) and tau (axon, red). g. Relative frequency distribution plot of total neurite outgrowth, same data as Figure 7i. Data from 3 experiments, number of neurons: alone=923, WT ACM=1164, FXS ACM=1132, Noggin FXS ACM=1099. h. Relative frequency distribution plot of total neurite outgrowth, same data as Figure 7j. Data from 3 experiments, number of neurons: alone=238, WT ACM=279, RTT ACM=387, Noggin RTT ACM=365. i. Example images of cortical neurons treated with noggin at the time of plating, ± WT ACM or ± FXS ACM (image merge of MAP2 + Tau). j. Quantification of total neurite outgrowth, data from 3 experiments. Number of neurons: alone=2197, alone + noggin=1981, WT ACM=2167, WT ACM + noggin=2421, FXS ACM=2060, FXS ACM + noggin=2523. Violin plots dashed line marks median, dotted lines 25th and 75th percentile. Statistics by Kruskal-Wallis one-way ANOVA on ranks with Dunn’s test for multiple comparisons.
Figure 1.
Figure 1.. Immunopanned astrocyte and neuron cultures for study of NDs.
a. Schematic: P7 mouse cortex is digested with papain producing a single cell suspension, followed by negative selection to deplete unwanted cells (endothelia, microglia, oligodendrocyte precursor cells (OPCs)), and positive selection for astrocytes using an antibody against ACSA2. b. qRT-PCR for cell-type markers from IP astrocyte mRNA compared to P7cortex demonstrates enrichment for astrocytes (Gfap), and depletion of neurons (Syt1), microglia (Cd68), fibroblasts (Fgfr4), OPCs (Cspg4) in WT astrocyte cultures. N=6 cultures. c. Immunostaining IP-astrocyte cultures for astrocyte marker GLAST (cyan, Slc1a3) and nuclei (white, DAPI) demonstrates majority of cells express this protein, repeated 3 separate cultures. d-e. Comparison of cultured immunopanned astrocyte (IP C) gene expression to acutely isolated immunopanned astrocytes (IP A) and traditional astrocyte cultures (MD C) using RNA sequencing. d. Number of differentially expressed genes between IP A and IP C or MD C. N=3 cultures/condition; adjusted p<0.05, TPM>10, calculated with DESeq2. e. Relative expression of reactive astrocyte genes between IP A, IP C and MD C astrocytes, plotted as z-score of TPM. *adjusted p<0.05 compared to IP A calculated with DESeq2. f-i. WT ACM supports WT neurite outgrowth. f. Schematic of immunopanning procedure to isolate cortical neurons: P7 mouse cortex is digested with papain producing a single cell suspension, followed by negative selection to deplete unwanted cells (endothelia, microglia), and positive selection for neurons using an antibody against NCAM-L1. g. Characterization of cortical neuron subtypes in immunopanned cultures, percentage of MAP2 positive cells expressing the cortical neuron subtype marker. Graph mean±s.e.m., individual data points average of experiment. N=3 experiments SATB2, TBR1, CTIP2; N=4 Reelin; N=2 GAD. h-i. Culturing WT cortical neurons for 48 hours with WT astrocyte conditioned media (ACM) increases neurite outgrowth. h. Example images, neurons immunostained with MAP2 and tau, merged image shown. i. Quantification of total neurite outgrowth (dendrite + axon; MAP2 + tau). Example experiment shown, repeated 3 times with same result. Number of neurons: alone=51, WT ACM=75. Violin plot: dashed line median, dotted lines 25th and 75th percentile. Statistics by 2-sided Mann-Whitney test. See also Extended Data Figure 1; Table S1.
Figure 2.
Figure 2.. IP astrocytes reproduce in vivo alterations to ND astrocytes.
a. Overview of project workflow. b,c. WT and ND IP astrocytes express many known astrocyte markers at high levels. b. Astrocytes (green) express cell-specific markers that determine their cellular identity; contact blood vessels and neuronal synapses to engage in metabolism and homeostatic functions; bind and respond to neurotransmitters released by neurons. c. Heatmap shows few differences between ND and WT expression of astrocyte identity and function markers. d. Heatmap of most abundant proteins, ranked by level in WT ACM. e. Heatmap of most abundant mRNA, ranked by level in WT astrocytes. f-j. Schematic of the tripartite synapse (f) displaying astrocyte-secreted proteins important for regulating synapse formation and function. g-j. Heatmaps of secreted synaptogenic proteins in ACM (g) and expression of synaptogenic genes (h), as well as abundance of synapse eliminating proteins in ACM (i) and corresponding expression of synapse elimination genes (j). For the heatmaps a darker shade of red indicates a value above the top of the scale. Proteomics, N=6 cultures per genotype, *p<0.05, abundance >0.01%, fold change between WT and ND ≥1.5 calculated with T-fold test in Patternlab. RNASeq, N=6 cultures WT, RTT, FXS; 4 cultures DS, *adjusted p<0.05, FPKM>1, fold change between ND and WT ≥1.5 calculated with DESeq2. See also Extended Data Figure 2; Tables S2, S3, S4.
Figure 3.
Figure 3.. Altered protein secretion and gene levels of ND astrocytes.
a,c,e. Volcano plot of proteins present in ACM at >0.01%, plotted as Log2FC against -log10 p-value comparing each disorder to WT: FXS (a), RTT (c) and DS (e). Each dot represents a protein; top right sector proteins significantly upregulated (FC>1.5, p-value <0.05), examples in red; top left sector proteins significantly downregulated (FC<−1.5, p-value <0.05), examples in turquoise; calculated with T-fold test in Patternlab. b,d,f. Venn diagram of overlap between proteins and genes with increased level in FXS (b), RTT (d) and DS (f) ACM and astrocytes. g,h. Venn diagram showing overlap in proteins upregulated in all NDs (g), and heatmap of top altered proteins ranked by protein abundance in FXS ACM (h). i,j. Venn diagram showing number of genes upregulated in all NDs (i) and corresponding heatmap (j) of altered genes. Scale bar in j also applies to heatmap in h. k. Pathway analysis of proteins upregulated in ND ACM compared to WT demonstrates overlapping alterations in ND astrocyte function compared to WT, performed using PANTHER over-representation test with Fisher’s Exact test and FDR corrected. Proteomics, N=6 cultures per genotype, p<0.05, abundance >0.01%, fold change between WT and ND ≥1.5 calculated with T-fold test in Patternlab. RNASeq, N=6 cultures WT, RTT, FXS; 4 cultures DS, adjusted p<0.05, FPKM>1, fold change between ND and WT ≥1.5 calculated with DESeq2. See also Extended Data Figure 3; Tables S5, S6, S7, S8, S9.
Figure 4.
Figure 4.. Excess Igfbp2 in ACM inhibits neurite outgrowth.
a. Schematic of IGF signaling via the PI3K/Akt pathway. b,c. Protein secretion (b) and gene expression (c) profiles of IGF family members in WT and ND astrocytes. Proteomics, N=6 cultures/genotype, *p<0.05, abundance >0.01%, fold change between WT and ND ≥1.5 calculated with T-fold test in Patternlab. RNASeq, N=6 cultures WT, RTT, FXS; 4 cultures DS, *adjusted p<0.05, FPKM>1, fold change between ND and WT ≥1.5 calculated with DESeq2. d,e. Excess Igfbp2 in ACM inhibits WT neurite outgrowth. d. Example images WT neurons grown 48 hours, conditions as marked (image merge of MAP2 + Tau). e. Quantification total neurite outgrowth normalized to control alone condition. Violin plot: dashed line median, dotted lines 25th and 75th percentile. Data from 3 separate experiments, number of neurons: control alone=447, control ACM=626, Igfbp2 alone=438, Igfbp2 ACM=596, Igfbp2 + Ab alone=376, Igfbp2 + Ab + ACM=562. Statistics by Kruskal-Wallis one-way ANOVA on ranks with Dunn’s test for multiple comparisons. f, g. Astrocytes express Igfbp2 mRNA in the P7 mouse visual cortex. f. smFISH against Igfbp2 mRNA in Aldh1l1-GFP mice to mark astrocytes, combined with probe for neurons (Tubb3). Left panels overview of cortex across all layers, right panel high power image from L2/3. g. Analysis of images in f, expression of Igfbp2 mRNA within astrocytes, neurons and OPCs. See Figure S4d for OPC image. N=3 WT mice. Bar graph mean±s.e.m., individual data points mice; statistics by one-way ANOVA with Tukey’s test for multiple comparisons. h-j. Immunostaining for Igfbp2 in each ND and littermate WT visual cortex at P7 (RTT - Mecp2 KO; FXS – Fmr1 KO; DS - Ts65Dn TG) reveals an increase in extracellular Igfbp2 in RTT and intracellular Igfbp2 in DS. h. Example images of L2/3 astrocytes (cyan, Aldh1l1-GFP) immunostained for Igfbp2 (magenta). i. Quantification of extracellular Igfbp2. j. Quantification of intracellular Igfbp2. N=6 littermate pairs RTT and FXS; 7 littermate pairs DS. Bar graph mean±s.e.m., individual points mice, same mouse in i and j for each genotype denoted with same shape; statistics two-sided T-test. See also Extended Data Figure 4.
Figure 5.
Figure 5.. Blocking Igfbp2 in RTT reduces neural developmental deficits.
a-f. Application of an Igfbp2-neutralizing antibody reduces WT neurite outgrowth inhibition induced by RTT ACM. a,c,e. Example images neurons cultured for 48 hours in RTT (a), FXS (c) or DS (e) ACM (merged images of MAP2 + Tau). b,d,f. Quantification total neurite outgrowth, normalized to alone condition. Violin plot: dashed line median, dotted lines 25th and 75th percentile. Data from 3 (b), 4 (d), 5 (f) separate experiments. Number of neurons: RTT (b): alone=439, WT ACM=549, RTT ACM=633, RTT ACM + Igfbp2-Ab=621; FXS (d): alone=492, WT ACM=608, FXS ACM=621, FXS ACM + Igfbp2-Ab=647; DS (f): alone=716, WT ACM=992, DS ACM=765, DS ACM + Igfbp2-Ab=858. Statistics by Kruskal-Wallis one-way ANOVA on ranks with Dunn’s test for multiple comparisons. g. Application of an Igfbp2 neutralizing antibody reduces WT neuronal cell body size deficits induced by RTT ACM. Graph mean ± s.e.m., individual data points represent average per experiment, data from 3 experiments. Statistics by Kruskal-Wallis one-way ANOVA on ranks with Dunn’s test for multiple comparisons. h-l. Delivery of an Igfbp2-neutralizing antibody increases cell body size of deep layer neurons in P7 visual cortex of RTT mice. h. Schematic: P2 mice were injected in the visual cortex with AAV synapsin-GFP +/− antibody, tissue collected at P7 and GFP-expressing neurons imaged. i,j. Cell body area in deep layer neurons is decreased in RTT compared to WT mice. i. Analysis by mice, graph average ± s.e.m., individual data points mice, N=4 WT, 4 RTT mice, statistics by 2-sided T-test. j. Analysis by cells, graph individual data points represent cells, dashed line at mean, n=133 WT, 189 RTT cells, statistics by 2-sided T-test. k,l. Cell body area in deep layer neurons in RTT mice is increased by an Igfbp2-Ab. k. Analysis by mice, graph average ± s.e.m., individual data points mice, N=5 control-Ab, 5 Igfbp2-Ab mice, statistics by 2-sided T-test. l. Analysis by cells, graph individual data points represent cells, dashed line at mean, n=219 control-Ab, 274 Igfbp2-Ab cells, statistics by 2-sided T-test. See also Extended Data Figure 5.
Figure 6.
Figure 6.. Activating WT astrocyte BMP signaling mimics ND astrocytes.
a. Schematic of canonical BMP signaling pathway. b. Fold change in BMP6 protein in ND ACM compared to WT. c. Fold change in gene expression for BMP family members in ND astrocytes compared to WT. Proteomics, N=6 cultures per genotype, *p<0.05, abundance >0.01%, fold change between WT and ND ≥1.5 calculated with T-fold test in Patternlab. RNASeq, N=6 cultures WT, RTT, FXS; 4 cultures DS, *adjusted p<0.05, FPKM>1, fold change between ND and WT ≥1.5 calculated with DESeq2. d,e. Increase in the proportion of pSMAD+ astrocytes in FXS visual cortex at P7. d. Example images of astrocytes (magenta, Aldh1l1-GFP) and pSMAD (cyan) in the visual cortex at P7 of WT (Fmr1+/y) and KO (Fmr1-/y). e. Quantification of the proportion of astrocytes that are positive for pSMAD. N=3 WT, 3 FXS mice; bar graph mean±s.e.m., individual data points mice; statistics by 2-sided T-test. f. Experimental schematic for BMP6 treatment of WT astrocytes. g-m. Characterization of protein secretion and gene expression profiles of BMP6-treated WT astrocytes compared to untreated WT. g. Heatmap of astrocyte identity and function markers. h-k. Heatmaps of synaptogenic proteins (h) and genes (i), as well as synapse eliminating proteins (j) and genes (k). For the heatmaps a darker shade of red indicates a value above the top of the scale. l. Volcano plot of proteins present in ACM at >0.01%, plotted as Log2FC against -log10 p-value comparing BMP6-treated and untreated WT ACM. Each dot represents a protein; top right sector proteins significantly upregulated (FC>1.5, p-value <0.05), examples in red; top left sector proteins significantly downregulated (FC<−1.5, p-value <0.05), examples in turquoise. m. Venn diagram showing overlap between proteins and genes with increased expression in WT astrocytes following BMP6 treatment. For mass spectrometry and RNA Sequencing N=6 cultures, half of each culture treated with BMP6 and other half left untreated. Proteomics, *p<0.05, abundance >0.01%, fold change ≥1.5 calculated with T-fold test in Patternlab. RNASeq, *adjusted p<0.05, FPKM>1, fold change ≥1.5 calculated with DESeq2. See also Extended Data Figure 6; Tables S2,3,5,6,7,8,9.
Figure 7.
Figure 7.. Blocking ND astrocyte BMP signaling reduces neural deficits.
a-c. BMP6-treated WT astrocytes show upregulated protein secretion (a) and gene expression (b) that overlaps with ND astrocytes. c. Heatmap of proteins increased in all ND and BMP6-treated astrocytes vs. WT, ranked by protein abundance in BMP6-treated ACM. N=6 cultures each WT, FXS, RTT, DS, plus 6 cultures WT +/− BMP6. d,e. ACM from WT astrocytes treated with BMP6 inhibits WT neurite outgrowth. d. Example images of WT neurons cultured for 48 hours, conditions as marked (merged images of MAP2 + Tau). e. Quantification of total neurite outgrowth. Data from 3 experiments, number of neurons: alone=467, WT ACM=733, BMP6 WT ACM=610. f. Blocking Igfbp2 overcomes the inhibitory effect of BMP6 WT ACM on neurite outgrowth. Data from 3 experiments, number of neurons: alone=378, WT ACM=380, BMP6 WT ACM=506, BMP6 WT ACM + Igfbp2 blocking Ab=335. g-j. Blocking BMP signaling in ND astrocytes rescues deficits in WT neurite outgrowth. g. Experimental schematic for noggin treatment of FXS or RTT astrocytes. h. Blocking BMP signaling in FXS astrocytes rescues deficits in WT neurite outgrowth. Example images of WT neurons cultured for 48 hours, conditions as marked (merged images of MAP2 + Tau). i. Quantification of total neurite outgrowth. Data from 3 experiments, number of neurons: alone=923, WT ACM=1164, FXS ACM=1132, Noggin FXS ACM=1099. j. Blocking BMP signaling in RTT astrocytes rescues deficits in WT neurite outgrowth. Quantification of total neurite outgrowth. Data from 3 experiments, number of neurons: alone=238, WT ACM=279, RTT ACM=387, Noggin RTT ACM=365. Violin plot: dashed line median, dotted lines 25th and 75th percentile. Statistics by Kruskal-Wallis one-way ANOVA on ranks with Dunn’s test for multiple comparisons. See also Extended Data Figure 7; Tables S5, S7.

Similar articles

Cited by

References

    1. Ebrahimi-Fakhari D.& Sahin M.Autism and the synapse: emerging mechanisms and mechanism-based therapies. Current opinion in neurology 28, 91–102 (2015). - PubMed
    1. Amir RE, Van den Veyver IB, Wan M, Tran CQ, Francke U.& Zoghbi HY Rett syndrome is caused by mutations in X-linked MECP2, encoding methyl-CpG-binding protein 2. Nature genetics 23, 185–188 (1999). - PubMed
    1. Xu X, Miller EC & Pozzo-Miller L.Dendritic spine dysgenesis in Rett syndrome. Frontiers in Neuroanatomy 8 (2014). - PMC - PubMed
    1. Wang ITJ, Reyes A-RS & Zhou Z.Neuronal morphology in MeCP2 mouse models is intrinsically variable and depends on age, cell type, and Mecp2 mutation. Neurobiology of Disease 58, 3–12 (2013). - PMC - PubMed
    1. Irwin SA, Galvez R.& Greenough WT Dendritic Spine Structural Anomalies in Fragile-X Mental Retardation Syndrome. (2000). - PubMed

Methods References

    1. Guy J, Hendrich B, Holmes M, Martin JE & Bird A.A mouse Mecp2-null mutation causes neurological symptoms that mimic Rett syndrome. Nature genetics 27, 322–326 (2001). - PubMed
    1. Bakker CE, Verheij C, Willemsen R, van der Helm R, Oerlemans F, Vermey M, Bygrave A, Hoogeveen A, Oostra BA, Reyniers E, De Boule K, D’Hooge R, Cras P, van Velzen D, Nagels G, Martin J-J, De Deyn PP, Darby JK & Willems PJ Fmr1 knockout mice: A model to study fragile X mental retardation. Cell 78, 23–33 (1994). - PubMed
    1. Gupta M, Dhanasekaran AR & Gardiner KJ Mouse models of Down syndrome: gene content and consequences. Mamm Genome 27, 538–555 (2016). - PMC - PubMed
    1. Davisson MT, Schmidt C.& Akeson EC Segmental trisomy of murine chromosome 16: a new model system for studying Down syndrome. Progress in clinical and biological research 360, 263–280 (1990). - PubMed
    1. Duchon A, Raveau M, Chevalier C, Nalesso V, Sharp AJ & Herault Y.Identification of the translocation breakpoints in the Ts65Dn and Ts1Cje mouse lines: relevance for modeling Down syndrome. Mamm Genome 22, 674–684 (2011). - PMC - PubMed

Publication types