

Chromobox 7/8 serve as independent indicators for glioblastoma via promoting proliferation and invasion of glioma cells
- PMID: 36034290
- PMCID: PMC9403790
- DOI: 10.3389/fneur.2022.912039
Chromobox 7/8 serve as independent indicators for glioblastoma via promoting proliferation and invasion of glioma cells
Abstract
Background: The chromobox family, a critical component of epigenetic regulators, participates in the tumorigenesis and progression of many malignancies. However, the roles of the CBX family members (CBXs) in glioblastoma (GBM) remain unclear.
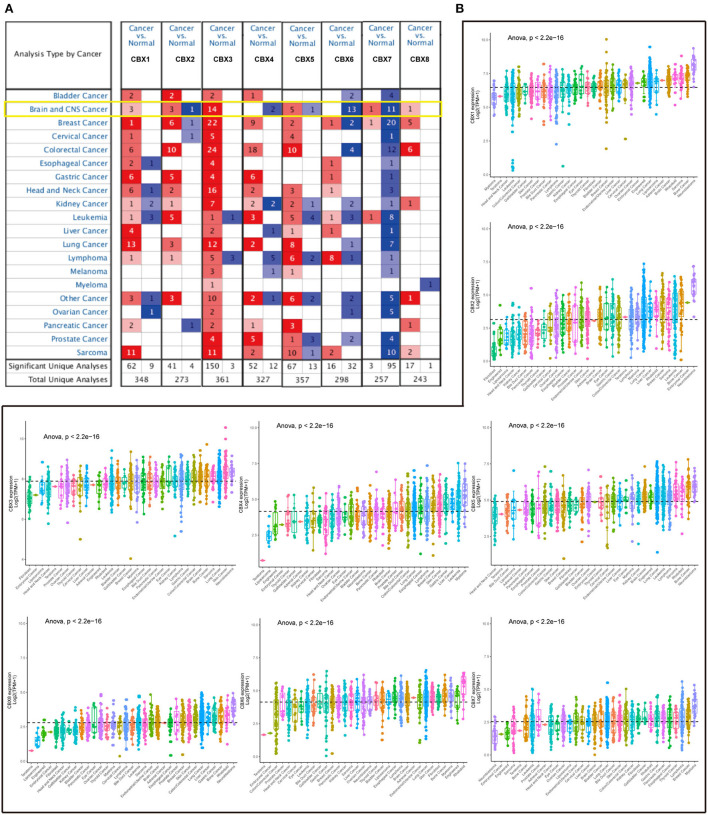
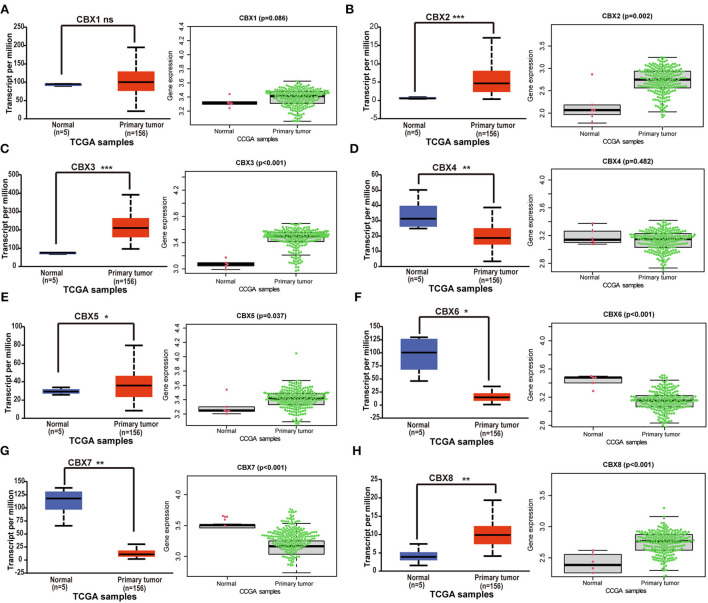
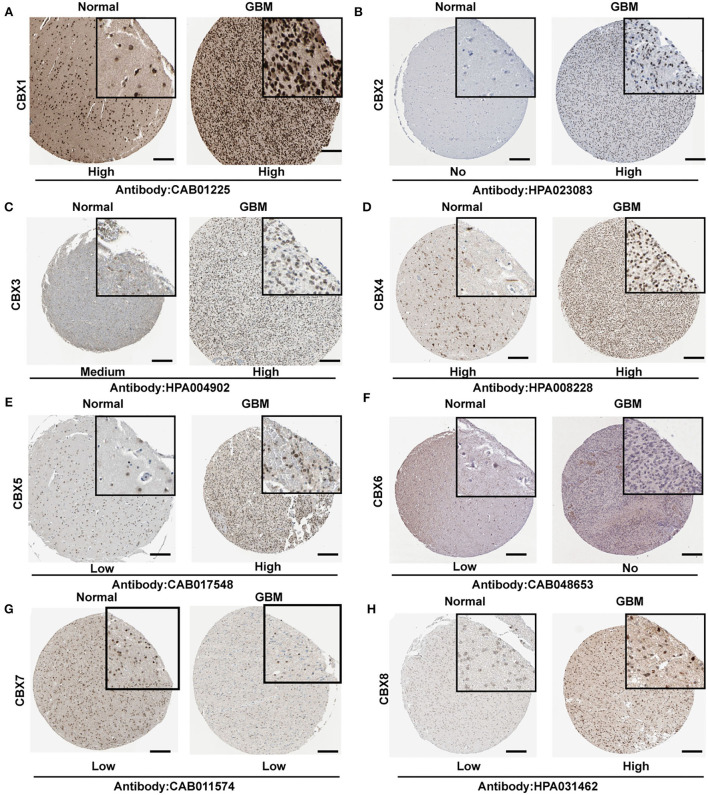
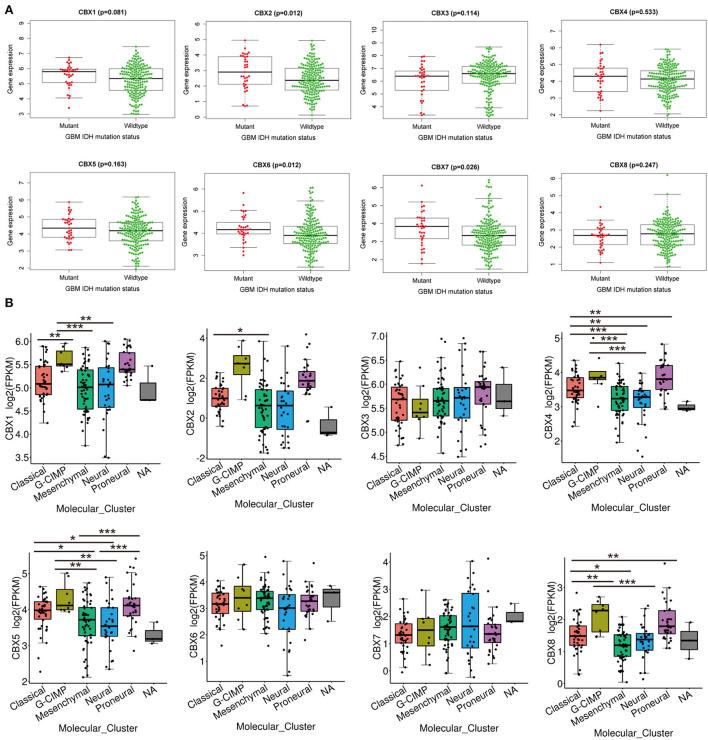
Methods: The mRNA expression of CBXs was analyzed in tissues and cell lines by Oncomine and Cancer Cell Line Encyclopedia (CCLE). The differential expression of CBXs at the mRNA level was explored in The Cancer Genome Atlas (TCGA) and Chinese Glioma Genome Atlas (CGGA) databases with the "beeswarm" R package. The protein expression of CBXs in GBM was further examined on Human Protein Atlas (HPA). The correlations between CBXs and IDH mutation and between CBXs and GBM subtypes were investigated in the TCGA portal and CGGA database with the "survminer" R package. The alteration of CBXs and their prognostic value were further determined via the cBioPortal and CGGA database with the "survival" R package. The univariate and multivariate analyses were performed to screen out the independent prognostic roles of CBXs in the CGGA database. Cytoscape was used to visualize the functions and related pathways of CBXs in GBM. U251 and U87 glioma cells with gene intervention were used to validate the role of CBX7/8 in tumor proliferation and invasion. Proliferation/invasion-related markers were conducted by Western blot and immunostaining.
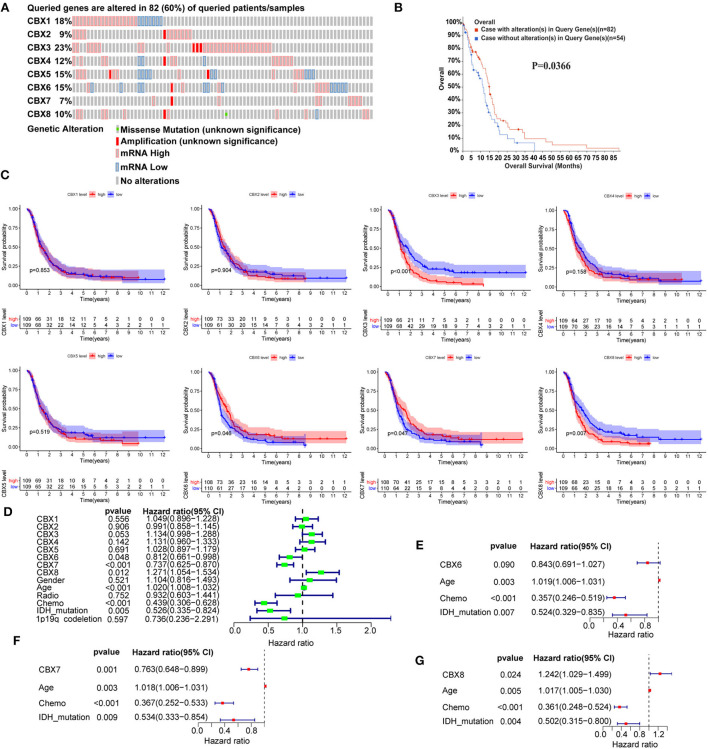
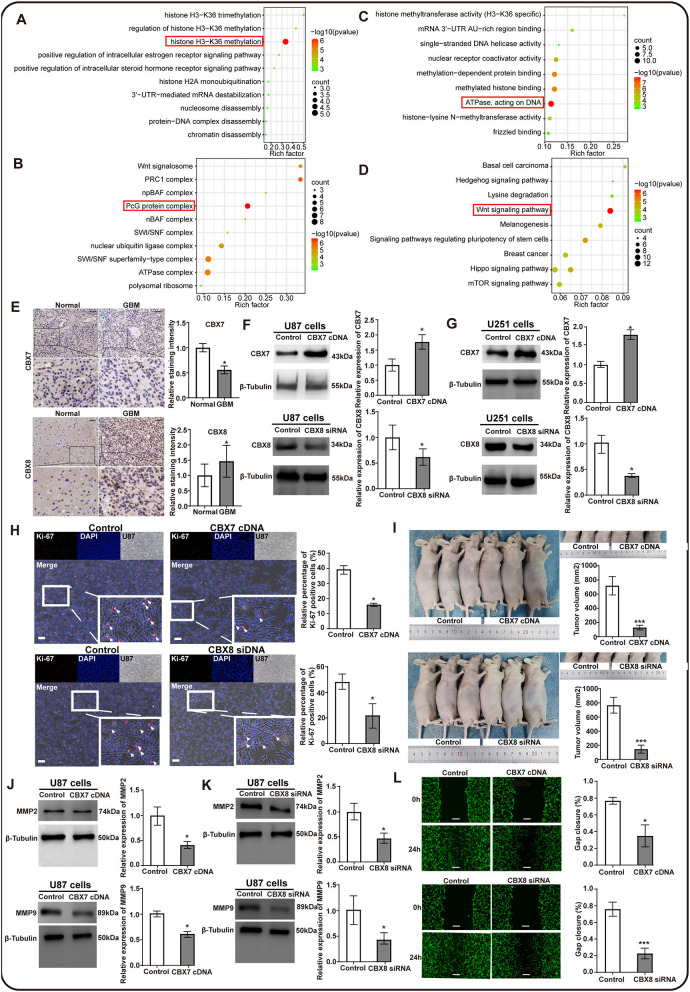
Results: CBXs presented significantly differential expressions in pan-cancers. CBX2/3/5/8 were upregulated, whereas CBX6/7 were downregulated at mRNA level in GBM of TCGA and CGGA databases. Similarly, high expression of CBX2/3/5 and low expression of CBX6/8 were further confirmed at the protein level in the HPA. CBX2/6/7 were positively correlated with IDH mutation and CBX1/2/4/5/8 were closely related to GBM subtypes. CBX7 and CBX8 presented the independent prognostic factors for GBM patient survival. GO and KEGG analyses indicated that CBXs were closely related to the histone H3-K36, PcG protein complex, ATPase, and Wnt pathway. The overexpression of CBX7 and underexpression of CBX8 significantly inhibited the proliferation and invasion of glioma cells in vivo and in vitro.
Conclusion: Our results suggested that CBX7 and CBX8 served as independent prognostic indicators that promoted the proliferation and invasion of glioma cells, providing a promising strategy for diagnosing and treating GBM.
Keywords: chromobox (CBX); glioblastoma (GBM); invasion; multi-omics; prognosis; proliferation.
Copyright © 2022 Zheng, Yuan, Kang, Nie, Zhang and Wang.
Conflict of interest statement
The authors declare that the research was conducted in the absence of any commercial or financial relationships that could be construed as a potential conflict of interest.
Figures
Similar articles
-
Chromobox proteins in cancer: Multifaceted functions and strategies for modulation (Review).Int J Oncol. 2023 Mar;62(3):36. doi: 10.3892/ijo.2023.5484. Epub 2023 Feb 3. Int J Oncol. 2023. PMID: 36734270 Free PMC article. Review.
-
Expression profile and prognostic values of Chromobox family members in human glioblastoma.Aging (Albany NY). 2022 Feb 24;14(4):1910-1931. doi: 10.18632/aging.203912. Epub 2022 Feb 24. Aging (Albany NY). 2022. PMID: 35210369 Free PMC article.
-
CBX Family Members in Two Major Subtypes of Renal Cell Carcinoma: A Comparative Bioinformatic Analysis.Diagnostics (Basel). 2022 Oct 11;12(10):2452. doi: 10.3390/diagnostics12102452. Diagnostics (Basel). 2022. PMID: 36292141 Free PMC article.
-
The predictive significance of chromobox family members in prostate cancer in humans.Cell Oncol (Dordr). 2024 Aug;47(4):1315-1331. doi: 10.1007/s13402-024-00929-7. Epub 2024 Mar 1. Cell Oncol (Dordr). 2024. PMID: 38427207
-
Biological functions of chromobox (CBX) proteins in stem cell self-renewal, lineage-commitment, cancer and development.Bone. 2021 Feb;143:115659. doi: 10.1016/j.bone.2020.115659. Epub 2020 Sep 24. Bone. 2021. PMID: 32979540 Review.
Cited by
-
CBX7 is involved in the progression of cervical cancer through the ITGβ3/TGFβ1/AKT pathway.Oncol Lett. 2023 Nov 13;27(1):14. doi: 10.3892/ol.2023.14147. eCollection 2024 Jan. Oncol Lett. 2023. PMID: 38028179 Free PMC article.
-
mRNA markers for survival prediction in glioblastoma multiforme patients: a systematic review with bioinformatic analyses.BMC Cancer. 2024 May 21;24(1):612. doi: 10.1186/s12885-024-12345-z. BMC Cancer. 2024. PMID: 38773447 Free PMC article.
-
Chromobox proteins in cancer: Multifaceted functions and strategies for modulation (Review).Int J Oncol. 2023 Mar;62(3):36. doi: 10.3892/ijo.2023.5484. Epub 2023 Feb 3. Int J Oncol. 2023. PMID: 36734270 Free PMC article. Review.
-
PSMB2 plays an oncogenic role in glioma and correlates to the immune microenvironment.Sci Rep. 2024 Mar 11;14(1):5861. doi: 10.1038/s41598-024-56493-5. Sci Rep. 2024. PMID: 38467767 Free PMC article.
References
LinkOut - more resources
Full Text Sources
Research Materials