

Differentially CTCF-Binding Sites in Cattle Rumen Tissue during Weaning
- PMID: 36012336
- PMCID: PMC9408924
- DOI: 10.3390/ijms23169070
Differentially CTCF-Binding Sites in Cattle Rumen Tissue during Weaning
Abstract
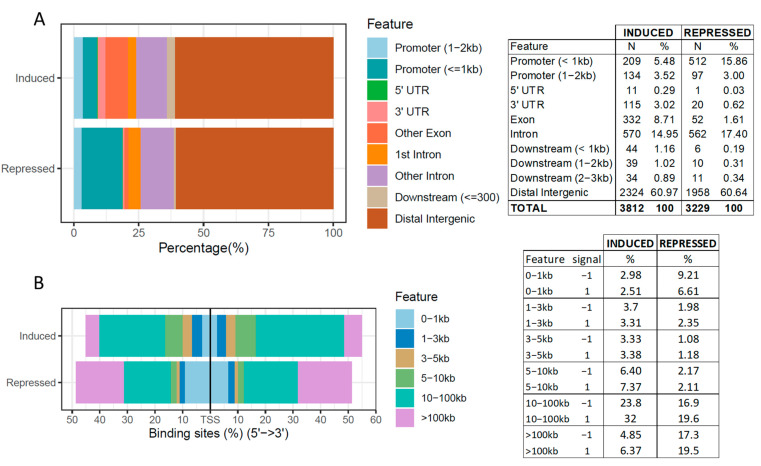
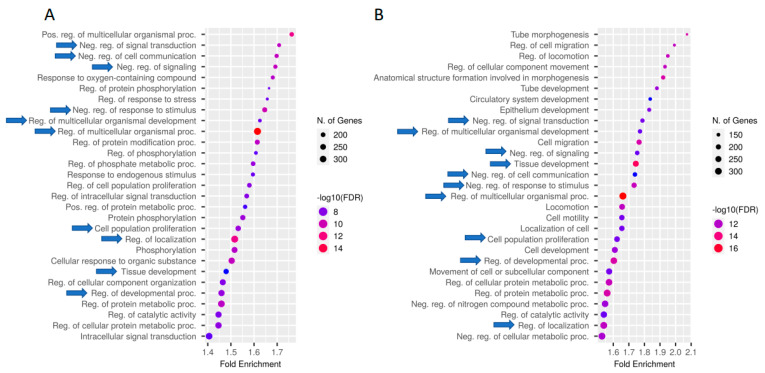
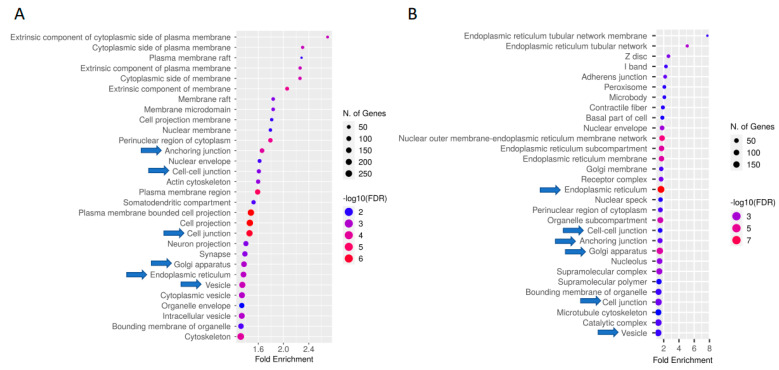
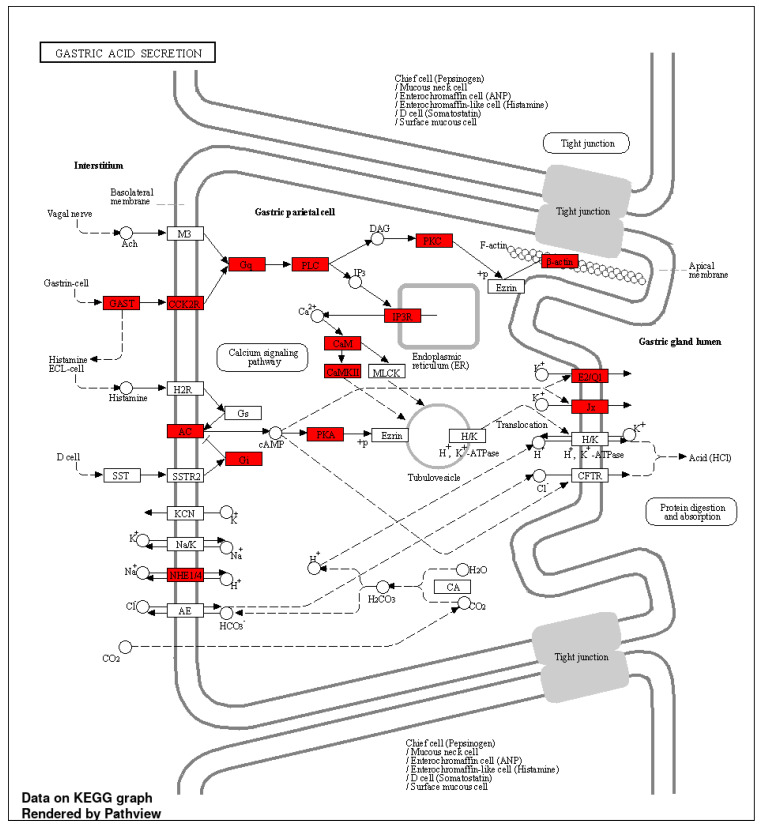
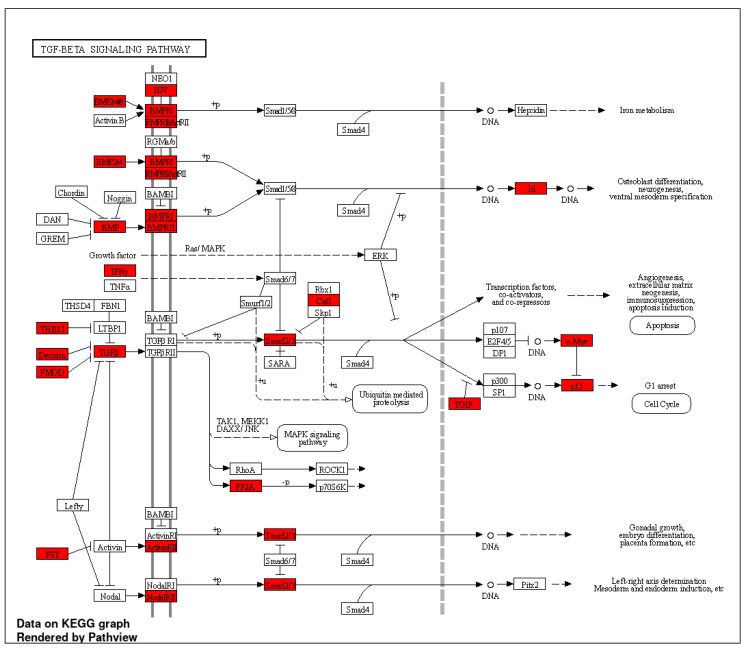
The weaning transition in calves is characterized by major structural changes such as an increase in the rumen capacity and surface area due to diet changes. Studies evaluating rumen development in calves are vital to identify genetic mechanisms affected by weaning. This study aimed to provide a genome-wide characterization of CTCF-binding sites and differentially CTCF-binding sites (DCBS) in rumen tissue during the weaning transition of four Holstein calves to uncover regulatory elements in rumen epithelial tissue using ChIP-seq. Our study generated 67,280 CTCF peaks for the before weaning (BW) and 39,891 for after weaning (AW). Then, 7401 DCBS were identified for the AW vs. BW comparison representing 0.15% of the cattle genome, comprising ~54% of induced DCBS and ~46% of repressed DCBS. Most of the induced and repressed DCBS were in distal intergenic regions, showing a potential role as insulators. Gene ontology enrichment revealed many shared GO terms for the induced and the repressed DCBS, mainly related to cellular migration, proliferation, growth, differentiation, cellular adhesion, digestive tract morphogenesis, and response to TGFβ. In addition, shared KEGG pathways were obtained for adherens junction and focal adhesion. Interestingly, other relevant KEGG pathways were observed for the induced DCBS like gastric acid secretion, salivary secretion, bacterial invasion of epithelial cells, apelin signaling, and mucin-type O-glycan biosynthesis. IPA analysis further revealed pathways with potential roles in rumen development during weaning, including TGFβ, Integrin-linked kinase, and Integrin signaling. When DCBS were further integrated with RNA-seq data, 36 putative target genes were identified for the repressed DCBS, including KRT84, COL9A2, MATN3, TSPAN1, and AJM1. This study successfully identified DCBS in cattle rumen tissue after weaning on a genome-wide scale and revealed several candidate target genes that may have a role in rumen development, such as TGFβ, integrins, keratins, and SMADs. The information generated in this preliminary study provides new insights into bovine genome regulation and chromatin landscape.
Keywords: CTCF; ChIP-seq; cattle; epithelial tissue; regulatory elements; rumen development; weaning.
Conflict of interest statement
The authors declare no conflict of interest.
Figures
Similar articles
-
Butyrate Induces Modifications of the CTCF-Binding Landscape in Cattle Cells.Biomolecules. 2022 Aug 25;12(9):1177. doi: 10.3390/biom12091177. Biomolecules. 2022. PMID: 36139015 Free PMC article.
-
Characterization of Accessible Chromatin Regions in Cattle Rumen Epithelial Tissue during Weaning.Genes (Basel). 2022 Mar 18;13(3):535. doi: 10.3390/genes13030535. Genes (Basel). 2022. PMID: 35328088 Free PMC article.
-
Transcriptional regulators transforming growth factor-β1 and estrogen-related receptor-α identified as putative mediators of calf rumen epithelial tissue development and function during weaning.J Dairy Sci. 2014 Jul;97(7):4193-207. doi: 10.3168/jds.2013-7471. Epub 2014 Apr 24. J Dairy Sci. 2014. PMID: 24767884
-
Development and physiology of the rumen and the lower gut: Targets for improving gut health.J Dairy Sci. 2016 Jun;99(6):4955-4966. doi: 10.3168/jds.2015-10351. Epub 2016 Mar 9. J Dairy Sci. 2016. PMID: 26971143 Review.
-
Invited review: Transitioning from milk to solid feed in dairy heifers.J Dairy Sci. 2016 Feb;99(2):885-902. doi: 10.3168/jds.2015-9975. Epub 2015 Dec 17. J Dairy Sci. 2016. PMID: 26709160 Review.
Cited by
-
Insulin-like Growth Factor-2 (IGF-2) in Fibrosis.Biomolecules. 2022 Oct 25;12(11):1557. doi: 10.3390/biom12111557. Biomolecules. 2022. PMID: 36358907 Free PMC article. Review.
References
-
- Warner R.G., Flatt W.P., Loosli J.K. Ruminant Nutrition, Dietary Factors Influencing Development of Ruminant Stomach. J. Agric. Food Chem. 1956;4:788–792. doi: 10.1021/jf60067a003. - DOI
MeSH terms
Substances
Grants and funding
LinkOut - more resources
Full Text Sources
