. 2022 Aug 9;11(16):2470.
doi: 10.3390/cells11162470.

Screening Biophysical Sensors and Neurite Outgrowth Actuators in Human Induced-Pluripotent-Stem-Cell-Derived Neurons

Affiliations

Screening Biophysical Sensors and Neurite Outgrowth Actuators in Human Induced-Pluripotent-Stem-Cell-Derived Neurons

Vaibhav P Pai et al. Cells. .

Abstract

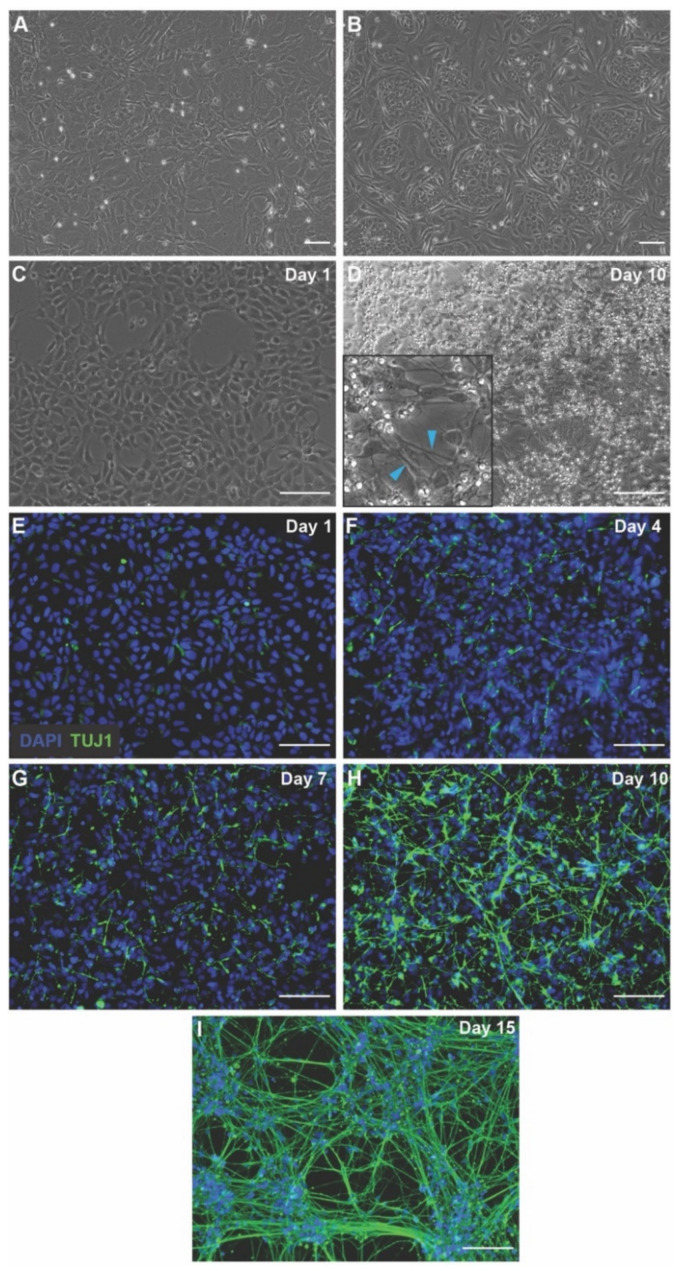
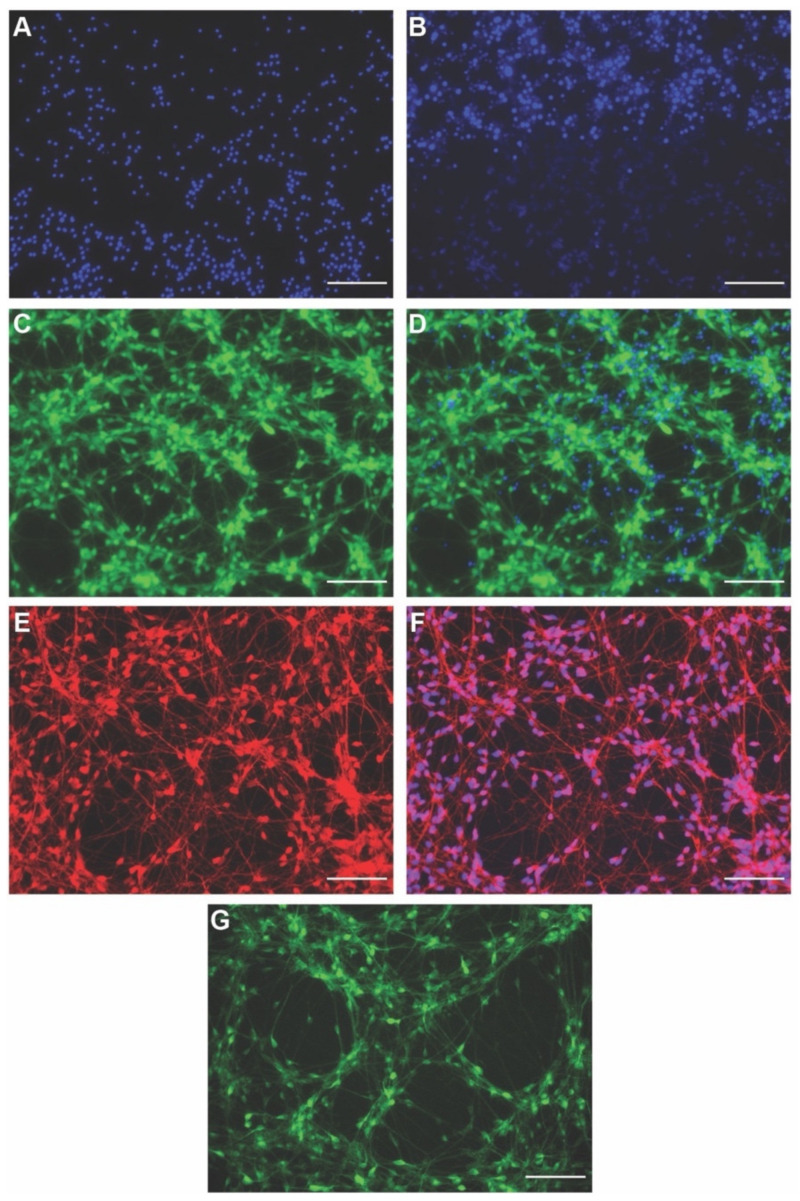
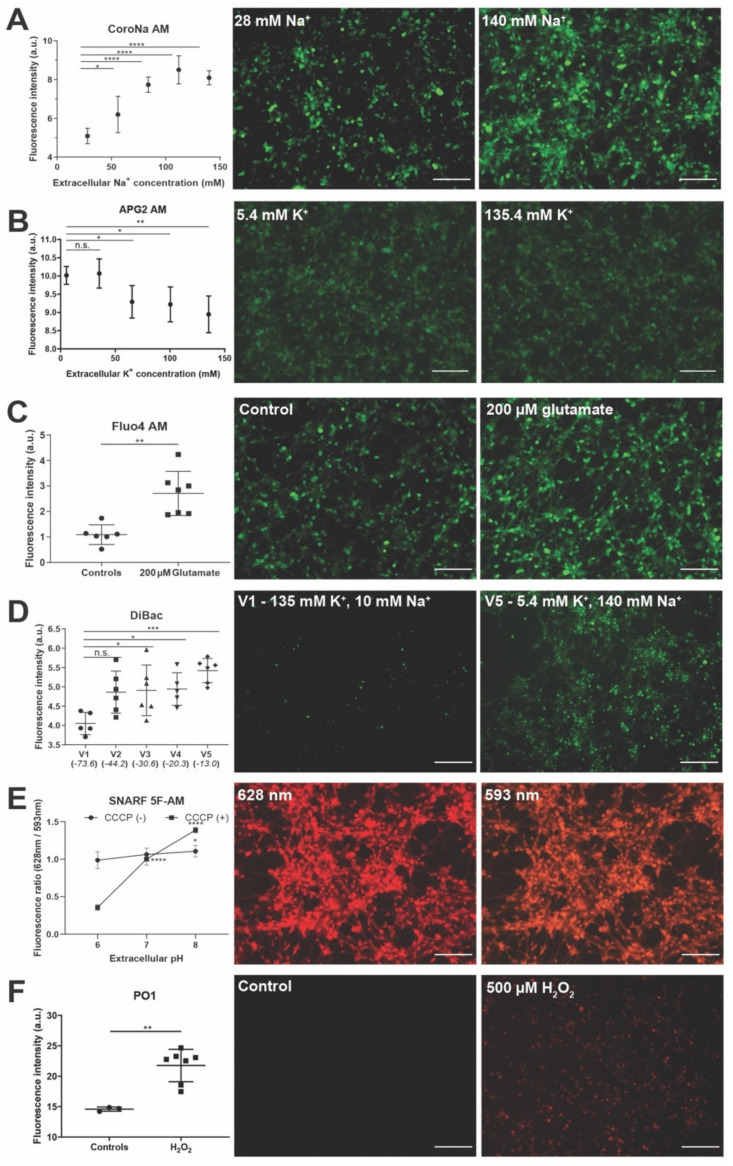
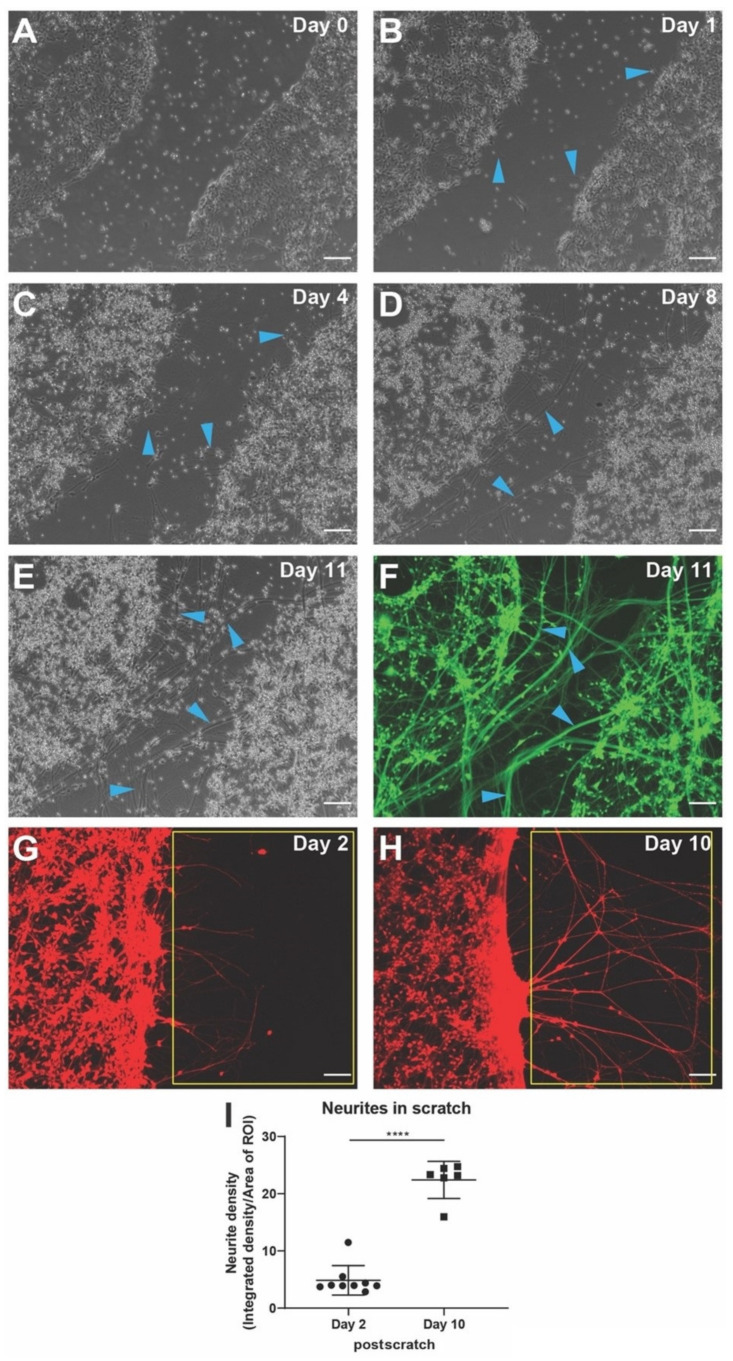
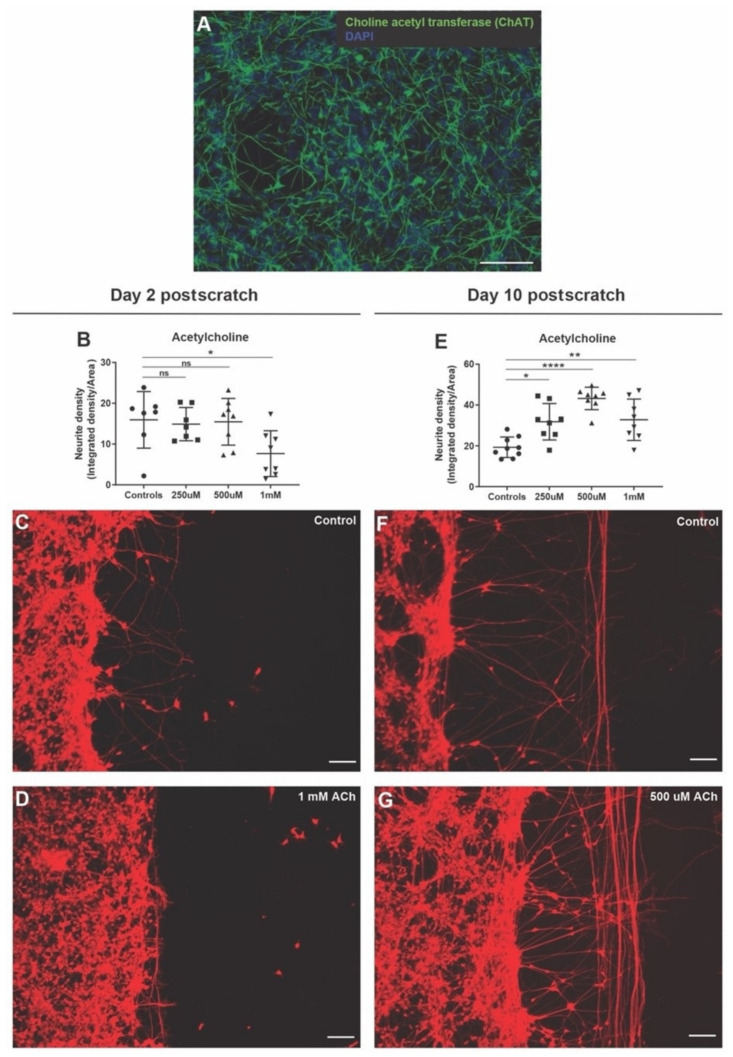
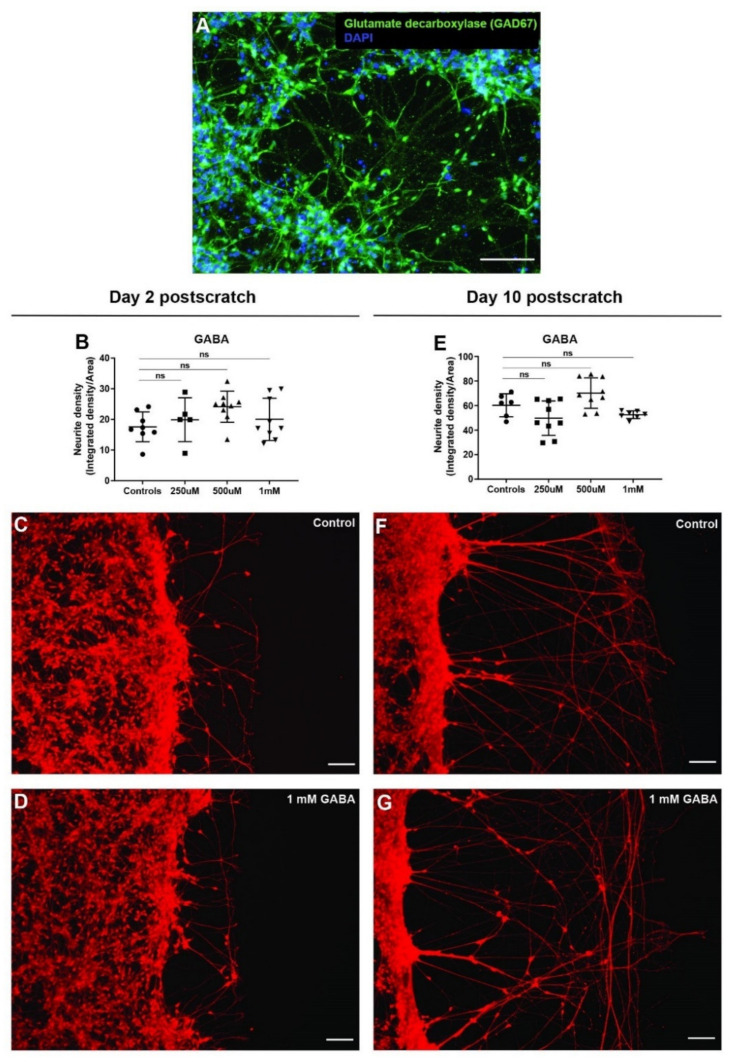
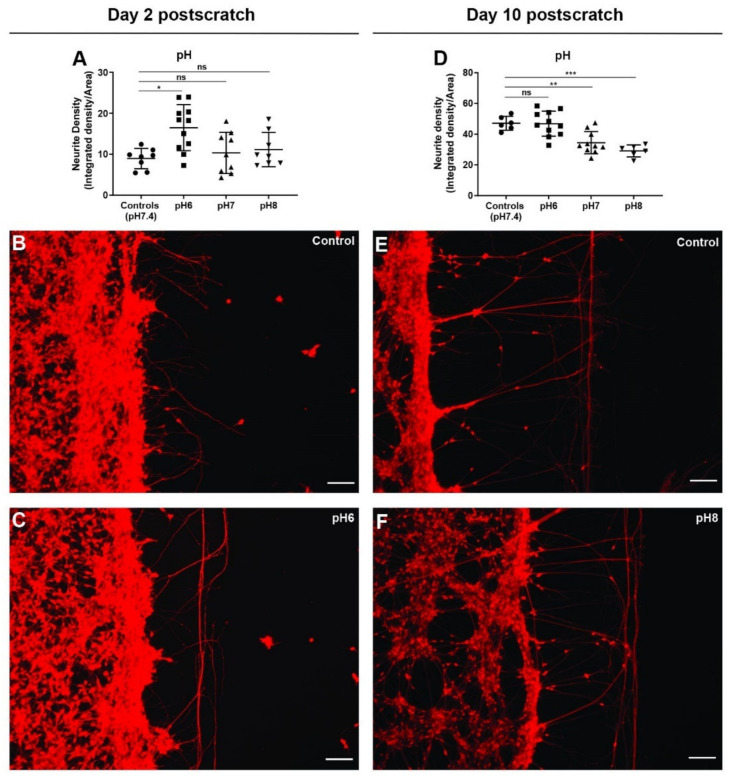
All living cells maintain a charge distribution across their cell membrane (membrane potential) by carefully controlled ion fluxes. These bioelectric signals regulate cell behavior (such as migration, proliferation, differentiation) as well as higher-level tissue and organ patterning. Thus, voltage gradients represent an important parameter for diagnostics as well as a promising target for therapeutic interventions in birth defects, injury, and cancer. However, despite much progress in cell and molecular biology, little is known about bioelectric states in human stem cells. Here, we present simple methods to simultaneously track ion dynamics, membrane voltage, cell morphology, and cell activity (pH and ROS), using fluorescent reporter dyes in living human neurons derived from induced neural stem cells (hiNSC). We developed and tested functional protocols for manipulating ion fluxes, membrane potential, and cell activity, and tracking neural responses to injury and reinnervation in vitro. Finally, using morphology sensor, we tested and quantified the ability of physiological actuators (neurotransmitters and pH) to manipulate nerve repair and reinnervation. These methods are not specific to a particular cell type and should be broadly applicable to the study of bioelectrical controls across a wide range of combinations of models and endpoints.

Keywords: GABA; acetylcholine; bioelectricity; hiNSC; ion flux; live sensor dyes; membrane potential; pH; serotonin.


Conflict of interest statement

The authors declare no competing financial interests.

Figures

Figure 1
Figure 1
hiNSC differentiation into neurons over 10 days. (A) Inactivated MEFs which serve as feeder substrate for growing hiNSC. (B) hiNSC colonies growing on inactivated MEFs. (C) Day 1 after seeding hiNSC on tissue culture surface coated with poly-d-lysine (PDL) + laminin. (D) Day 10 after seeding hiNSC on PDL + laminin with neuronal outgrowths. Inset shows a magnified image with blue arrowheads indicating neuronal projections. (E) Day 1 hiNSC on PDL + laminin stained with DAPI (nucleus) and immunostained with TUJ1 (neuron-specific βIII-tubulin) showing no neurons. (F) Day 4 hiNSC on PDL + laminin stained with DAPI and TUJ1 showing beginning of neuronal differentiation. (G) Day 7 hiNSC on PDL + laminin stained with DAPI and TUJ1 showing increased progression of neuronal differentiation. (H) Day 10 hiNSC on PDL + laminin stained with DAPI and TUJ1 showing large-scale neuronal differentiation into neurons. (I) Day 10 hiNSC on PDL + laminin stained with DAPI and TUJ1 showing extensive neural networks. All scale bars, 100 µm.
Figure 2
Figure 2
Screening live morphology dyes on hiNSC-derived neurons. (AG) hiNSC-derived day 10 neurons. (A) Stained with 0.5 µg/mL DAPI showing only dead cells nuclei. (B) Stained with 0.5 µg/mL Hoechst showing top half (bright blue) dead cells nuclei and bottom half (light blue) live cells nuclei. (C) Stained with 0.5 µM Calcein Green AM showing live neurons cell body and neuronal projections. (D) Stained with 0.5 µM Calcein Green AM and DAPI with green showing live neuron morphology and blue showing dead cells nuclei. (E) Stained with 0.5 µM Calcein Red-Orange AM showing live neurons cell body and neuronal projections. (F) Stained with 0.5 µM Calcein Red-Orange AM and Hoechst with red/magenta showing live neuron morphology and blue showing live neuron nuclei. (G) Stained with 0.3 µM NeuO showing live neurons cell body and neuronal projections. All scale bars, 100 µm.
Figure 3
Figure 3
Screening live biophysical dyes showing dynamics of ions, Vmem, pH, and metabolism in hiNSC-derived neurons. (AF) hiNSC-derived day 10 neurons. (A) CoroNa AM fluorescent intensity plot showing increase in intracellular Na+ ions in response to increasing extracellular Na+ ion concentrations. Representative images of CoroNa AM stained cells incubated in 28 mM and 140 mM extracellular Na+ ion concentration. (B) APG2 AM fluorescent intensity plot showing decrease in intracellular K+ ions in response to increasing extracellular K+ ion concentrations. Representative images of APG2 AM stained cells incubated in 5.4 mM and 135.4 mM extracellular K+ ion concentration. (C) Fluo4 AM fluorescent intensity plot showing increased intracellular Ca2+ ions in response to 200 µM glutamate. Representative images of Fluo4 AM stained cells in control and 200 µM glutamate conditions. (D) DiBAC fluorescent intensity plot showing increase in resting membrane voltage of cells in response to changing extracellular ion concentrations. Representative images of DiBAC stained cells in V1 (135 mM K+, and 10 mM Na+) and V5 (5.4 mM K+, and 140 mM Na+) extracellular solutions. (E) SNARF 5F AM fluorescence ratios (628 nm/593 nm) showing no change in intracellular pH in absence of protonophore CCCP but a significant change in intracellular pH in presence of protonophore CCCP (50 µM) in response to extracellular pH changes. Representative images of SNARF 5F AM at 628 nm and 593 nm for extracellular pH 7. (F) Peroxy Orange 1 (PO1) fluorescent intensity plot showing increase in intracellular reactive oxygen species (ROS) in response to hydrogen peroxide treatment. Representative images of PO1 stained cells in control and 500 µM hydrogen peroxide conditions. All data are represented as mean ± S.D. n.s.—not significant, * p < 0.05, ** p < 0.01, *** p < 0.001, **** p < 0.0001. All scale bars, 100 µm.
Figure 4
Figure 4
Scratch assay for neuronal injury and quantitative determination of neurite outgrowth from injured neurons. (A) hiNSC-derived day 10 neurons with a scratch injury. (B) Day 1 post-scratch, sparse rudimentary outgrowth by some cells into the scratch are seen (blue arrowheads). (C) Day 4 post-scratch shows small, localized network of outgrowths between close neighboring cells within the scratch (blue arrowheads). (D) Day 8 post-scratch, large thick neural networks and neural fibers are seen throughout the scratch (blue arrowheads). (E) Day 11 post-scratch, the entire scratch is covered with neural network and thick neural bundles can be observed traversing across the scratch (blue arrowheads). (F) Calcein Green AM live stain on day 11 post-scratch shows live neurons with extensive neurite outgrowth and nerve fibers throughout the scratch. (GH) Calcein Red-Orange AM live staining of day 2 post-scratch (G) and day 10 post-scratch (H) for quantifying overall neurite outgrowth. Yellow box indicates the region of interest for measuring neurite outgrowth as intensity density. (I) hiNSC-derived neurons show a significant increase in neurite density between day 2 and day 10 post-scratch. All data are represented as mean ± S.D. **** p < 0.0001. All scale bars, 100 µm.
Figure 5
Figure 5
Acetylcholine shows biphasic effect on neurite outgrowth in scratch assay. (A) hiNSC-derived day 10 mature neuronal culture shows presence of cholinergic neurons (choline acetyl transferase marker). (B) Acetylcholine treatment (48 h) shows a significant concentration-dependent decline in scratch neurite density on day 2 post-scratch. (C,D) Representative images of Calcein Red-Orange AM stained control neural cultures (C) and neural cultures treated with 1 mM acetylcholine (D) on day 2 post-scratch showing diminished neurite outgrowths with acetylcholine treatment. (E) Acetylcholine treatment (48 h) shows a significant concentration-dependent increase in scratch neurite density on day 10 post-scratch. (F,G) Representative images of Calcein Red-Orange AM stained control neural cultures (F) and neural cultures treated with 500 µM acetylcholine (G) on day 10 post-scratch showing increased neurite outgrowth with acetylcholine treatment. All data are represented as mean ± S.D. ns—not significant, * p < 0.05, ** p < 0.01, **** p < 0.0001. All scale bars, 100 µm.
Figure 6
Figure 6
Serotonin significantly increases neurite outgrowth in scratch assay. (A) hiNSC-derived day 10 neuronal culture shows presence of serotonergic neurons (serotonin reuptake transporter marker). (B) Serotonin treatment (48 h) shows a significant concentration-dependent increase in scratch neurite density on day 2 post-scratch. (C,D) Representative images of Calcein Red-Orange AM stained control neural cultures (C) and neural cultures treated with 1 mM serotonin (D) on day 2 post-scratch showing increased neurite outgrowths with serotonin treatment. (E) Serotonin treatment (48 h) shows a significant concentration-dependent increase in scratch neurite density on day 10 post-scratch. (F,G) Representative images of Calcein Red-Orange AM stained control neural cultures (F) and neural cultures treated with 1 mM serotonin (G) on day 10 post-scratch showing increased neurite outgrowth with serotonin treatment. All data are represented as mean ± S.D. ns—not significant, ** p < 0.01, *** p < 0.001, **** p < 0.0001. All scale bars, 100 µm.
Figure 7
Figure 7
GABA does not affect neurite outgrowth in scratch assay. (A) hiNSC-derived day 10 neuronal culture shows presence of GABAergic neurons (glutamate decarboxylase—GAD67 marker). (B) GABA treatment (48 h) shows no significant change in scratch neurite density on day 2 post-scratch. (C,D) Representative images of Calcein Red-Orange AM stained control neural cultures (C) and neural cultures treated with 1 mM GABA (D) on day 2 post-scratch showing no discernable change in neurite outgrowths with GABA treatment. (E) GABA treatment (48 h) shows no significant change in scratch neurite density on day 10 post-scratch. (F,G) Representative images of Calcein Red-Orange AM stained control neural cultures (F) and neural cultures treated with 1 mM GABA (G) on day 10 post-scratch showing no discernable change in neurite outgrowth with GABA treatment. All data are represented as mean ± S.D. ns—not significant. All scale bars, 100 µm.
Figure 8
Figure 8
Extracellular pH change has biphasic effect on neurite outgrowth in scratch assay. (A) Extracellular pH change (48 h) shows a significant increase in scratch neurite density at pH 6 but no change at pH 8 on day 2 post-scratch. (B,C) Representative images of Calcein Red-Orange AM stained control neural cultures (B) and neural cultures with extracellular pH 6 (C) on day 2 post-scratch showing increased neurite outgrowths with pH 6. (D) Extracellular pH change (48 h) shows a significant decrease in scratch neurite density at both pH 7 and pH 8 but no change in pH 6 on day 10 post-scratch. (E,F) Representative images of Calcein Red-Orange AM stained control neural cultures (E) and neural cultures treated with extracellular pH 8 (F) on day 10 post-scratch showing decreased neurite outgrowth with pH 8. All data are represented as mean ± S.D. ns—not significant, * p < 0.05, ** p < 0.01, *** p < 0.001. All scale bars, 100 µm.

Similar articles

Cited by

References

    1. Levin M., Pezzulo G., Finkelstein J.M. Endogenous Bioelectric Signaling Networks: Exploiting Voltage Gradients for Control of Growth and Form. Annu. Rev. Biomed. Eng. 2017;19:353–387. doi: 10.1146/annurev-bioeng-071114-040647. - DOI - PMC - PubMed
    1. Nuccitelli R. Endogenous electric fields in embryos during development, regeneration and wound healing. Radiat. Prot. Dosim. 2003;106:375–383. doi: 10.1093/oxfordjournals.rpd.a006375. - DOI - PubMed
    1. McCaig C.D., Song B., Rajnicek A.M. Electrical dimensions in cell science. J. Cell Sci. 2009;122:4267–4276. doi: 10.1242/jcs.023564. - DOI - PubMed
    1. Humphries J., Xiong L., Liu J., Prindle A., Yuan F., Arjes H.A., Tsimring L., Suel G.M. Species-Independent Attraction to Biofilms through Electrical Signaling. Cell. 2017;168:200–209.e12. doi: 10.1016/j.cell.2016.12.014. - DOI - PMC - PubMed
    1. Levin M., Martyniuk C.J. The bioelectric code: An ancient computational medium for dynamic control of growth and form. Biosystems. 2018;164:76–93. doi: 10.1016/j.biosystems.2017.08.009. - DOI - PMC - PubMed

Publication types

Grants and funding

We gratefully acknowledge the support of the Allen Discovery Center program through The Paul G. Allen Frontiers Group (12171), and the Defense Advanced Research Projects Agency (DARPA), Army Research Office, under Cooperative Agreement no. W911NF-18-2-0104, and the Department of Interior, Award no. D20AC00003.

LinkOut - more resources