. 2022 Aug 19;11(8):1611.
doi: 10.3390/antiox11081611.

SIRT3 Modulates Endothelial Mitochondrial Redox State during Insulin Resistance

Affiliations

SIRT3 Modulates Endothelial Mitochondrial Redox State during Insulin Resistance

Elisa Martino et al. Antioxidants (Basel). .

Abstract

Emerging evidence indicates that defects in sirtuin signaling contribute to impaired glucose and lipid metabolism, resulting in insulin resistance (IR) and endothelial dysfunction. Here, we examined the effects of palmitic acid (PA) treatment on mitochondrial sirtuins (SIRT2, SIRT3, SIRT4, and SIRT5) and oxidative homeostasis in human endothelial cells (TeloHAEC). Results showed that treatment for 48 h with PA (0.5 mM) impaired cell viability, induced loss of insulin signaling, imbalanced the oxidative status (p < 0.001), and caused negative modulation of sirtuin protein and mRNA expression, with a predominant effect on SIRT3 (p < 0.001). Restoration of SIRT3 levels by mimic transfection (SIRT3+) suppressed the PA-induced autophagy (mimic NC+PA) (p < 0.01), inflammation, and pyroptosis (p < 0.01) mediated by the NLRP3/caspase-1 axis. Moreover, the unbalanced endothelial redox state induced by PA was counteracted by the antioxidant δ-valerobetaine (δVB), which was able to upregulate protein and mRNA expression of sirtuins, reduce reactive oxygen species (ROS) accumulation, and decrease cell death. Overall, results support the central role of SIRT3 in maintaining the endothelial redox homeostasis under IR and unveil the potential of the antioxidant δVB in enhancing the defense against IR-related injuries.

Keywords: SIRT3; endothelial cells; insulin resistance; mitochondria; δ-valerobetaine.


Conflict of interest statement

The authors declare no conflict of interest.

Figures
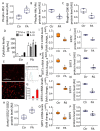
Figure 1
Figure 1
Effects of PA on IR and mitochondrial status. Immunoblotting analysis of (A) phospho-IRS1, (B) phospho-Akt/Akt, and (C) phospho-GSK-3β. (D) Cytokine content and (EG) representative images by fluorescence microscopy and FACS analysis of mitochondrial ROS detection expressed as fluorescence median ± SD (n = 3). Scale bars = 100 µm. (H) Acetylated-SOD2/SOD2 ratio. (I,J) SIRT2, (K,L) SIRT3, (M,N) SIRT4, and (O,P) SIRT5 mRNA and protein levels in EC exposed to 0.5 mM PA for 48 h or treated with the corresponding highest volume of HBSS-10 mM Hepes (Ctr). Western blotting results (n = 5) are expressed as arbitrary units (AU), while mRNA levels (n = 3) are reported as floating bars with a line representing the median ± SD. * p < 0.05 vs. Ctr; † p < 0.01 vs. Ctr; ‡ p < 0.001 vs. Ctr.
Figure 2
Figure 2
SIRT3+ reduced the PA-related cytotoxicity. (A) Immunoblotting analysis of SIRT3 protein levels, (B) LDH assay cytotoxicity, (C) MDA, and (D) extracellular ROS content in EC treated with the empty transfection reagent (Lullaby) or transfected with mimic Negative Control (mimic NC), SIRT3 mimic (SIRT3+), mimic Negative Control and then exposed to 0.5 mM PA for 48 h (mimic NC+PA) or SIRT3 mimic before 48 h treatment with PA (SIRT3++PA). Control cells (Ctr) were treated with the corresponding volume of HBSS-10 mM Hepes. Western blotting results (n = 5) are expressed as arbitrary units (AU) and represented as boxplots. ‡ p < 0.001 vs. mimic NC; § p < 0.05 vs. mimic NC+PA; # p < 0.01 vs. mimic NC+PA.
Figure 3
Figure 3
SIRT3+ decreased the PA-induced IR and oxidative stress. (A) phospho-IRS1, (B) phospho-Akt/Akt, and (C) phospho-GSK-3β protein expression. Representative images by fluorescence microscopy and FACS analysis of (DF) intracellular and (GI) mitochondrial ROS detection, expressed as MFI, and (J) acetylated-SOD2/SOD2 protein levels in EC transfected with mimic Negative Control (mimic NC), SIRT3 mimic (SIRT3+), mimic Negative Control and then exposed to 0.5 mM PA for 48 h (mimic NC+PA) or SIRT3 mimic before 48 h treatment with PA (SIRT3++PA). Scale bars = 100 µm. Western blotting results (n = 5) are expressed as arbitrary units (AU) and represented as boxplots. † p < 0.01 vs. mimic NC; ‡ p < 0.001 vs. mimic NC; § p < 0.05 vs. mimic NC+PA; # p < 0.01 vs. mimic NC+PA.
Figure 4
Figure 4
SIRT3+ counteracted the PA-induced inflammation. (A) Cytokine content and protein level of (B) TNF-α, and (C) IL-6. (D) Representative images of confocal laser scanning microscopy (scale bars = 10 µm). (E) Fluorescence intensity and (F) protein expression levels of NF-κB in EC transfected with mimic Negative Control (mimic NC), SIRT3 mimic (SIRT3+), mimic Negative Control and then exposed to 0.5 mM PA for 48 h (mimic NC+PA) or SIRT3 mimic before 48 h treatment with PA (SIRT3++PA). Fluorescence analysis is reported as boxplots of arbitrary fluorescence units (AFU) of 5 independent experiments. Densitometric immunoblotting study (n = 5) is expressed as arbitrary units (AU). † p < 0.01 vs. mimic NC; ‡ p < 0.001 vs. mimic NC; § p < 0.05 vs. mimic NC+PA; # p < 0.01 vs. mimic NC+PA.
Figure 5
Figure 5
SIRT3+ reduced the PA-mediated pyroptosis. (A) Representative images and (B,C) cytometer analysis, expressed as green fluorescence median, of pyroptosis (scale bars = 100 µm). (D) Cytokine levels and immunoblotting analysis of (E) IL-1β, (F) IL-18, (G) NLRP3, (H) ASC, and (I) caspase-1. (J) Fluorescence intensity and (K) representative images of confocal laser scanning microscopy (scale bars = 10 µm) of caspase-1 in EC transfected with mimic Negative Control (mimic NC), SIRT3 mimic (SIRT3+), mimic Negative Control and then exposed to 0.5 mM PA for 48 h (mimic NC+PA) or SIRT3 mimic before 48 h treatment with PA (SIRT3++PA). Fluorescence analysis (n = 5) is reported as boxplots of arbitrary fluorescence units (AFU), protein expression levels (n = 5) expressed as arbitrary units (AU). † p < 0.01 vs. mimic NC; ‡ p < 0.001 mimic NC; § p < 0.05 vs. mimic NC+PA; # p < 0.01 vs. mimic NC+PA.
Figure 6
Figure 6
SIRT3+ decreased the PA-induced autophagy. Representative images of fluorescence microscopy and flow cytometry analysis of (AC) green detection reagent and (FH) Lysotracker Red, quantified as MFI (scale bars = 100 µm). Western blotting analysis of (D) beclin-1, (E) p62, (I) ATG5, and (J) LC3B II/I in EC transfected with mimic Negative Control (mimic NC), SIRT3 mimic (SIRT3+), mimic Negative Control and then exposed to 0.5 mM PA for 48 h (mimic NC+PA) or SIRT3 mimic before 48 h treatment with PA (SIRT3++PA). Western blotting results (n = 5) are expressed as arbitrary units (AU) and represented as boxplots. † p < 0.01 vs. mimic NC; ‡ p < 0.001 vs. mimic NC; § p < 0.05 vs. mimic NC+PA; # p < 0.01 vs. mimic NC+PA.
Figure 7
Figure 7
δVB reduced the PA-induced mitochondrial dysfunction. (A) Representative images by fluorescence microscopy (scale bars = 100 µm) and (B,C) FACS analysis of mitochondrial ROS detection (MFI). Levels of mRNA and immunoblotting analysis of (D,E) SIRT2, (F,G) SIRT3, (H,I) SIRT4, and (J,K) SIRT5 in EC exposed for 48 h to 0.5 mM δVB, 0.5 mM PA (PA), or pretreated for 16 h with δVB before 48 h PA treatment (δVB+PA). Control cells (Ctr) were treated with the corresponding highest volume of HBSS-10 mM Hepes. Western blotting results (n = 5) are expressed as arbitrary units (AU). mRNA levels are reported as floating bars with line representing the median ± SD (n = 3). * p < 0.05 vs. Ctr; † p < 0.01 vs. Ctr; ‡ p < 0.001 vs. Ctr; § p < 0.05 vs. PA; # p < 0.01 vs. PA.
Figure 8
Figure 8
δVB effects on PA-induced pyroptosis and autophagy. Representative images by fluorescence microscopy and flow cytometry analysis of (AC) pyroptosis and (DF) autophagy, expressed as green median fluorescence ± SD (n = 3), in EC exposed for 48 h to 0.5 mM δVB, 0.5 mM PA (PA), or pretreated for 16 h with δVB before 48 h PA treatment (δVB + PA). Control cells (Ctr) were treated with the corresponding highest volume of HBSS-10 mM Hepes. Scale bars = 100 µm. ‡ p < 0.001 vs. Ctr; § p < 0.05 vs. PA.

Similar articles

Cited by

References

    1. He X., Zeng H., Chen J.X. Emerging role of SIRT3 in endothelial metabolism, angiogenesis, and cardiovascular disease. J. Cell. Physiol. 2019;234:2252–2265. doi: 10.1002/jcp.27200. - DOI - PMC - PubMed
    1. Kane A.E., Sinclair D.A. Sirtuins and NAD+ in the development and treatment of metabolic and cardiovascular diseases. Circ. Res. 2018;123:868–885. doi: 10.1161/CIRCRESAHA.118.312498. - DOI - PMC - PubMed
    1. Colloca A., Balestrieri A., Anastasio C., Balestrieri M.L., D’Onofrio N. Mitochondrial sirtuins in chronic degenerative diseases: New metabolic targets in colorectal cancer. Int. J. Mol. Sci. 2022;23:3212. doi: 10.3390/ijms23063212. - DOI - PMC - PubMed
    1. D’Onofrio N., Vitiello M., Casale R., Servillo L., Giovane A., Balestrieri M.L. Sirtuins in vascular diseases: Emerging roles and therapeutic potential. Biochim. Biophys. Acta. 2015;1852:1311–1322. doi: 10.1016/j.bbadis.2015.03.001. - DOI - PubMed
    1. D’Onofrio N., Servillo L., Balestrieri M.L. SIRT1 and SIRT6 Signaling pathways in cardiovascular disease protection. Antioxid. Redox Signal. 2018;28:711–732. doi: 10.1089/ars.2017.7178. - DOI - PMC - PubMed

LinkOut - more resources