. 2022 Oct;610(7930):143-153.
doi: 10.1038/s41586-022-05246-3. Epub 2022 Aug 25.

Embryo model completes gastrulation to neurulation and organogenesis

Affiliations

Embryo model completes gastrulation to neurulation and organogenesis

Gianluca Amadei et al. Nature. 2022 Oct.

Abstract

Embryonic stem (ES) cells can undergo many aspects of mammalian embryogenesis in vitro1-5, but their developmental potential is substantially extended by interactions with extraembryonic stem cells, including trophoblast stem (TS) cells, extraembryonic endoderm stem (XEN) cells and inducible XEN (iXEN) cells6-11. Here we assembled stem cell-derived embryos in vitro from mouse ES cells, TS cells and iXEN cells and showed that they recapitulate the development of whole natural mouse embryo in utero up to day 8.5 post-fertilization. Our embryo model displays headfolds with defined forebrain and midbrain regions and develops a beating heart-like structure, a trunk comprising a neural tube and somites, a tail bud containing neuromesodermal progenitors, a gut tube, and primordial germ cells. This complete embryo model develops within an extraembryonic yolk sac that initiates blood island development. Notably, we demonstrate that the neurulating embryo model assembled from Pax6-knockout ES cells aggregated with wild-type TS cells and iXEN cells recapitulates the ventral domain expansion of the neural tube that occurs in natural, ubiquitous Pax6-knockout embryos. Thus, these complete embryoids are a powerful in vitro model for dissecting the roles of diverse cell lineages and genes in development. Our results demonstrate the self-organization ability of ES cells and two types of extraembryonic stem cells to reconstitute mammalian development through and beyond gastrulation to neurulation and early organogenesis.


Conflict of interest statement

J.H.H. is a founder and chief scientific advisor to RenewalBio Ltd. M.Z.-G., G.A. and C.E.H. are applicants and inventors on a patent filed jointly on 5 May 2022 by Caltech and the University of Cambridge pertaining to and covering ‘Generation of Synthetic Embryos from Multiple Stem Cell Types’ under CIT file no.: CIT-8826-P and serial number: 63/344,251. The other authors declare no competing interests.

Figures

Fig. 1
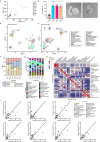
Fig. 1. ETiX embryoids recapitulate developmental milestones of the natural mouse embryo up to E8.5.
a, Schematic of ETiX embryoid formation. ETiX embryoids are formed by aggregating ES cells, TS cells and ES cells transiently expressing GATA4, and by day 4 they generate structures that resemble post-implantation stage natural E5.5 embryos. They subsequently develop to gastrulation (E6.5/ETiX day 5 (ETiX5)) and neurulation (E8.0/ETiX day 7 (ETiX7)) stages before initiating organogenesis (E8.5/ETiX day 8 (ETiX8)). b,c, Bright-field images of natural mouse embryos (b) and ETiX embryoids (c) at different timepoints highlighting morphological similarities (n = 1,197 ETiX4, 237 ETiX5, 170 ETiX6, 100 ETiX7 and 40 ETiX8, from 17 independent experiments). Scale bars, 100 μm. d, Uniform manifold approximation and projection (UMAP) analysis of scRNA-seq data at indicated timepoints for natural embryos at E6.5, E7.5 and E8.5 and ETiX embryoids at days 5, 6 and 8 (n = 29 ETiX5, 10 ETiX6, 7 ETiX8, 12 E6.5, 14 E7.5 and 9 E8.5) analysed by inDrops sequencing. e, Single-cell inDrops RNA-seq UMAP annotated to show cell types identified in natural embryos and ETiX embryoids. AVE, anterior visceral endoderm; CLE, caudal lateral epiblast; NMP, neuromesodermal progenitors; PLPM, posterior lateral plate mesoderm. f, Annotated and combined UMAP of natural embryos cultured ex utero and collected at indicated timepoints (E7.5, E8, E8.5, E8.75 and E9.5) and ETiX embryoids (day 6 and day 8) individually labelled and analysed by tiny-sci-RNA-seq. n = 8 natural embryos ranging from E7.5 to E9.5, n = 3 ETiX6, 2 failed ETiX6, 5 ETiX8 and 4 failed ETiX8. Source data
Fig. 2
Fig. 2. ETiX embryoids develop anterior brain and patterned neural tube.
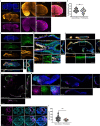
a,b, Ventral view (main image) of day 7 ETiX embryoids after static culture (a) and E8.0 natural embryo (b) showing SOX1-positive neural folds and neural tube extending from the anterior towards the Brachyury-positive posterior. Optical yz (bottom) and xz (right) sections show notochord lying below the neural tube (n = 11 day 7 ETiX embryoids from 4 experiments, n = 3 E8.0 embryos). Scale bars, 100 μm c, Dot plot showing average levels and proportion of cells expressing indicated genes in selected tissues of natural embryos and ETiX embryoids (from inDrops scRNA-seq data). Epi, epiblast. d,e, Lateral view of day 8 ETiX embryoid (d) and E8.5 natural embryo (e) showing FOXG1 in telencephalon and OTX2 in forebrain and midbrain (n = 4 ETiX8 from 3 experiments; n = 2 E8.5 embryos). Scale bars, 100 μm. f, Coronal view of neural tube sections showing dorso–ventral patterning in day 8 ETiX embryoids. Sections reveal pan-neural markers (SOX1 and SOX2), dorsal markers (PAX6 and PAX3), ventral markers (FOXA2, OLIG2 and NKX2-2) and neural crest markers (SOX10 and PAX3). Scale bars, 50 μm. n = 3 ETiX8 from 3 experiments. g, Subclustered UMAP of neural progenitors highlighting neural subtypes from tiny-sci-RNA-seq. h, Individual UMAPs showing the contribution of each timepoint to global UMAP in g. i, The proportion of cell types in g in each individual day 8 ETiX embryoid sequenced by tiny-sci-RNA-seq. MHB, midbrain–hindbrain boundary. Source data
Fig. 3
Fig. 3. Pax6 knockout in ETiX embryoids recapitulates known mouse embryonic phenotypes.
a, Coronal sections of wild-type (WT) and Pax6-knockout (KO) ETiX embryoids stained to reveal dorsal and ventral neural tube markers. Scale bar, 50 μm. b, Quantification of images represented in a, showing no significant difference in SOX1-positive cell number in the neural tube but an increased proportion of NKX2-2-positive cells following Pax6-knockout (3 control day 8 ETiX and 4 day 8 Pax6-KO ETiX from 3 experiments). Violin plots show median and quartiles. Two-sided Mann–Whitney U-test, *P < 0.05. For SOX1-positive cells, P = 0.5382; for NKX2-2 positive cells, P = 0.0135. c, Gene Ontology (GO) analysis of genes enriched in 2 Pax6-knockout ETiX embryoids at day 8 (tiny-sci-RNA-seq) compared with 5 ETiX day 8 controls. NS, not significant (P > 0.05). Source data
Fig. 4
Fig. 4. ETiX embryoids undertake somitogenesis and heart formation.
a,b, Lateral view of day 8 ETiX embryoid (a) and natural E8.5 embryo (b) showing SOX2, Brachyury (BRY) and DNA (DAPI), highlighting NMPs in the tail bud region (n = 5 ETiX8 from 4 experiments, n = 3 embryos). Scale bars, 100 μm. Inset, schematic view. c,d, Dorsal view of day 7 ETiX embryoid after stationary culture (c) and natural E8.0 embryo (d) showing SOX2, HOXB4 and DNA, highlighting somite formation flanking neural tube. Right, magnified view of outlined region containing somites (n = 9 day 7 ETiX embryoids from 4 experiments, n = 5 E8.0 embryos). Inset, schematic view. Scale bars a-d, 100 μm (main image), 50 μm (magnified view ac), 20 μm (magnified view d). e, Quantification of somite pairs in natural E8.0 embryos and day 7 ETiX embryoids. Violin plots show median and quartiles. Two-sided Mann–Whitney U-test, P = 0.3020. f, Somite area of E8.0 embryos and day 7 ETiX embryoids. Violin plots show median and quartiles. Two-sided Mann–Whitney U-test. P = 0.2717. For e,f, n = 9 day 7 ETiX embryoids from 4 experiments, n = 5 E8.0 embryos. g,h, Day 8 ETiX embryoid (lateral view) (g) and natural E8.75 embryo (h) (lateral view) showing OTX2, MYH2 and GATA4, highlighting heart (n = 8 ETiX8 from 3 experiments, n = 2 natural embryos). Outlined areas are magnified on the right. Scale bars, 100 μm (main image), 20 μm (magnified view). i, Schematic of mouse heart at E8.5, indicating location of sections. j, Coronal sections of ETiX embryoid at day 8 showing GATA4, NKX2-5 and MYH2. Scale bar, 100 μm. n = 3 ETiX8 from 3 independent experiments. k, Dot plot showing levels and proportion of cells expressing indicated genes in indicated tissues from natural embryos (NE) and ETiX embryoids by inDrops scRNA-seq. l, Velocity plots for epiblast and mesodermal derivatives for time series in the inDrops sequencing dataset. m, UMAP of the tiny-sci-RNA-seq dataset, showing cell types in the subclustered cardiac lineage. Source data
Fig. 5
Fig. 5. ETiX embryoids develop a gut pocket and primordial germ cells.
a,b, Sagittal sections of natural embryos at E8.5 (a) and day 8 ETiX embryoids (b) showing SOX2, SOX17 and GATA4. Scale bars, 100 μm. n = 3 ETiX8 from 3 experiments, n = 2 natural embryos. fg, foregut; hg, hindgut. c, Dot plot showing levels and proportion of cells expressing indicated genes in selected tissues of natural embryos and ETiX embryoids by inDrops scRNA-seq. d, UMAP of tiny-sci-RNA-seq dataset showing VE, gut and early development cell types. e, Day 6 ETiX embryoid (top) and natural E7.5 embryo (bottom) showing STELLA, NANOG and SOX2, highlighting the presence of committed PGCs (n = 9 ETiX6 from 2 experiments, n = 4 embryos). Outlined regions are magnified on the right. f, Quantification of PGCs during ETiX embryoid development (n = 9 ETiX6, 4 E7.5, 2 ETiX7, 4 E8.0, 4 ETiX8 and 3 E8.5). PGCs were scored for STELLA, NANOG and SOX2 expression. Violin plots show median and quartiles. Two-sided Mann–Whitney U-test, P = 0.3375 for ETiX6/E7.5 total STELLA-positive cells, P = 0.3042 for ETiX6/E7.5 triple-positive cells, P = 0.2277 for ETiX8/E8.5 total STELLA-positive cells, and P = 0.2536 for ETiX8/E8.5 triple-positive cells. Source data
Fig. 6
Fig. 6. Characterization of extraembryonic lineages in ETiX embryoids.
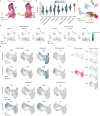
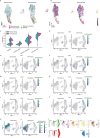
a, Global UMAP of the tiny-sci dataset as shown in Fig. 1f; selected cell clusters are highlighted. b, Gene expression of the amnion marker periostin (Postn) in natural embryos and ETiX embryoids from the tiny-sci-RNA-seq dataset. c, Gene expression of the allantois markers Tbx4 and Hoxa13 in natural embryos and ETiX embryoids from the tiny-sci-RNA-seq dataset. d, Subclustered and annotated UMAP of extraembryonic endoderm from the tiny-sci-RNA-seq dataset. e, Schematic of dissection of chorioallantoic attachment of ETiX embryoids. f, Left, sagittal section of chorioallantoic attachment and yolk sac of day 8 ETiX embryoid showing RUNX1 and DNA. Arrows highlight blood islands. Outlined regions are magnified in the middle and right panels. n = 3 ETiX8 from 3 experiments. Scale bars: 100 μm (left), 20 μm (middle and right). g, Subclustered and annotated UMAP of ExE and trophoblast cells from the tiny-sci-RNA-seq dataset. h, The contribution of individual timepoints to the subclustered UMAP of the ExE and trophoblast cells. i,j, Expression of selected prolactin genes in the subclustered UMAP of ExE and trophoblast cells for natural embryos (i) and ETiX embryoids (j). Source data
Extended Data Fig. 1
Extended Data Fig. 1. ETiX embryoids develop to comparable sizes and show gene expression patterns similar to natural embryos with reproducible efficiency.
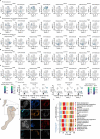
a. Quantification of ETiX embryoid and natural embryo dimensions at comparable developmental timepoints (n=42 for ETiX4, 24 for ETiX5, 14 for ETiX6, 18 for ETiX7, 12 for ETiX8, 32 for E5.5, 18 for E6.5, 3 for E7.5, 8 for E8.0, 5 for E8.5, from 30 independent experiments). b. Quantification of ETiX embryoid formation efficiency from day 5 to day 8 (n = 1197 ETiX4, 237 for ETiX5, 170 for ETiX6, 100 for ETiX7, 40 for ETiX8, from 17 independent experiments). Error bars represent the S.E.M. c. Brightfield images of ETiX embryoids recovered after static culture at day 7 prior to dissection to highlight presence of yolk sac. Scale bar, 100 μm (n = 100 for ETiX7, from 17 independent experiments) d,e. Separated UMAPs of natural embryos (d) and ETiX embryoids (e) analysed by inDrops scRNA-seq. f. Stacked column graph binning all sequenced cells in natural embryos and ETiX embryoids according to germ layer and embryonic and extraembryonic origin at indicated timepoints (inDrops scRNA-seq). g. Stacked column graph highlighting the proportions of tissue types that emerge during natural embryo and ETiX embryoid development (inDrops scRNA-seq). h. Pearson correlation matrices showing global level of similarity across all identified tissues in natural embryos (rows) in comparison to ETiX embryoids (columns) (inDrops scRNA-seq). i. Pairwise visualizations of cell-type proportions between natural embryos and ETiX embryoids (inDrops scRNA-seq) Source data
Extended Data Fig. 2
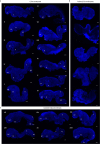
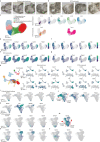
Extended Data Fig. 2. Examples of well-formed ETiX embryoids, failed ETiX embryoids and cultured natural embryos.
a. Typical day 8 ETiX embryoids judged as developing successfully. b. Typical failed ETiX embryoids at day 8. c. Natural embryos cultured ex utero from E6.5 to E8.5. All structures are stained with DAPI. Morphological features: Hf, Headfolds; H, Heart; T, Tail: All, Allantois. (Some of these samples are also shown in the following panels: v in Fig. 4g; vi in 2d; viii in Ext. Data Fig. 7g; xi in Ext. Data Fig. 4a; xii in Ext. Data Fig. 5c; xiii in Fig. 4b; xvi in Fig. 4h; and xvii in Fig. 2e).
Extended Data Fig. 3
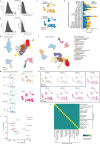
Extended Data Fig. 3. Analysis of ETiX embryoids and natural embryos by tiny sci-RNA-seq.
a,b. Quality control for the first (a) and second replicate (b) of the tiny sci-RNA-seq. Cells with an abnormal percentage of reads mapping to an exon, and too high or too low UMI counts per cell were removed. c. UMAP of the first and second replicate of the tiny sci-RNA-seq. The total number of cells in each dataset is indicated. d. Batch variation for the first and second replicate of tiny sci-RNA-seq. e,f. Separated UMAPs of natural embryos (e) and ETiX embryoids (f) analysed with tiny sci-RNA-seq. g. Contribution of each timepoint to the global UMAP of the tiny sci-RNA-seq. h. Individual UMAPs of standard ETiX embryoids analysed at day 6 and day 8 with tiny sci-RNA-seq. i. PCA analysis of all the natural embryo and standard ETiX- mbryoid samples analysed with tiny sci-RNA-seq. j. Correlation matrix following a nonnegative least-squares (NNLS) regression analysis showing global level of similarity across all identified tissues in natural embryos (columns) in comparison to ETiX embryoids (rows) in the samples analysed by tiny sci-RNA-seq Source data
Extended Data Fig. 4
Extended Data Fig. 4. Tiny sci-RNA-seq dataset integrates seamlessly with published single cell sequencing datasets and highlights differences between well-formed and failed ETiX embryoids.
a,b,c. Integration of the tiny sci-RNA-seq dataset generated in this study with two published single cell sequencing mouse datasets,. d. Cell type proportions for each individual well-formed (standard) ETiX embryoid and each “failed” ETiX embryoid (classified through aberrant morphology) sequenced at D6 and D8 with tiny sci-RNA-seq (n = 3 for standard ETiX6, 2 for failed ETiX6, 5 for standard ETiX8, 4 for failed ETiX8 from 2 independent experiments). e. Averaged cell type proportions for well-formed (standard) and “failed” ETiX embryoids sequenced at D8 with tiny sci-RNA-seq. Cell type proportions from each individual sample are also plotted. In each boxplot the center line shows the medians; the box limits indicate the 25th and 75th percentiles; the whiskers extend to the 5th and 95th percentiles; the replicates are represented by the dots. (n = 5 for standard ETiX8, 4 for failed ETiX8 from 2 independent experiments) Source data
Extended Data Fig. 5
Extended Data Fig. 5. ETiX embryoids show neural folds and a developing tail bud with comparable differentiation trajectory and timing.
a. Day 7 ETiX embryoid recovered after stationary culture stained to reveal SOX2, SOX1 and DNA highlighting formation of the rostral neural folds (n = 11 ETiX7 from 4 independent experiments, n = 3 E8.0 natural embryos). b. Dorsal views of day 7 ETiX embryoid recovered after stationary culture (left) and natural E8.0 embryo (right) showing formation of SOX1 positive neural folds and BRY-positive notochord and tail bud (n = 11 ETiX7 from 4 independent experiments, n = 3 embryos). Scale bar, 100 μm. c. Lateral view of day 8 ETiX embryoid (top) and E8.5 natural embryo (bottom) showing FOXG1 expression in the telencephalon and OTX2 restricted to the forebrain and midbrain (n = 4 ETiX8 from 3 independent experiments, n = 2 embryos). Scale bar for a to c,100 μm. d. Quantification of brain area in E8.5 natural embryos and day 8 ETiX-embryoids. OTX2 was used to delineate the measured area. Data presented as violin plots with median and quartiles, each dot represents a sample (n = 6 E8.5 embryos and n = 17 ETiX8 from 7 independent experiments). Data are presented as violin plots with median and quartiles. Two-sided unpaired t-test, ns = p > 0.05 (p = 0.5223). e. Velocity plots for epiblast, neuroectoderm, surface ectoderm for all time points analysed in the inDrops sequencing dataset. f. Latent time analysis for epiblast, neuroectoderm, surface ectoderm for all time points analysed in the inDrops sequencing dataset. g. Quantification of the latent time analysis for epiblast, neuroectoderm, surface ectoderm for all time points analysed in the inDrops sequencing dataset Source data
Extended Data Fig. 6
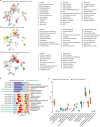
Extended Data Fig. 6. Expression of selected markers for the annotation of neural tissue and localised expression of transcripts revealed by sequential single molecule FISH in natural embryos and ETiX embryoids.
Expression of selected gene markers in annotated clusters shown in Fig. 2g. Gene markers of cell populations representing the prosencephalon (a), mesencephalon and midbrain-hindbrain boundary (b), hindbrain and spinal cord (c) floor plate/roof plate (d), early neurons (e) and neural crest (f) are indicated (tiny sci-RNA-seq). g. Schematic representation of sample sectioning for smFISH and expected expression pattern of selected genes. h,i. smFISH panel of n = 1 natural embryo cultured ex utero from E6.5 to E8.5 (b) and n = 1 day 8 ETiX-embryoid (c) Scale bar = 200 μm. j. The proportion of cell types annotated in Fig. 1f and present in each individual day 8 ETiX embryoid and Pax6 knockout ETiX embryoid sequenced by tiny sci-RNA-seq are shown Source data
Extended Data Fig. 7
Extended Data Fig. 7. Development of ETiX embryoids mesoderm into somites and cardiac tissue.
a. Lateral view of day 8 ETiX embryoid shown in Fig. 3a, highlighting the individual channels. Square regions are shown magnified on the right. Scale bars, 100 μm. b. Percentages of cells co-expressing BRY and SOX2 in natural embryos and ETiX embryoids. (n = 3 E8.5 embryos and n = 4 ETiX8). Data are presented as violin plots with median and quartiles, each dot represents a sample. Two-sided Mann–Whitney U-test, ns = p > 0.05 (p = 0.5182). c. Dorsal view of day 7 ETiX embryoid shown in Fig. 3c, highlighting the individual channels. YZ and XZ views are also shown (n = 9 ETiX7 from 4 experiments, n = 5 E8.0 embryos). d. Dorsal and e. lateral view of day 7 ETiX embryoid recovered after stationary culture stained to reveal SOX2, HOXB4 and DNA to highlight somite formation flanking the neural tube (n = 9 ETiX7 from 4 independent experiments).YZ and XZ views are also shown. f. Orthogonal views of day 8 ETiX-embryoid shown in Fig. 4g. g. Lateral view of day 8 ETiX embryoid stained to reveal OTX2, MYH2 and DNA to highlight heart formation (n = 8 ETiX8 from 3 independent experiments). YZ and XZ views are also shown. Scale bar for a-d, 100 μm. Scale bar for magnified region, 50 μm. h. Day 8 ETiX embryoid (top) and E8.5 natural embryo (below) sectioned coronally and stained to reveal GATA6 and MYH2 to highlight heart morphogenesis. Scale bar, 200 μm. i. Quantifications of the area of the heart in natural embryos and ETiX mbryoids. The MYH2-positive region was utilised to measure the area of the heart or heart-like structure (n = 3 E8.5 embryos, n = 3 ETiX8). Data are presented as violin plots with median and quartiles. Each dot represents a section of the heart and heart-like region. Two-sided unpaired t-test ** = p ≤ 0.01 (exact p value = 0.01) Source data
Extended Data Fig. 8
Extended Data Fig. 8. Developmental trajectories, timing of mesoderm differentiation and expression of selected genes.
a. Latent time for epiblast and mesodermal derivatives for time series in inDrops sequencing dataset. b. Quantification of the latent time analysis for epiblast and all the mesodermal derivatives for all time points analysed in the inDrops sequencing dataset. c. Annotated UMAP of the tiny sci-RNA-seq dataset highlighting the paraxial mesoderm cluster. d. Expression of somite markers Meox1, Meox2 and Pax3 in natural embryos and ETiX embryoids (tiny sci-RNA-seq dataset). e. Expression of cardiac markers Hand1, Hand2, atrial differentiation marker Nr2f2, ventricular differentiation marker Irx4, first heart field markers Tbx5, Hcn4, Nkx2.5 and second heart field marker Isl1 in natural embryos and ETiX embryoids (tiny sci-RNA-seq dataset). f. UMAP showing individual timepoints for natural embryos and ETiX embryoids in combined UMAP presented in Fig. 4m Source data
Extended Data Fig. 9
Extended Data Fig. 9. Further characterisation of the gut tube of ETiX embryoids reveals similarities and differences in comparison to natural embryos.
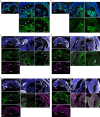
a,b. Sagittal sections of natural embryos at E8.5 (a) and day 8 ETiX embryoids (b) stained to reveal GATA6. (n = 3 ETiX8 from 3 independent experiments, n = 2 embryos). c,d. Sagittal sections of natural embryos at E8.5 (c) and day 8 ETiX embryoids (d) stained to reveal CDX2, NKX2.5 and FOXG1. (n = 3 ETiX8 from 3 independent experiments, n = 2 embryos). e,f, Sagittal sections of natural embryos at E8.5 (e) and day 8 ETiX embryoids (f) stained to reveal SOX2, OTX2 and FOXA2. Scale bar for a-f, 100 μm. (n = 3 ETiX8 from 3 experiments, n = 2 embryos).
Extended Data Fig. 10
Extended Data Fig. 10. Developmental trajectories and timing of the endoderm and extraembryonic contribution to gut formation.
a. Velocity plots of epiblast, definitive endoderm, gut precursors and primitive streak for all time points analysed in the inDrops sequencing dataset. b. Latent time analysis of epiblast, definitive endoderm, gut precursors and primitive streak for all time points analysed in the inDrops sequencing dataset. c. Quantification of latent time analysis of epiblast, definitive endoderm, gut precursors and primitive streak for all time points analysed in the inDrops sequencing dataset. d–k. Expression of selected marker genes of the embryonic (d-j) and extraembryonic (k) endoderm contribution to the gut (tiny sci-RNA-seq dataset). l. UMAP showing time series of individual natural embryos and ETiX embryoids to combined UMAP in Fig. 5d Source data
Extended Data Fig. 11
Extended Data Fig. 11. Additional examples of primordial germ cell formation in ETiX embryoids.
a–c ETiX embryoid (a) at day 7 of development after stationary culture and natural embryo (b) at E8.0 of development stained to reveal STELLA, NANOG and SOX2 to highlight presence of committed PGCs (n = 2 ETiX7 from 2 independent experiments, n = 4 embryos). Boxes are magnified below (a,b) and on the right (c). Scale bars, 100 μm for main panel, 50 μm for magnified boxes. d. Day 8 ETiX-embryoid stained to reveal STELLA, NANOG and SOX2 highlighting presence of committed PGCs. Scale bar for a-d, 100 μm. (n = 4 ETiX8 from 3 experiments).
Extended Data Fig. 12
Extended Data Fig. 12. Characterisation of yolk sac, endothelium and extraembryonic ectoderm in ETiX embryoids.
a,b. Partially dissected natural embryos (a) cultured from E6.5 to E8.5 and day 8 ETiX embryoids (b) highlighting their development within extraembryonic membranes. Legend: HF: headfolds, H: heart, T: tailbud and All: allantois. Scale bars, 100 μm c. Subclustered UMAP of extraembryonic endoderm in the tiny sci-RNA-seq dataset and contribution of each individual timepoint to the subclustered UMAP of the extraembryonic endoderm. d,e. Expression of selected parietal endoderm genes in the subclustered UMAP of extraembryonic endoderm shown separately for natural embryos (d) and ETiX embryoids (e). f,g. Expression of selected extraembryonic visceral endoderm genes in the subclustered UMAP of extraembryonic endoderm shown separately for natural embryos (f) and ETiX embryoids (g). h. Expression of selected markers of endothelium Pecam1, Cd34, Icam1, Tek, Vegfa and Cdh5 in natural embryos and ETiX embryoids in tiny sci-RNA-seq dataset. i. Eomes, Cdx2, Sox2, Sox21 and Bmp4 identified a trophoblast progenitor population in natural embryos in the tiny sci-RNA-seq dataset. j. Expression of selected markers of the ectoplacental cone lineage. High levels of Hand1 (left side arrow) show the developmental progression of the ECP lineage towards spongiotrophoblast cells and trophoblast giant cells. Co-expression of Ascl2 and Chsy1 indicates committed ECP cells, Tpbpa identifies mature spongiotrophoblasts and expression of Hand1 and prolactin genes (Fig. 5i) denotes the trophoblast giant cells. k. Expression of selected markers of chorion progenitors (right side of arrow in Hand1 UMAP), chorion and differentiated chorion derivatives in natural embryos. Wnt7b indicates chorion progenitors, Tfrc indicates the chorion cluster, Epha4 identifies cells of the syncytiotrophoblast layer I and Gcm1 identifies the syncytiotrophoblast layer II. l–o Expression of marker genes presented in (i-k) in the ETiX embryoids UMAP Source data

Comment in

Similar articles

Cited by

References

    1. ten Berge D, et al. Wnt signaling mediates self-organization and axis formation in embryoid bodies. Cell Stem Cell. 2008;3:508–518. doi: 10.1016/j.stem.2008.09.013. - DOI - PMC - PubMed
    1. van den Brink SC, et al. Symmetry breaking, germ layer specification and axial organisation in aggregates of mouse embryonic stem cells. Development. 2014;141:4231–4242. doi: 10.1242/dev.113001. - DOI - PMC - PubMed
    1. Xu P-F, et al. Construction of a mammalian embryo model from stem cells organized by a morphogen signalling centre. Nat. Commun. 2021;12:3277. doi: 10.1038/s41467-021-23653-4. - DOI - PMC - PubMed
    1. Beccari L, et al. Multi-axial self-organization properties of mouse embryonic stem cells into gastruloids. Nature. 2018;562:272–276. doi: 10.1038/s41586-018-0578-0. - DOI - PubMed
    1. Veenvliet J, et al. Mouse embryonic stem cells self-organize into trunk-like structures with neural tube and somites. Science. 2020;370:eaba4937. doi: 10.1126/science.aba4937. - DOI - PubMed

Publication types

Substances