. 2022 Jun;15(6):1321-1337.
doi: 10.1038/s41385-022-00554-3. Epub 2022 Aug 24.

IκBζ controls IL-17-triggered gene expression program in intestinal epithelial cells that restricts colonization of SFB and prevents Th17-associated pathologies

Affiliations

IκBζ controls IL-17-triggered gene expression program in intestinal epithelial cells that restricts colonization of SFB and prevents Th17-associated pathologies

Soh Yamazaki et al. Mucosal Immunol. 2022 Jun.

Abstract

Control of gut microbes is crucial for not only local defense in the intestine but also proper systemic immune responses. Although intestinal epithelial cells (IECs) play important roles in cytokine-mediated control of enterobacteria, the underlying mechanisms are not fully understood. Here we show that deletion of IκBζ in IECs in mice leads to dysbiosis with marked expansion of segmented filamentous bacteria (SFB), thereby enhancing Th17 cell development and exacerbating inflammatory diseases. Mechanistically, the IκBζ deficiency results in decrease in the number of Paneth cells and impairment in expression of IL-17-inducible genes involved in IgA production. The decrease in Paneth cells is caused by aberrant activation of IFN-γ signaling and a failure of IL-17-dependent recovery from IFN-γ-induced damage. Thus, the IL-17R-IκBζ axis in IECs contributes to the maintenance of intestinal homeostasis by serving as a key component in a regulatory loop between the gut microbiota and immune cells.


Conflict of interest statement

The authors declare no competing interests.

Figures
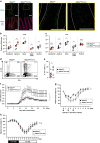
Fig. 1
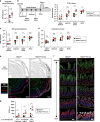
Fig. 1. Deletion of IκBζ in IECs causes an aberrant increase in Th17 cells in the small intestine and exacerbation of inflammatory diseases.
a A section of the jejunum was prepared from control (Nfkbizfl/fl) or IEC-specific IκBζ-deficient (Nfkbizfl/flVil1-Cre) mice and the expression of the indicated genes was analyzed by in situ hybridization. Magnified images of the yellow box are shown to the right. Scale bar, 50 μm. The villi are delineated by white lines. b, c The expression of Il17a (b) and Il17f (c) was determined by RT-qPCR. The mean expression levels are shown (n = 6 mice). d, e Lamina propria cells in the small intestine from the indicated mice were subjected to intracellular cytokine staining and analyzed by flow cytometry. The percentage of cells in each quadrant among FVD506CD45+CD4+TCRβ+ (CD4+ T) cells are shown (d). The results are representative of 7–8 independent experiments. The mean frequencies (percentages) of IL-17A+ cells among CD4+ T cells are shown (n = 7–8 mice per group) (e). f For induction of EAE, the indicated mice were immunized with MOG31–55 peptide on day 0 and injected with Pertussis toxin on days 0 and 2. Clinical scores were determined every day, and the mean clinical scores ±SEM (n = 11 mice per group) are shown. Data are pooled results from two independent experiments. g For induction of enteritis in the small intestine, the indicated mice were intraperitoneally injected with an agonistic anti-CD3ε antibody (1.0 mg/kg) on days 0, 2, and 4, and the body weight was measured every 24 h. The body weight is given as the percentage relative to the value on day 0. Results are presented as mean ± SEM (n = 7–8 mice per group). Data are pooled results from two independent experiments. h For induction of colitis, the indicated mice were administered 2.0% DSS in drinking water for 5 days, followed by regular water without DSS in subsequent days. Body weight was measured every 24 h, and is shown as the percentage relative to the value on day 0. Results are presented as mean ± SEM (n = 12–13 mice per group). Data are pooled results from two independent experiments. Statistical significance was determined by the Mann–Whitney U test (b, c, e) or two-way ANOVA (f, g, h). *p < 0.05, **p < 0.01, n.s., not significant.
Fig. 2
Fig. 2. Lack of IκBζ in IECs results in marked expansion of SFB in the small intestine.
a DNA was extracted from the feces of Nfkbizfl/flVil1-Cre mice and co-housed gender-matched control mice (Nfkbizfl/fl). The amount of SFB was determined by qPCR, and shown as the SFB frequency among total eubacteria. The mean values are shown (n = 9 mice per group). b–d DNA was extracted from the indicated gastrointestinal regions of Nfkbizfl/flVil1-Cre and co-housed gender-matched control mice (Nfkbizfl/fl). The amount of SFB in each tissue was determined by qPCR and given after normalization to Actb (b). The mean values of frequency of SFB among total eubacteria (c) and the amount of Eubacteria in tissue (d) are shown (n = 9 mice per group). e The whole small intestine from the indicated mice was fixed, and embedded after preparation of the “Swiss roll”. The cryo-section of the intestine was analyzed by in situ hybridization using the indicated probes and staining with Hoechst33342 (n = 5–6 mice per group). Scale bar, 1 mm. f The magnified images of the boxed area in (e) are shown. Scale bar, 100 μm. g The intestinal region was defined by the ratio of the florescent intensity of Lct to that of Slc10a2, and the signals for SFB in each region in (f) were quantified. The mean signal intensities are shown (n = 5–6 mice per group). Statistical significance was determined by Mann–Whitney U test. *p < 0.05, **p < 0.01, ***p < 0.001, n.s. not significant.
Fig. 3
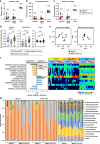
Fig. 3. Lack of IκBζ in IECs causes drastic alteration in the microbiota in the small intestine.
Bacterial composition of the jejunum, upper ileum, or feces from the indicated mice was investigated by sequencing the v4 region of the 16 S rRNA gene (n = 9 mice per group). a–c α-diversity based on the Shannon index (a) OTU richness (b), and Shannon evenness (c) was examined. The mean values are shown. Statistical significance was determined by Mann–Whitney U test. d, e β-diversity between control (Nfkbizfl/fl) and Nfkbizfl/flVil1-Cre mice was examined. Bray–Curtis dissimilarity indices of microbiota within each group and that between the two groups are shown as the box plot, and statistical significance was determined by Kruskal–Wallis test followed by Dunn’s multiple comparisons test (d). P values in the non-metric multi-dimensional scaling (NMDS) plot were obtained using PERMANOVA (e). f Linear discriminant analysis effect size (LEfSe) was analyzed. Differentially abundant operational taxonomic units (OTUs) are shown with linear discriminant analysis (LDA) values in LEfSe in accordance with the criteria of p < 0.05, positive false discovery rate (FDR) < 0.05, and modulus of signal-to-noise ratio (|SNR | ) > 0.5. g The composition of taxonomic families and orders was analyzed. *p < 0.05, **p < 0.01, ***p < 0.001, ****p < 0.0001, n.s., not significant.
Fig. 4
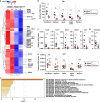
Fig. 4. Deletion of IκBζ impairs expression of microbe-controlling genes in IECs of the small intestine.
a Total RNA was extracted from the ilea of two pairs of Nfkbizfl/flVil1-Cre and co-housed gender-matched controls (Nfkbizfl/fl), and the gene expression profiles were analyzed by microarray analysis (n = 2 mice per group). A heat map of 83 genes down-regulated in Nfkbizfl/flVil1-Cre mice (<50% of control mice in both pairs) is shown. b, c Total RNA was extracted from the indicated intestinal regions (b) or the ileum (c), and the expression of the indicated genes was analyzed by RT-qPCR. The mean expression levels are shown (n = 6 mice per group). d Total fecal proteins were extracted from the indicated mice and the amount of IgA was determined by ELISA. The IgA amounts are shown as per 100 μg of total fecal proteins. The mean values are shown (n = 9 mice per group). e Expression of Igha in the indicated intestinal regions was analyzed as in (b). f Pathway and process enrichment analysis of the 83 down-regulated genes in Nfkbizfl/flVil1-Cre mice. Statistical significance was determined by the Mann–Whitney U test (be). *p < 0.05, **p < 0.01, n.s., not significant.
Fig. 5
Fig. 5. IκBζ is required for IL-17-induced gene expression in IECs.
a Organoids were prepared from the small intestine of wild-type mice, and stimulated with IL-17A (20 ng/ml) for the indicated periods. Expression of the indicated genes was analyzed by RT-qPCR. The results are presented as the mean ± SD of triplicates and are representative of organoids from three mice. b The organoids from control (Nfkbizfl/fl) or Nfkbizfl/flVil1-Cre mice were unstimulated or stimulated with IL-17A for 24 h, and analyzed as in (a).
Fig. 6
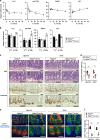
Fig. 6. Deletion of IκBζ in IECs leads to decrease in Paneth cells.
a Small intestinal organoids from wild-type mice were stimulated with IL-17A (20 ng/ml) for the indicated periods. Expression of the indicated genes was analyzed by RT-qPCR. The results are presented as the mean ± SD of triplicates and are representative of organoids from three mice. b Organoids from control (Nfkbizfl/fl) or Nfkbizfl/flVil1-Cre mice were unstimulated or stimulated with IL-17A for 24 h and the expression of the indicated genes was analyzed as in (a). c, d Tissue sections of the indicated regions of the small intestine were stained with hematoxylin-eosin (H&E) or anti-lysozyme antibody. Scale bars, 50 μm (c). e, f Tissue sections were stained with UEA-1, anti-E-cadherin antibody, and Hoechst 33258. Scale bars, 25 μm. (e). Magnified images of the box are shown to the bottom. Results are representative of six independent experiments (c, e). Lysozyme+ or UEA-1+ cells were counted in 50 crypts per region per mouse (n = 6 mice per group), and are shown as the mean number per crypt (d, f). Statistical significance was determined by the Mann–Whitney U test. *p < 0.05, **p < 0.01.
Fig. 7
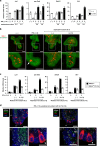
Fig. 7. The IL-17R–IκBζ axis facilitates restoration of Paneth cells from IFN-γ-induced damage.
a After treatment with IFN-γ (20 ng/ml) for 1 day, wild-type organoids were washed twice and then re-cultured in fresh media for 2 or 4 days in the absence or presence of IL-17A (20 ng/ml). Expression of the indicated genes was analyzed by RT-qPCR. The results are presented as the mean ± SD of triplicates and are representative of organoids from three mice. b Wild-type organoids treated as indicated were stained with UEA-1 and anti-E-cadherin antibody. Magnified images of the box are shown to the bottom. Results are representative of four independent experiments. The arrow indicates the release of Paneth cell granule into the crypt lumen. Scale bar, 50 μm. c Organoids from control (Nfkbizfl/fl) or Nfkbizfl/flVil1-Cre mice were treated with IFN-γ (20 ng/ml). The organoids were washed out, and re-cultured for 4 days in the absence or presence of IL-17A (20 ng/ml). Expression of the indicated genes was analyzed as in (a). d Wild-type organoids were treated as indicated, and analyzed by in situ hybridization (RNAscope) using probes specific to Nfkbiz, Enpep (an enterocyte marker), Lyz1 (a Paneth cell marker), and Lgr5 (an intestinal stem cell marker). Magnified images of the indicated boxes are shown to the bottom. Results are representative of two independent experiments. Scale bar, 20 μm (top) and 5 μm (bottom). The arrowheads in B and D indicate Paneth cells with the signals of Nfkbiz expression.
Fig. 8
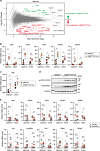
Fig. 8. Lack of IκBζ in IECs causes aberrant activation of IFN-γ signaling.
a Total RNA was extracted from the jejuna of Nfkbizfl/flVil1-Cre mice and co-housed gender-matched controls (Nfkbizfl/fl), and the gene expression profiles were analyzed by RNA-seq analysis (n = 3 mice per group). The MA plot is shown to visualize mean expression levels (x-axis) and the fold change in Nfkbizfl/flVil1-Cre mice over control mice (y-axis) for each gene. Down-regulated and up-regulated genes in the jejuna of Nfkbizfl/flVil1-Cre mice are shown in red and green, respectively. b, c Expression of the indicated genes in the jejuna and ilea was analyzed by RT-qPCR (n = 6 mice per group). The mean expression levels are shown. d Lysates from the jejuna of the indicated mice were analyzed by immunoblotting using the indicated antibodies (n = 5). e Nfkbizfl/flVil1-Cre mice were intraperitoneally injected with an anti-IFN-γ antibody or an isotype control antibody (15 mg/kg) every 3 days, and the intestines were removed 24 h after the last injection. Expression of the indicated genes was analyzed as in (b) (n = 6 mice per group). Statistical significance was determined by Mann–Whitney U test (b, c, f). *p < 0.05, **p < 0.01, n.s., not significant.
Fig. 9
Fig. 9. NF-κB p50 is required for IκBζ-mediated gene regulation in IECs.
a The small intestinal organoids from control (Nfkb1+/−) or NF-κB p50-deficient (Nfkb1−/−) mice were unstimulated or stimulated with IL-17A (20 ng/ml) for 24 h. Expression of the indicated genes was analyzed by RT-qPCR. The results are presented as the mean ± SD of triplicates and are representative of organoids from three mice. b Organoids from the indicated mice were treated with IFN-γ (20 ng/ml), washed out, and re-cultured in fresh media for 4 days in the absence or presence of IL-17A (20 ng/ml). Expression of the indicated genes was analyzed as in (a). c, d Total RNA was extracted from the indicated intestinal regions (c) or the ileum (d) of the indicated mice. Expression of the indicated genes was analyzed by RT-qPCR. The mean expression levels are shown (n = 6 mice per group). Statistical significance was determined by Mann–Whitney U test (c, d). *p < 0.05, **p < 0.01, ****p < 0.0001, n.s., not significant.

Similar articles

Cited by

References

    1. Round JL, Mazmanian SK. The gut microbiota shapes intestinal immune responses during health and disease. Nat. Rev. Immunol. 2009;9:313–323. doi: 10.1038/nri2515. - DOI - PMC - PubMed
    1. Pickard JM, Zeng MY, Caruso R, Núñez G. Gut microbiota: role in pathogen colonization, immune responses, and inflammatory disease. Immunol. Rev. 2017;279:70–89. doi: 10.1111/imr.12567. - DOI - PMC - PubMed
    1. Sankaran-Walters S, Hart R, Dills C. Guardians of the Gut: Enteric Defensins. Front. Microbiol. 2017;8:647. doi: 10.3389/fmicb.2017.00647. - DOI - PMC - PubMed
    1. Andrews C, McLean MH, Durum SK. Cytokine Tuning of Intestinal Epithelial Function. Front. Immunol. 2018;9:1270. doi: 10.3389/fimmu.2018.01270. - DOI - PMC - PubMed
    1. Kayama H, Okumura R, Takeda K. Interaction Between the Microbiota, Epithelia, and Immune Cells in the Intestine. Annu. Rev. Immunol. 2020;38:23–48. doi: 10.1146/annurev-immunol-070119-115104. - DOI - PubMed

Publication types