. 2022 Aug 22;5(10):e202201442.
doi: 10.26508/lsa.202201442. Print 2022 Oct.

Intestinal single-cell atlas reveals novel lymphocytes in pigs with similarities to human cells

Affiliations

Intestinal single-cell atlas reveals novel lymphocytes in pigs with similarities to human cells

Jayne E Wiarda et al. Life Sci Alliance. .

Abstract

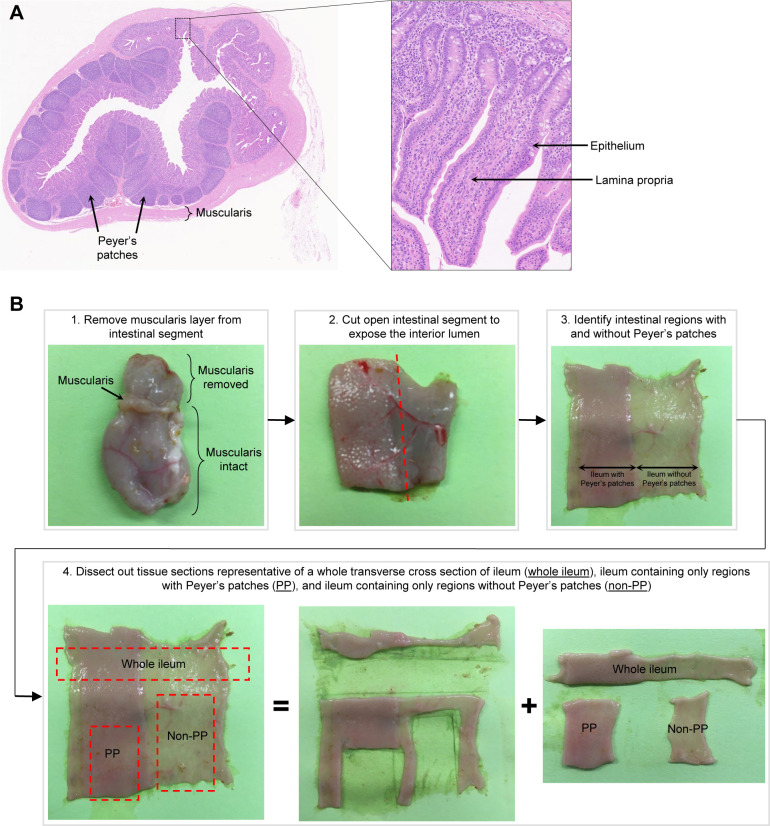
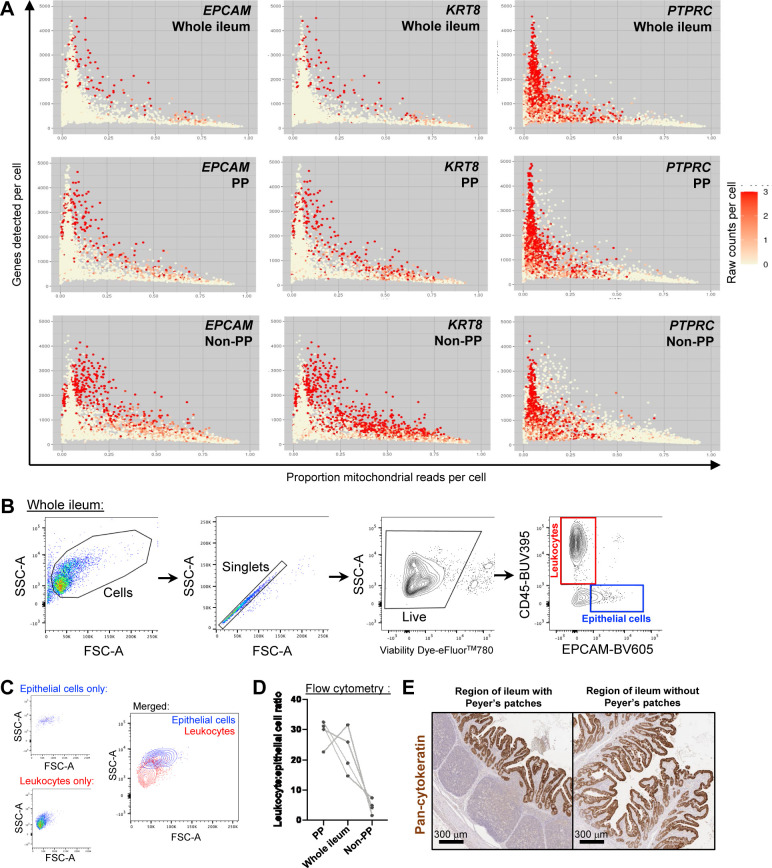
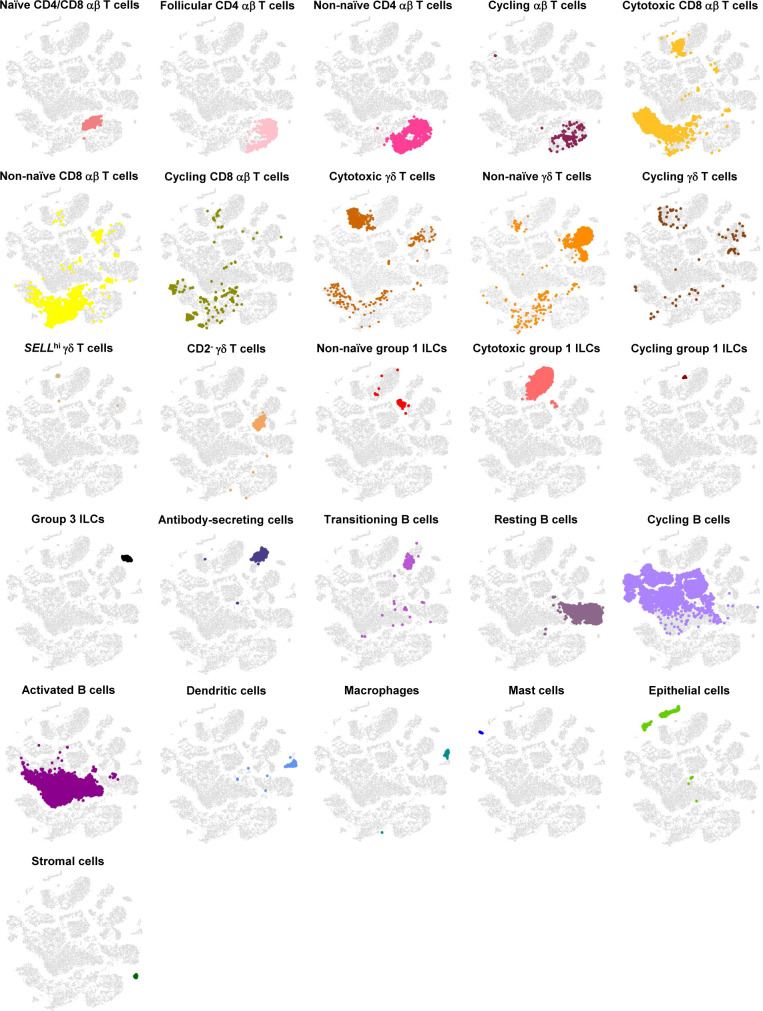
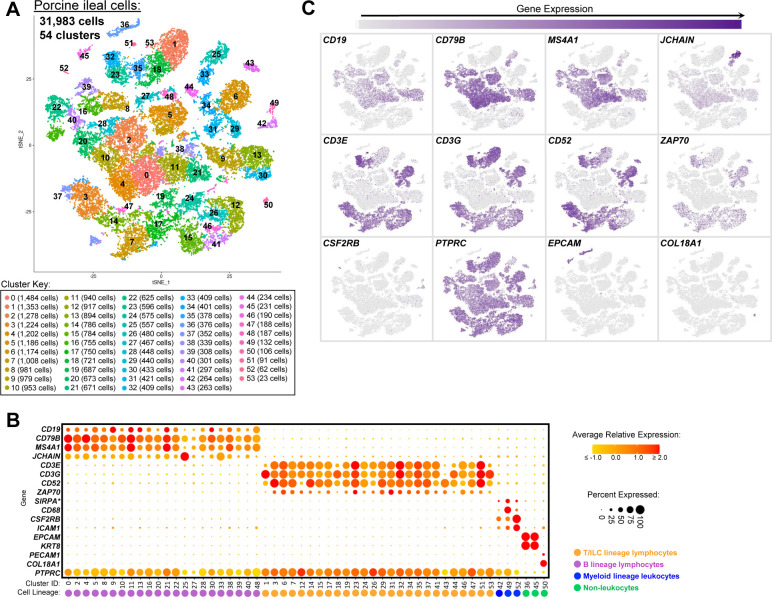
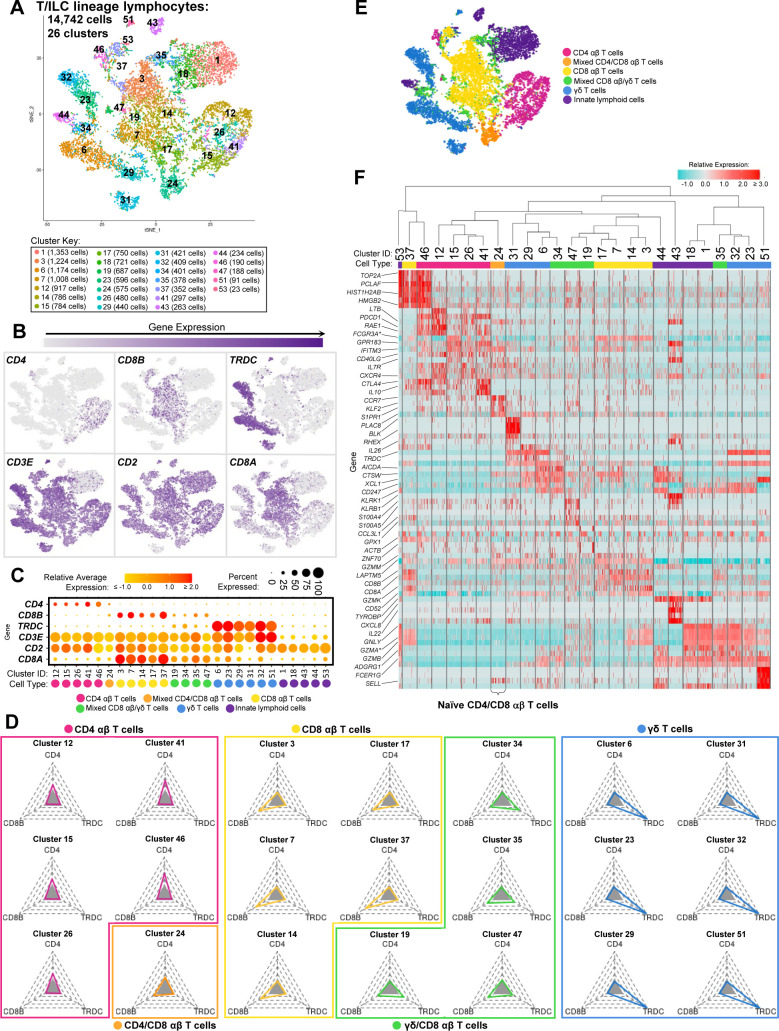
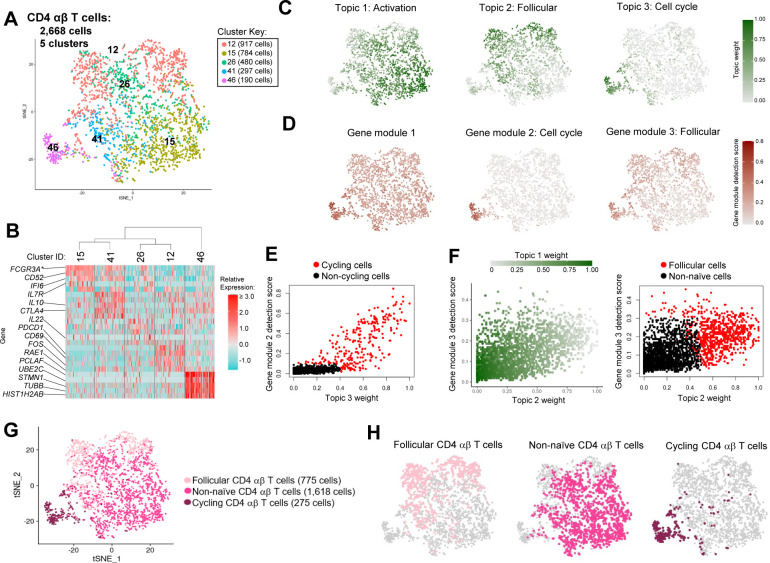
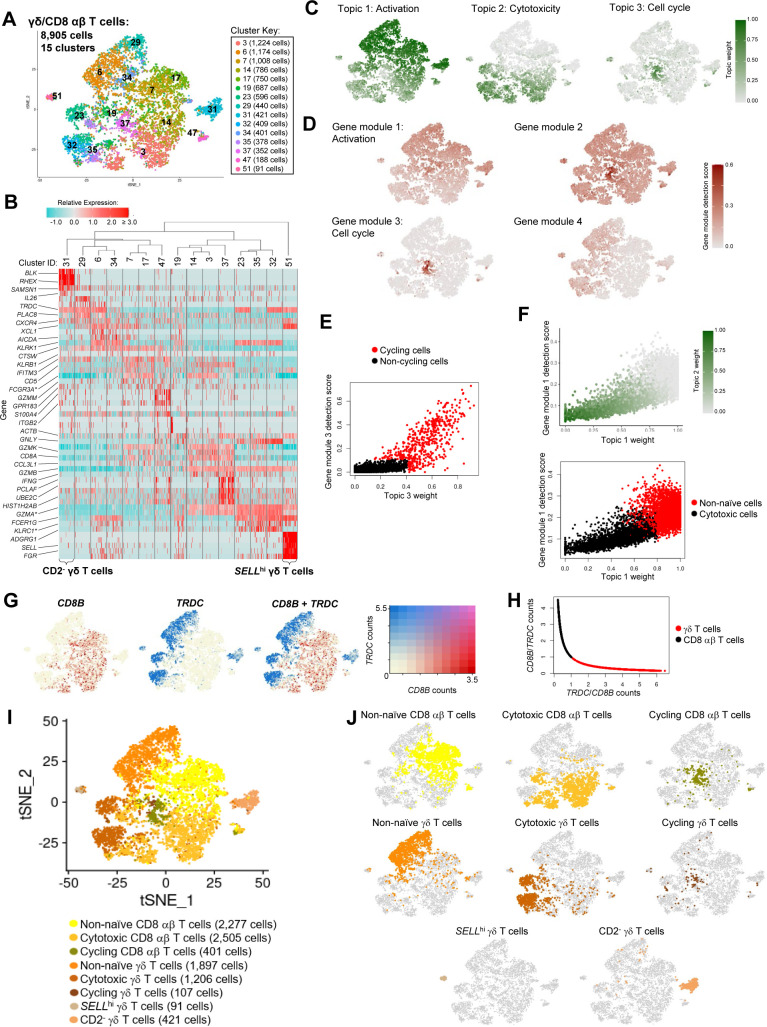
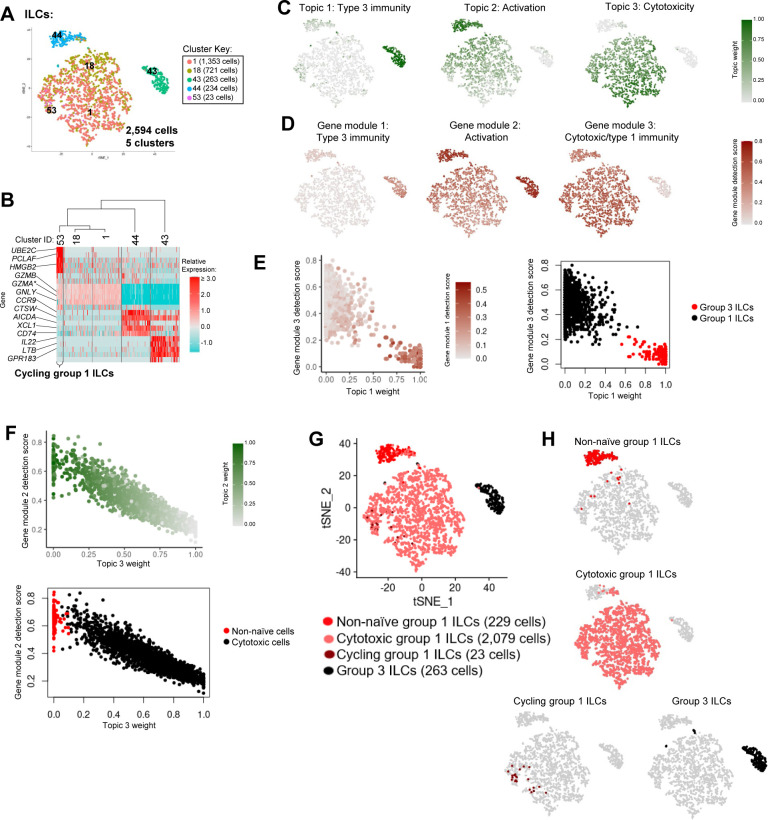
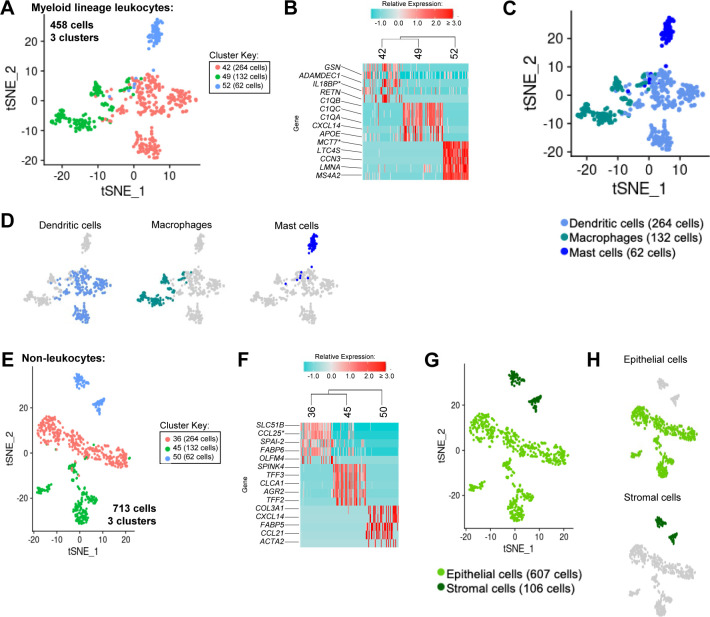
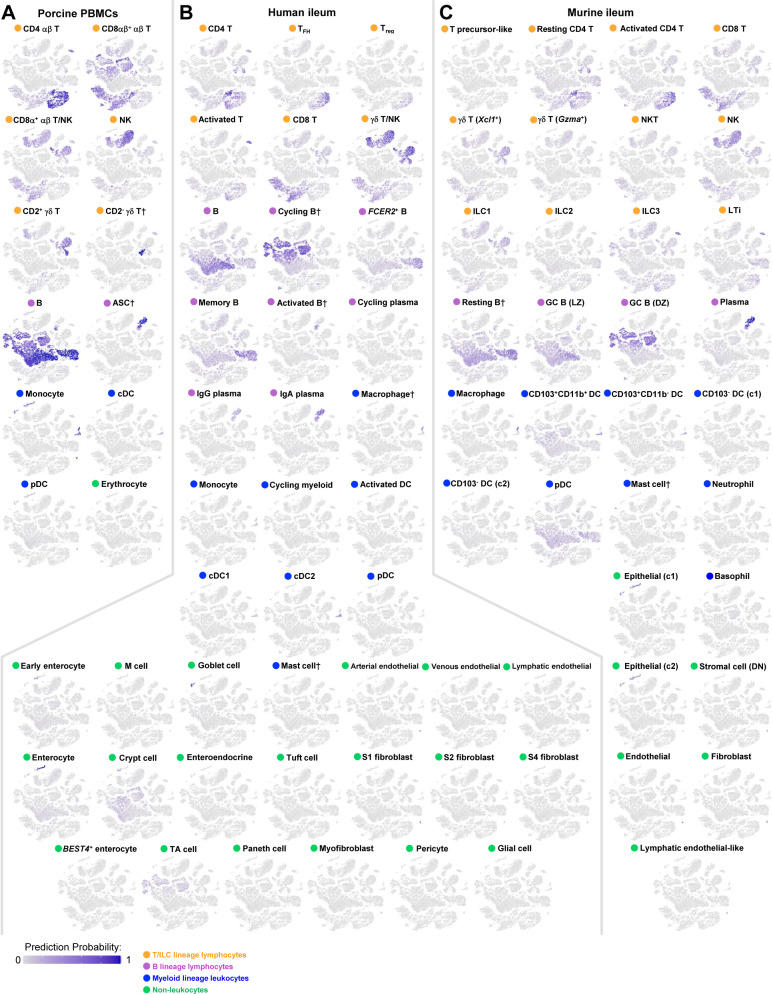
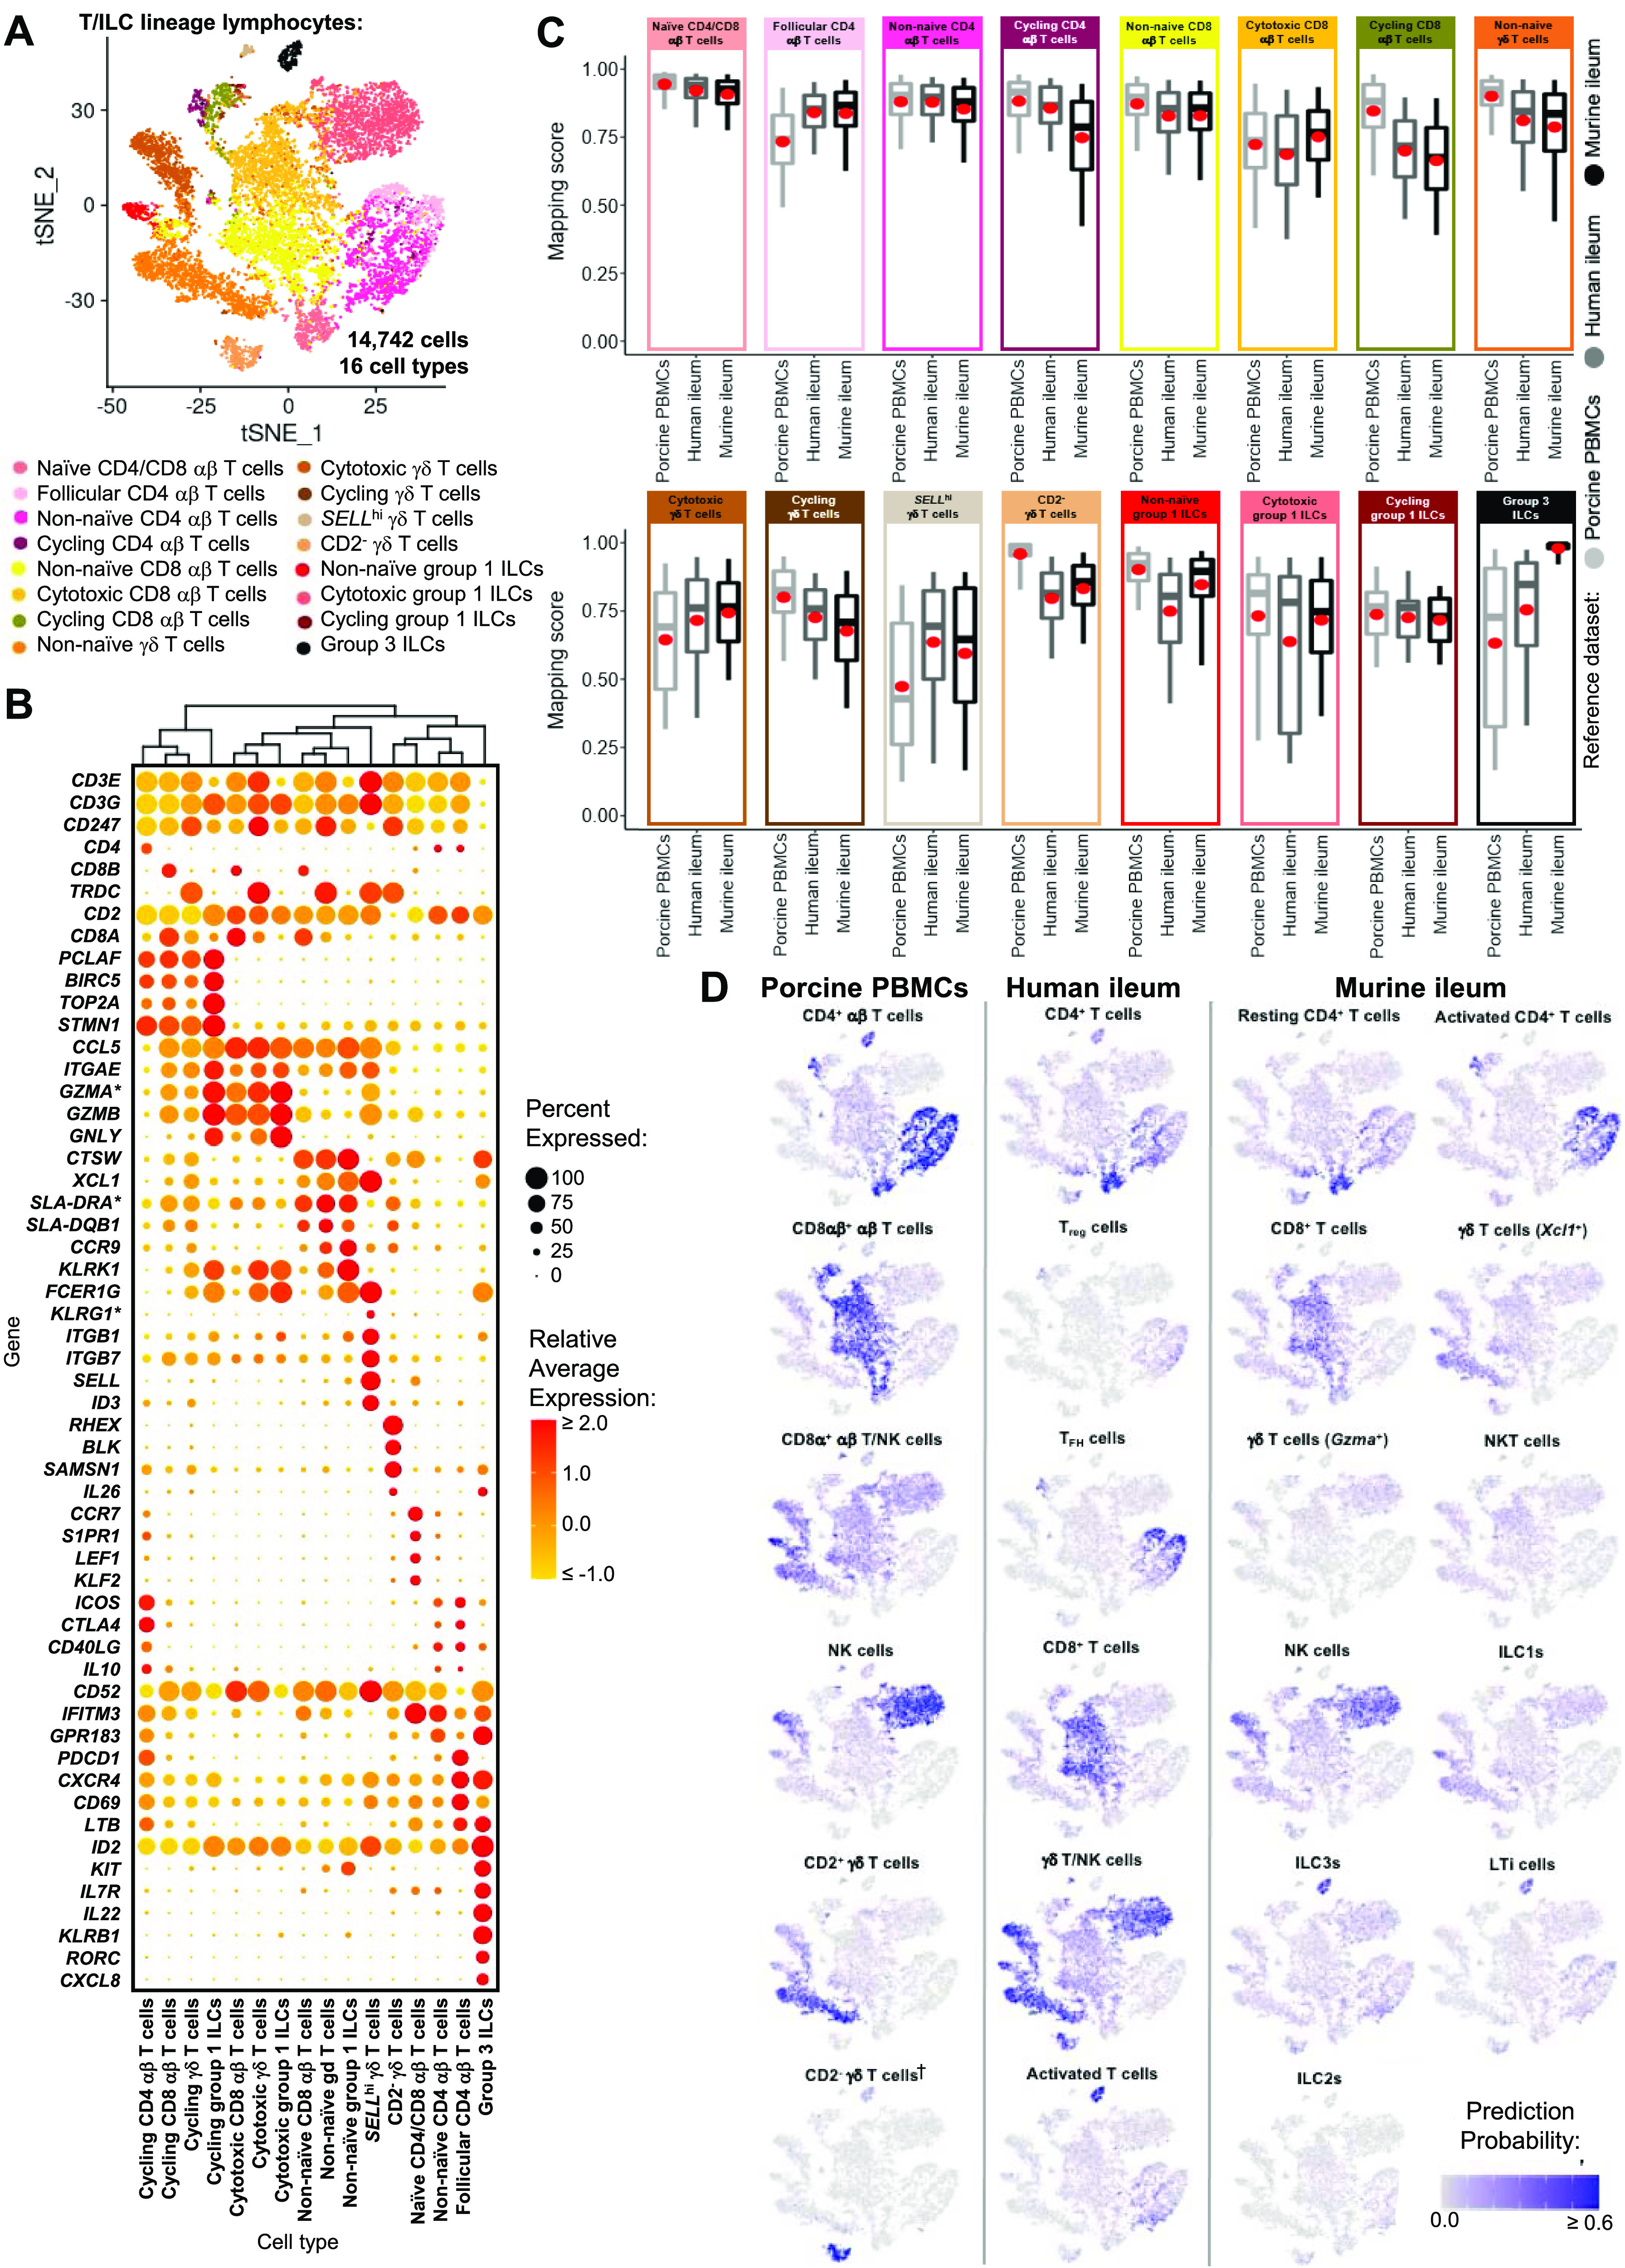
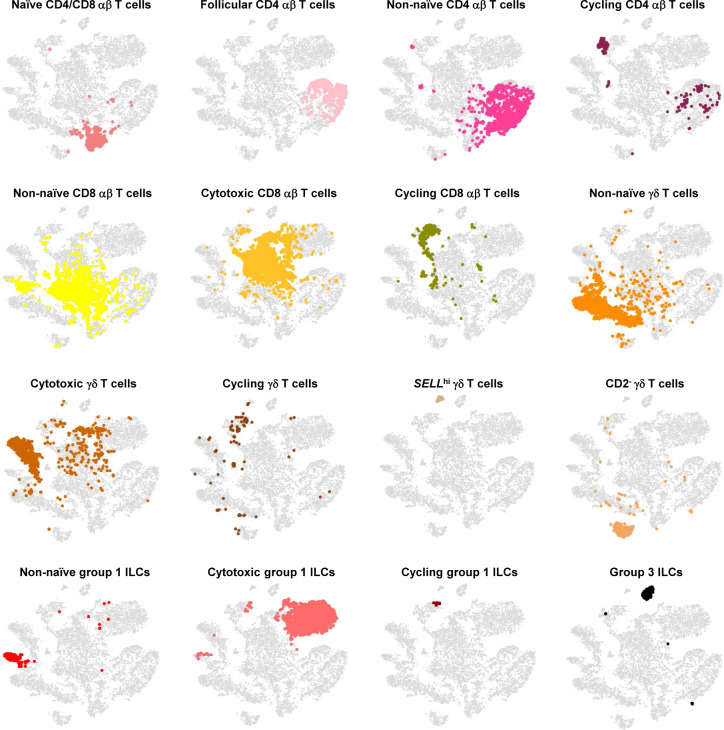
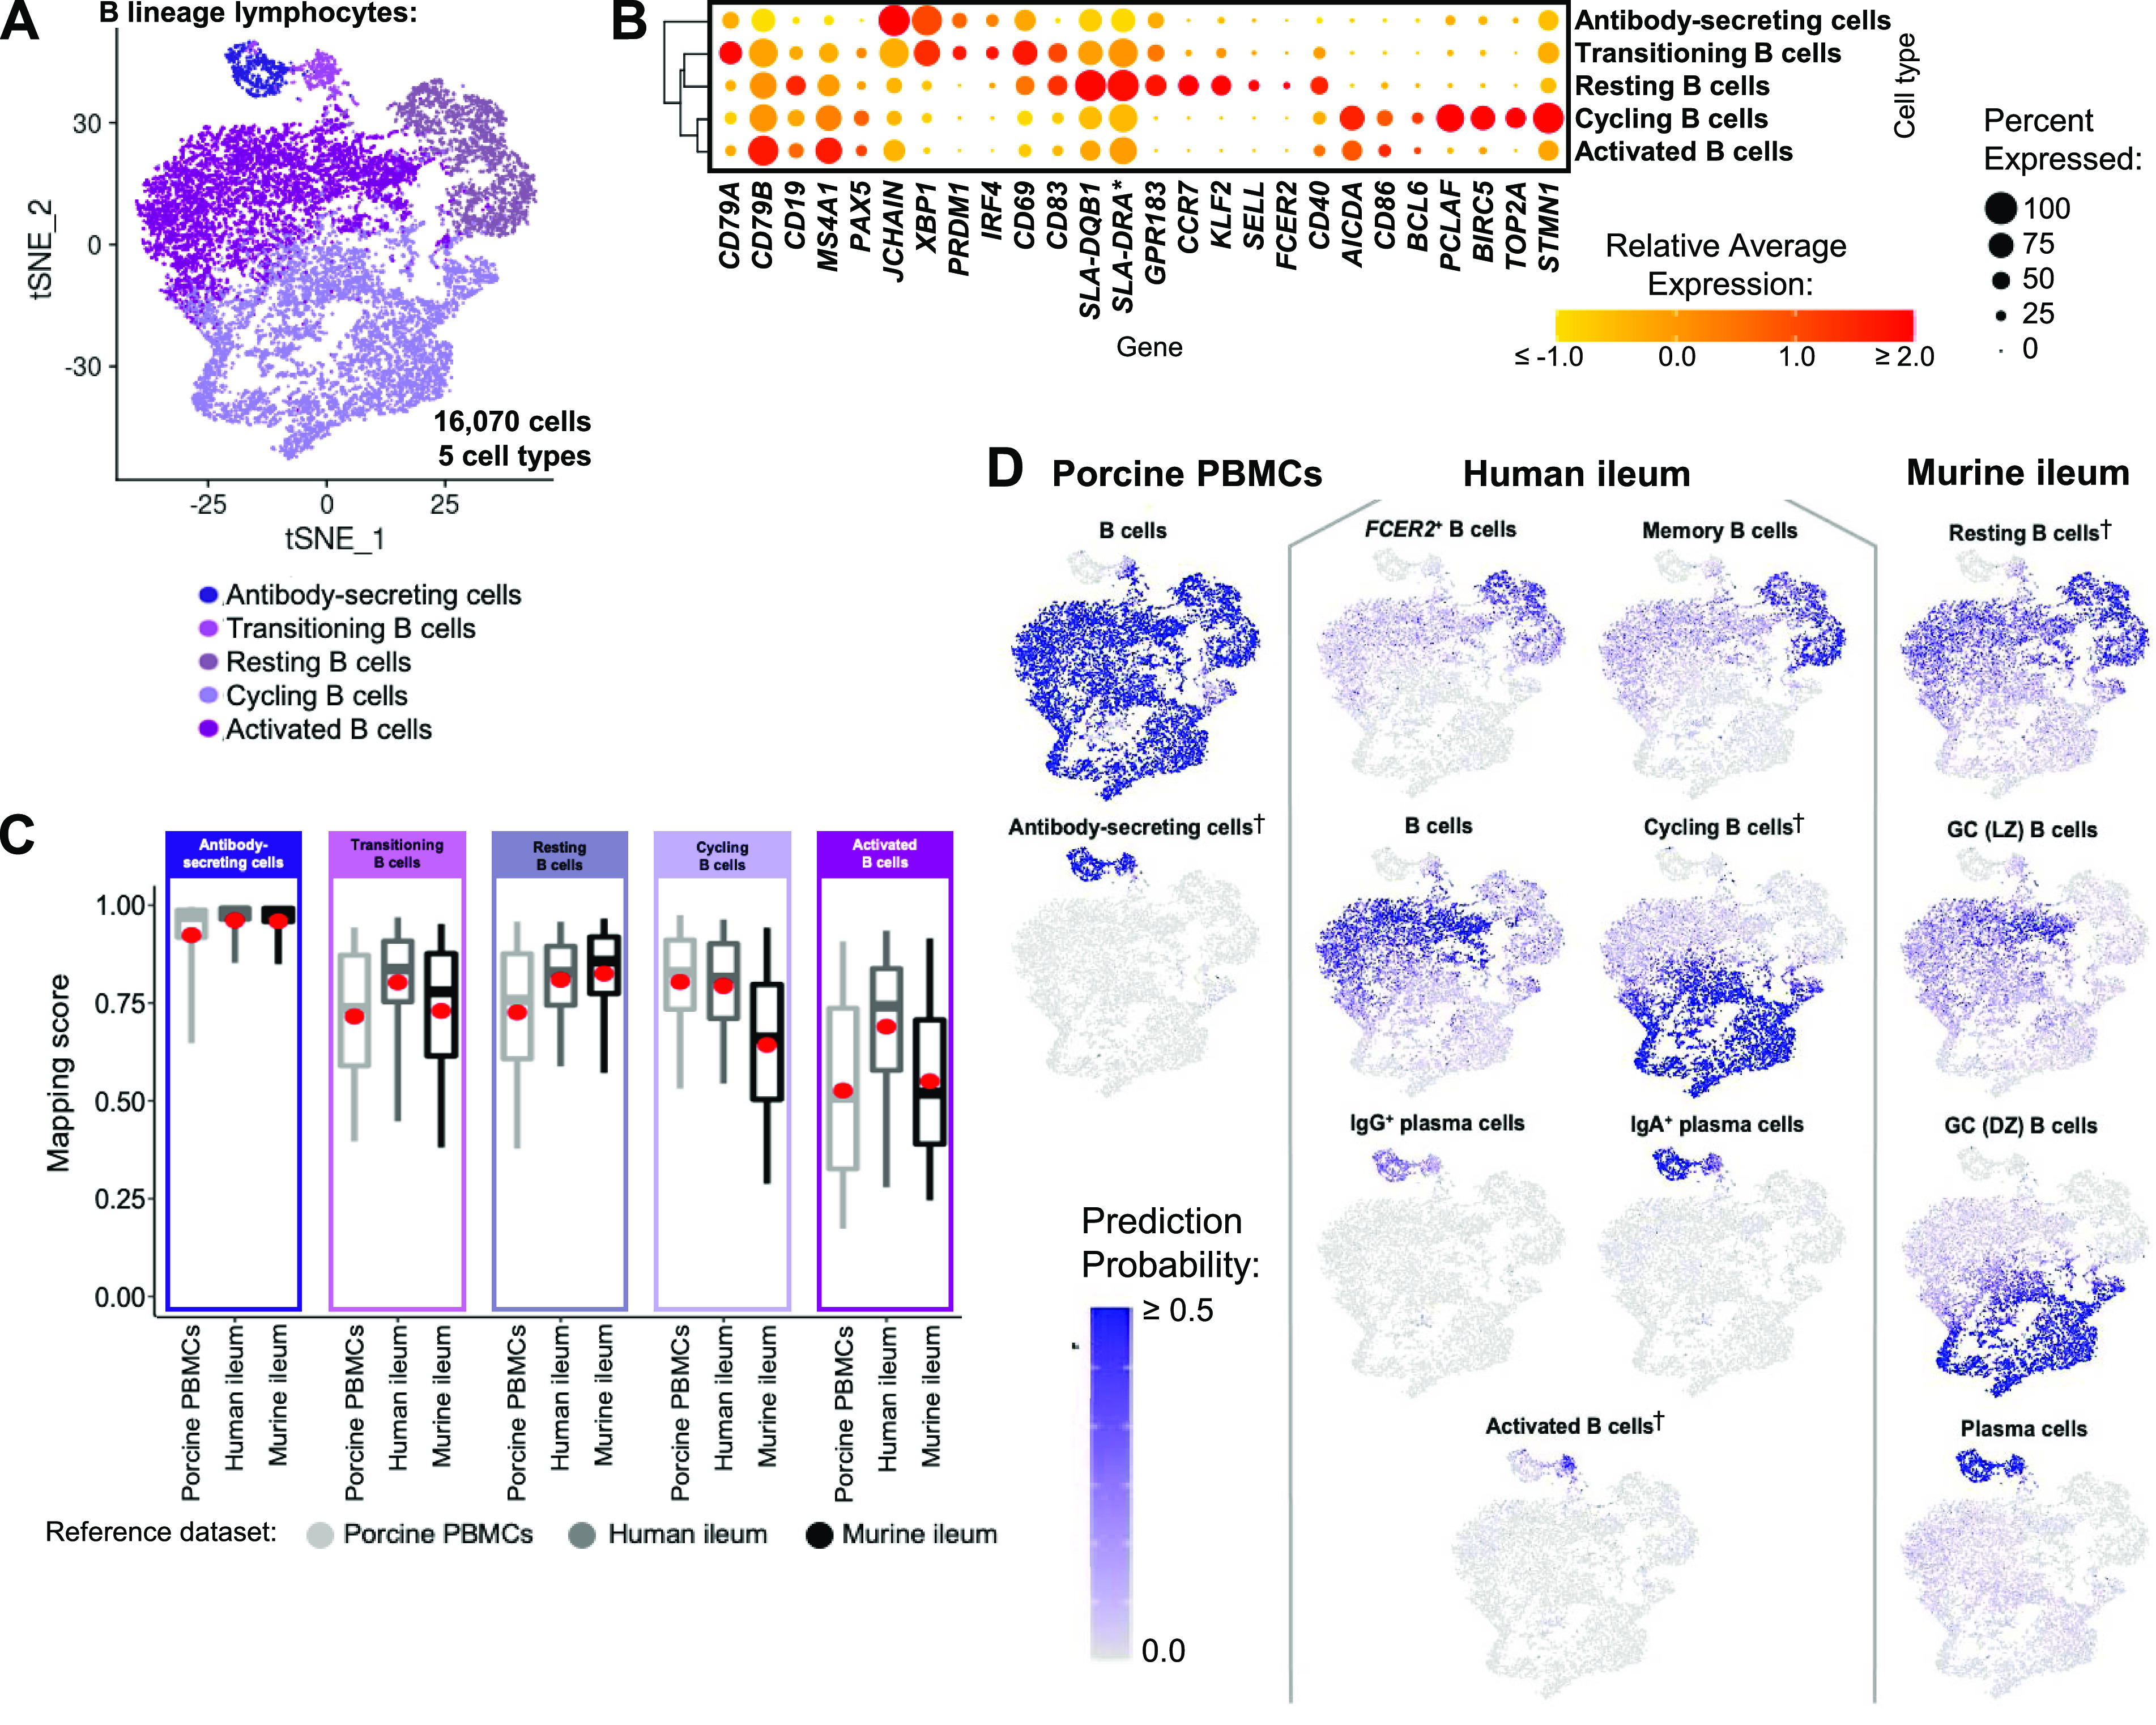
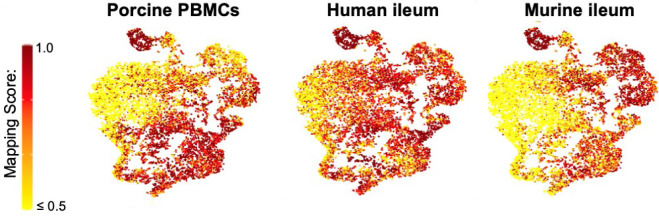
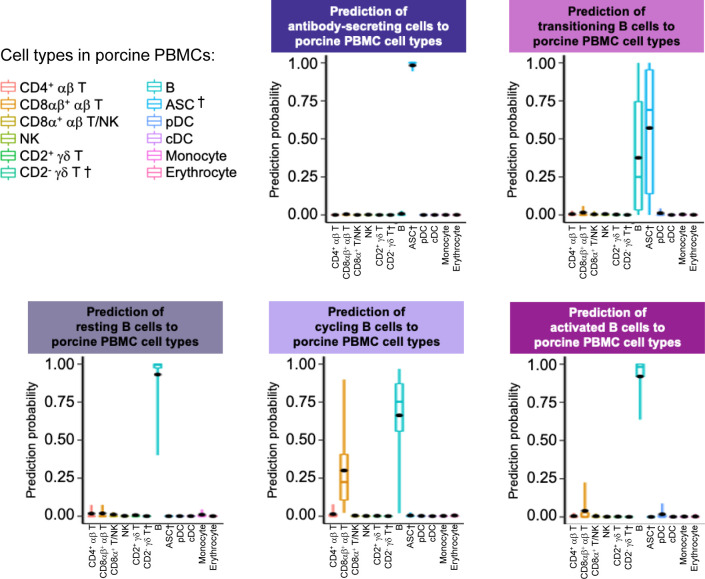
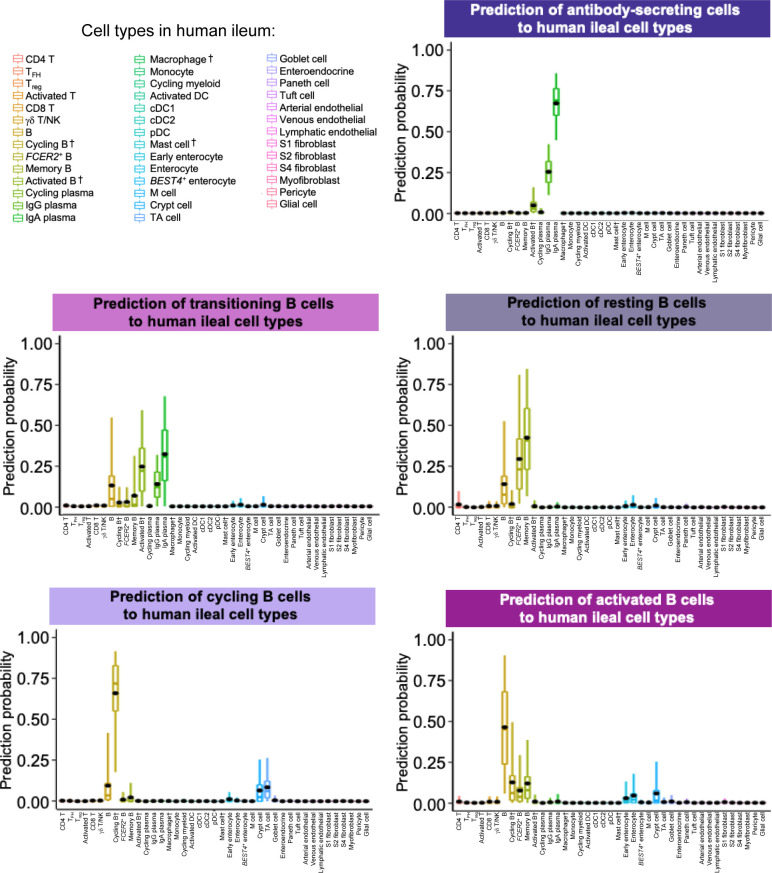
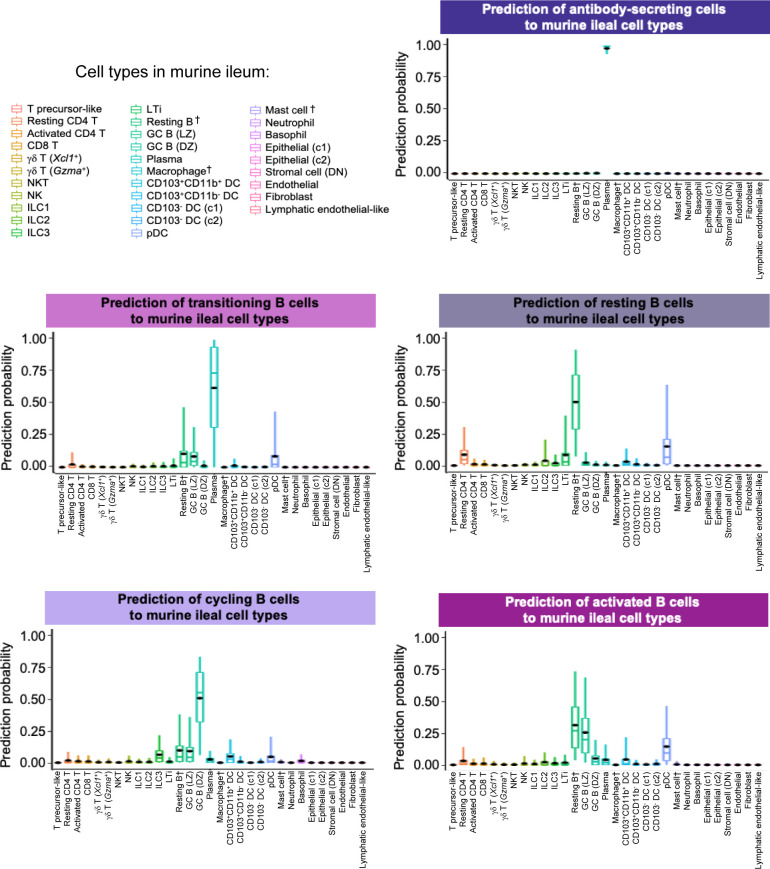
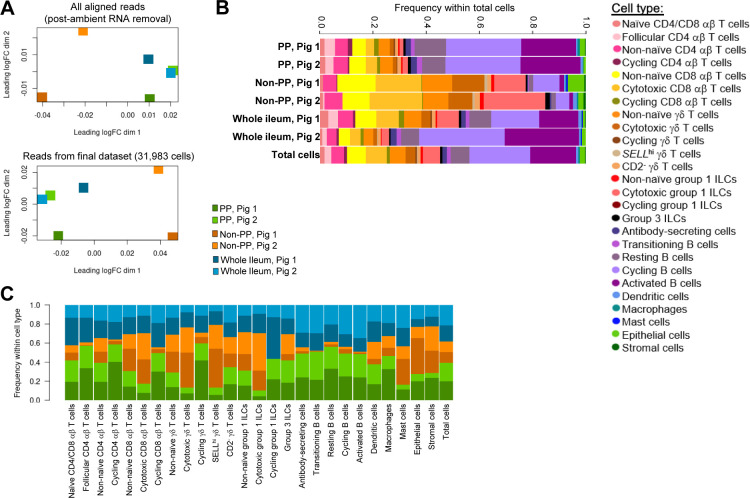
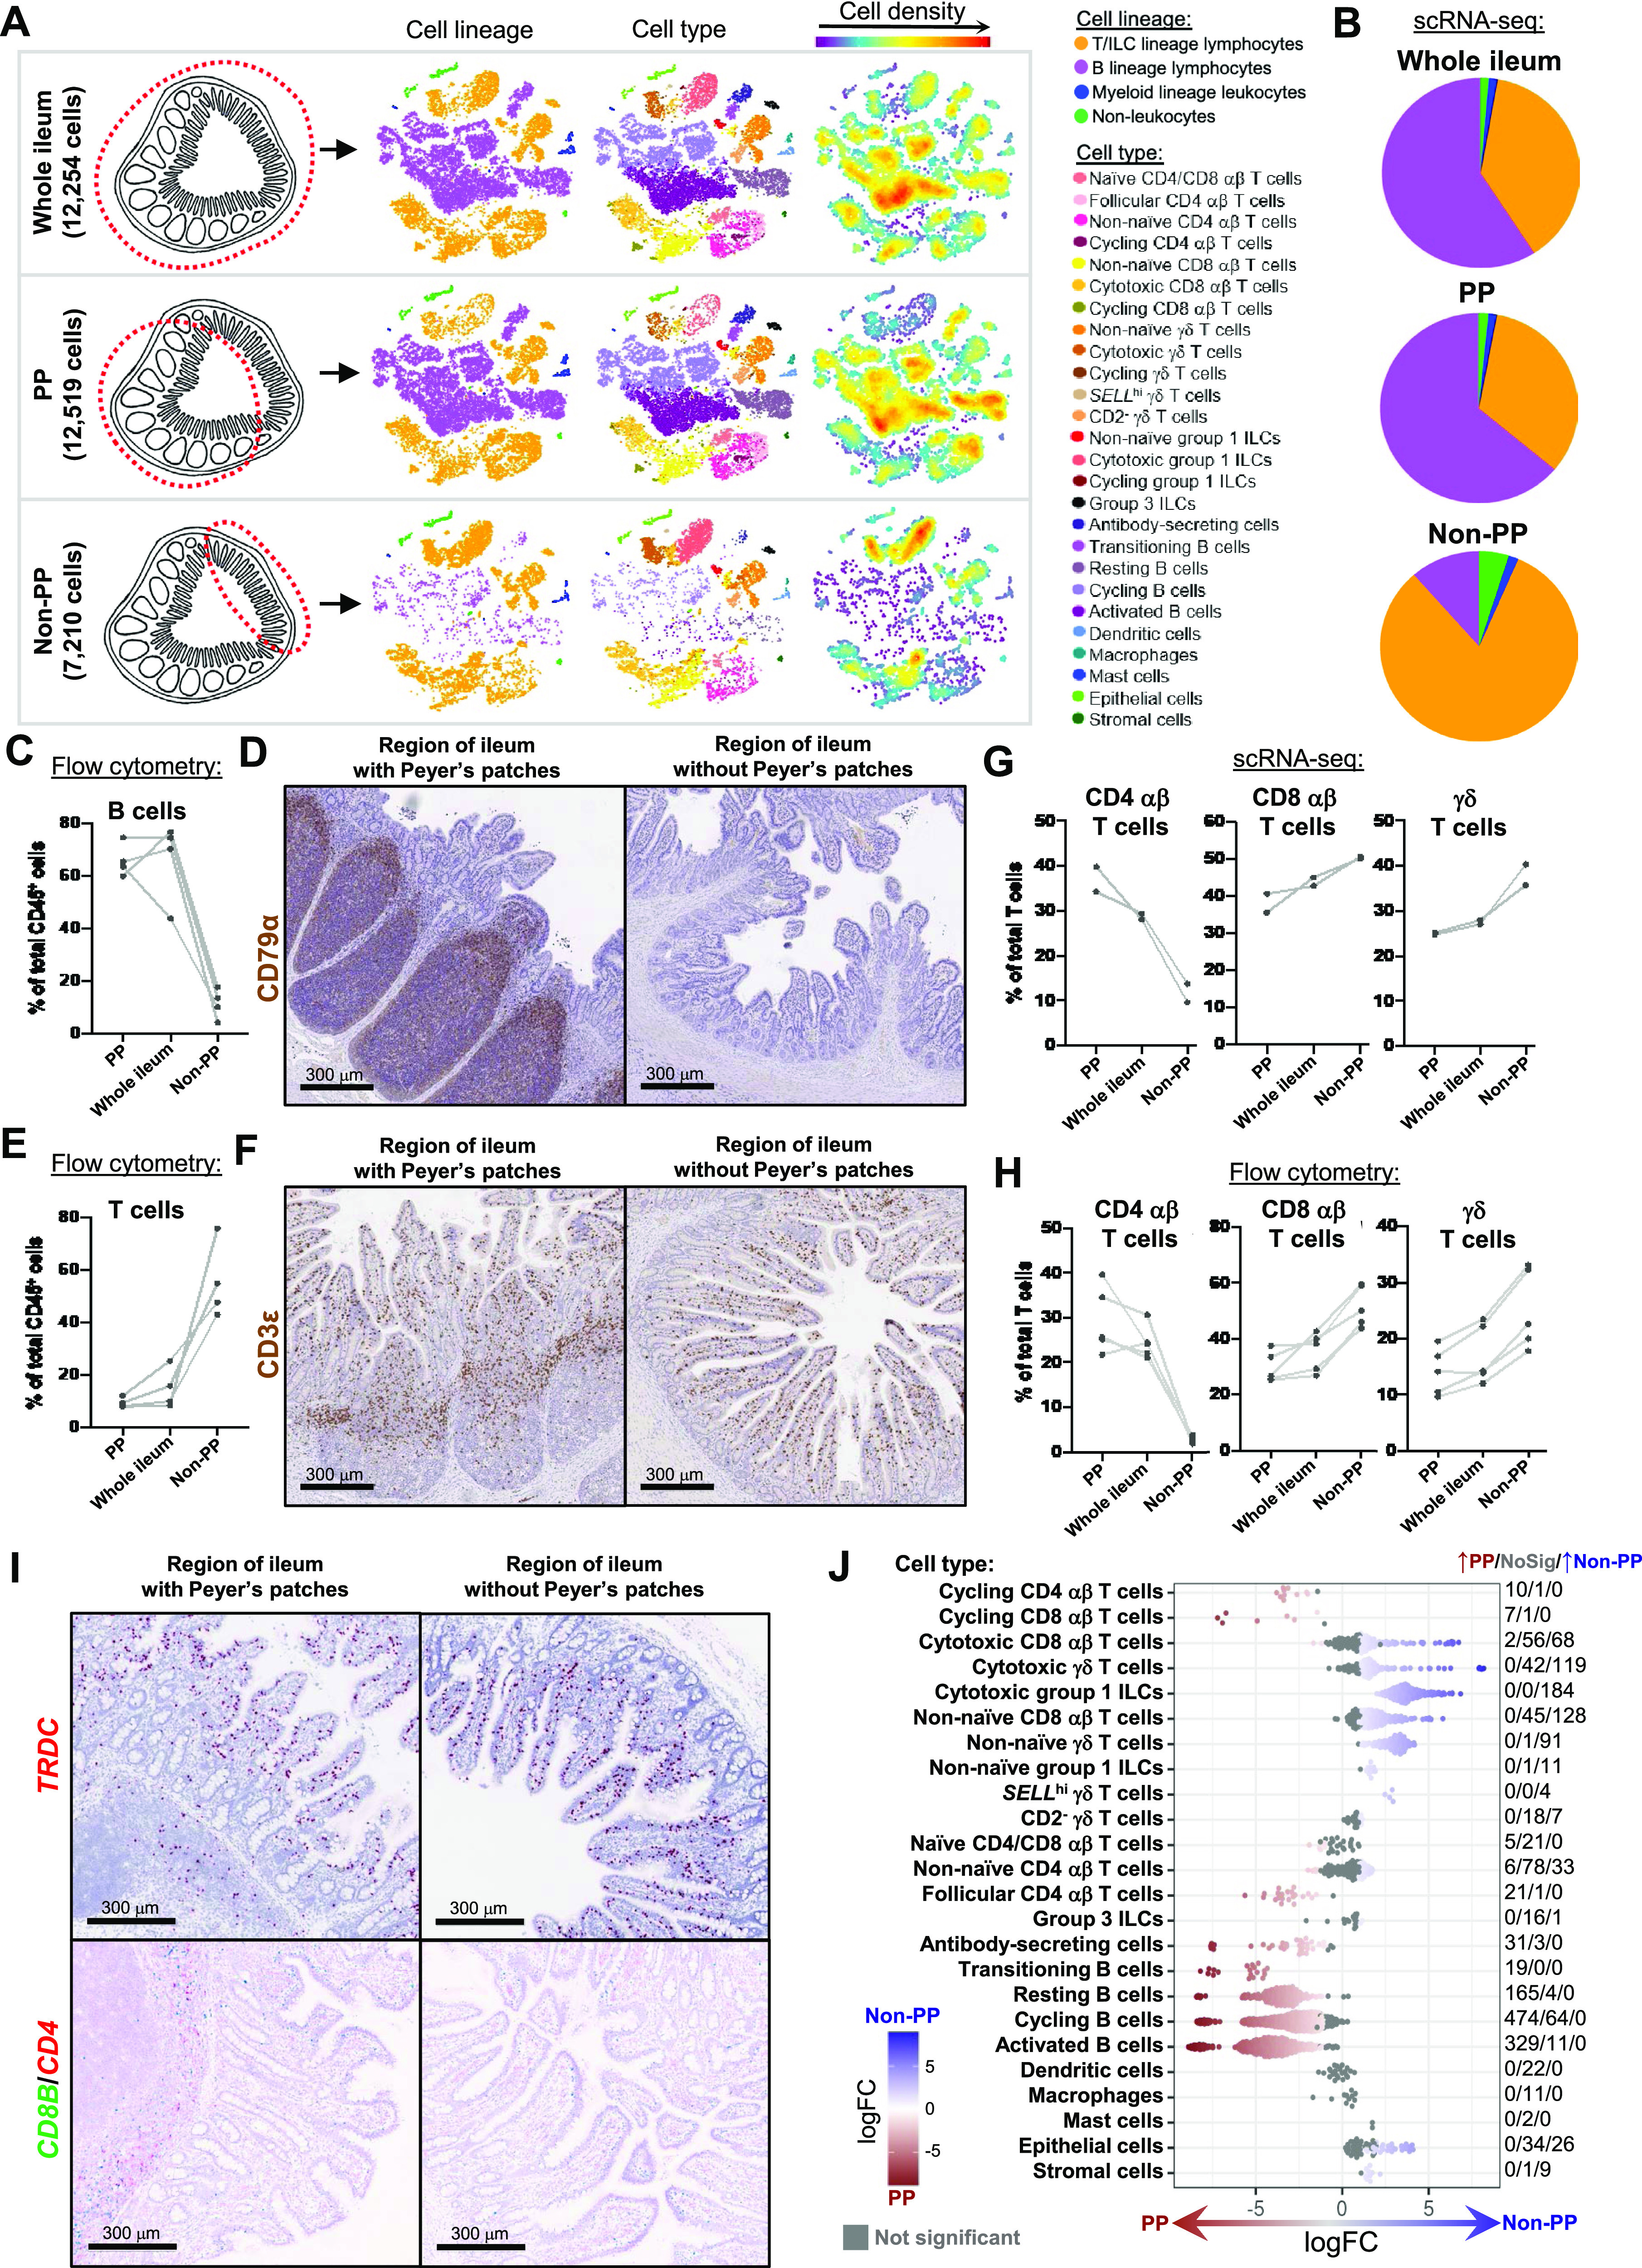
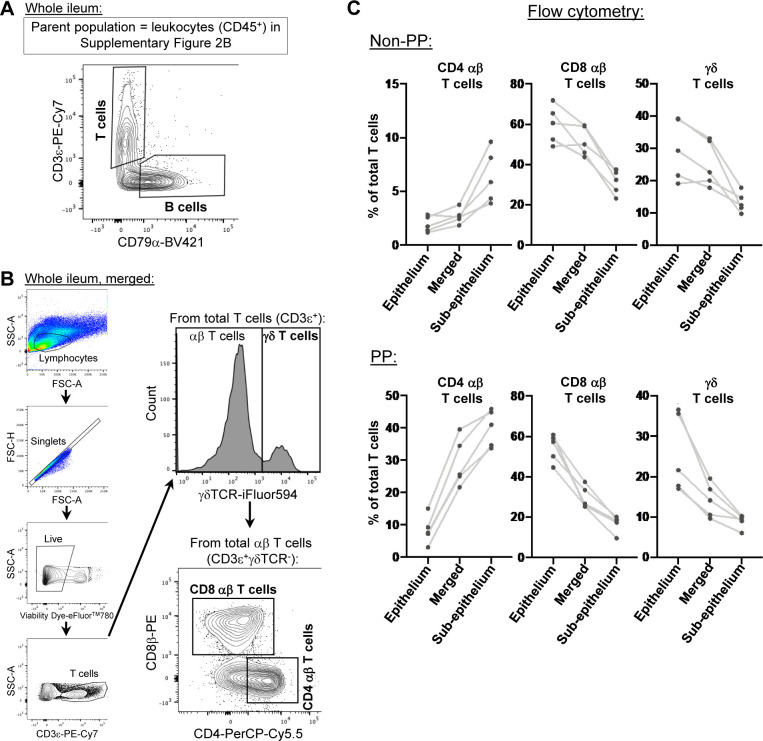
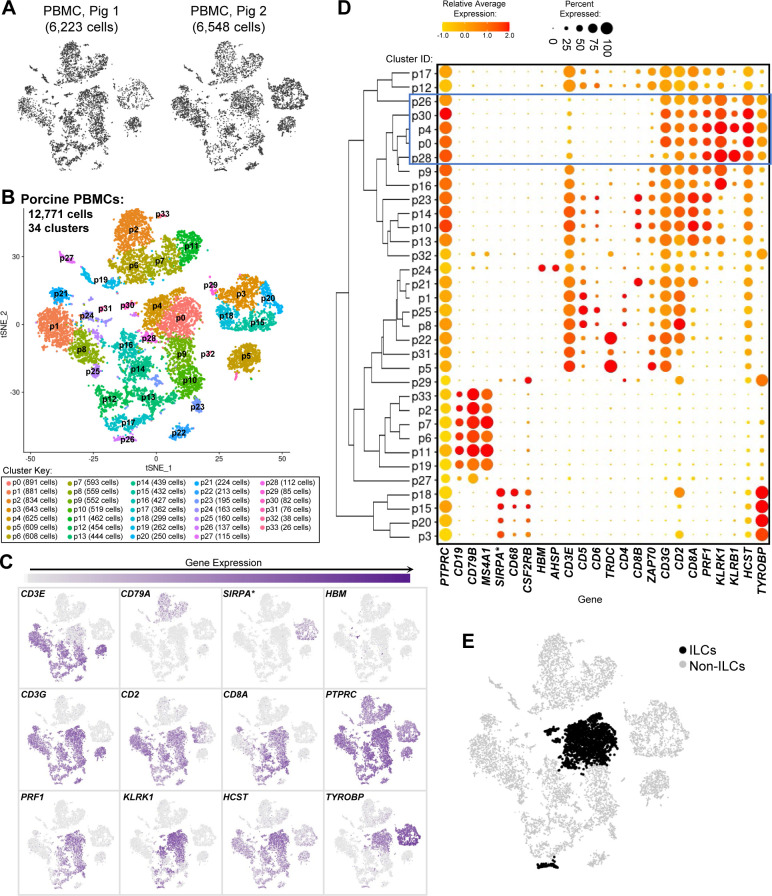
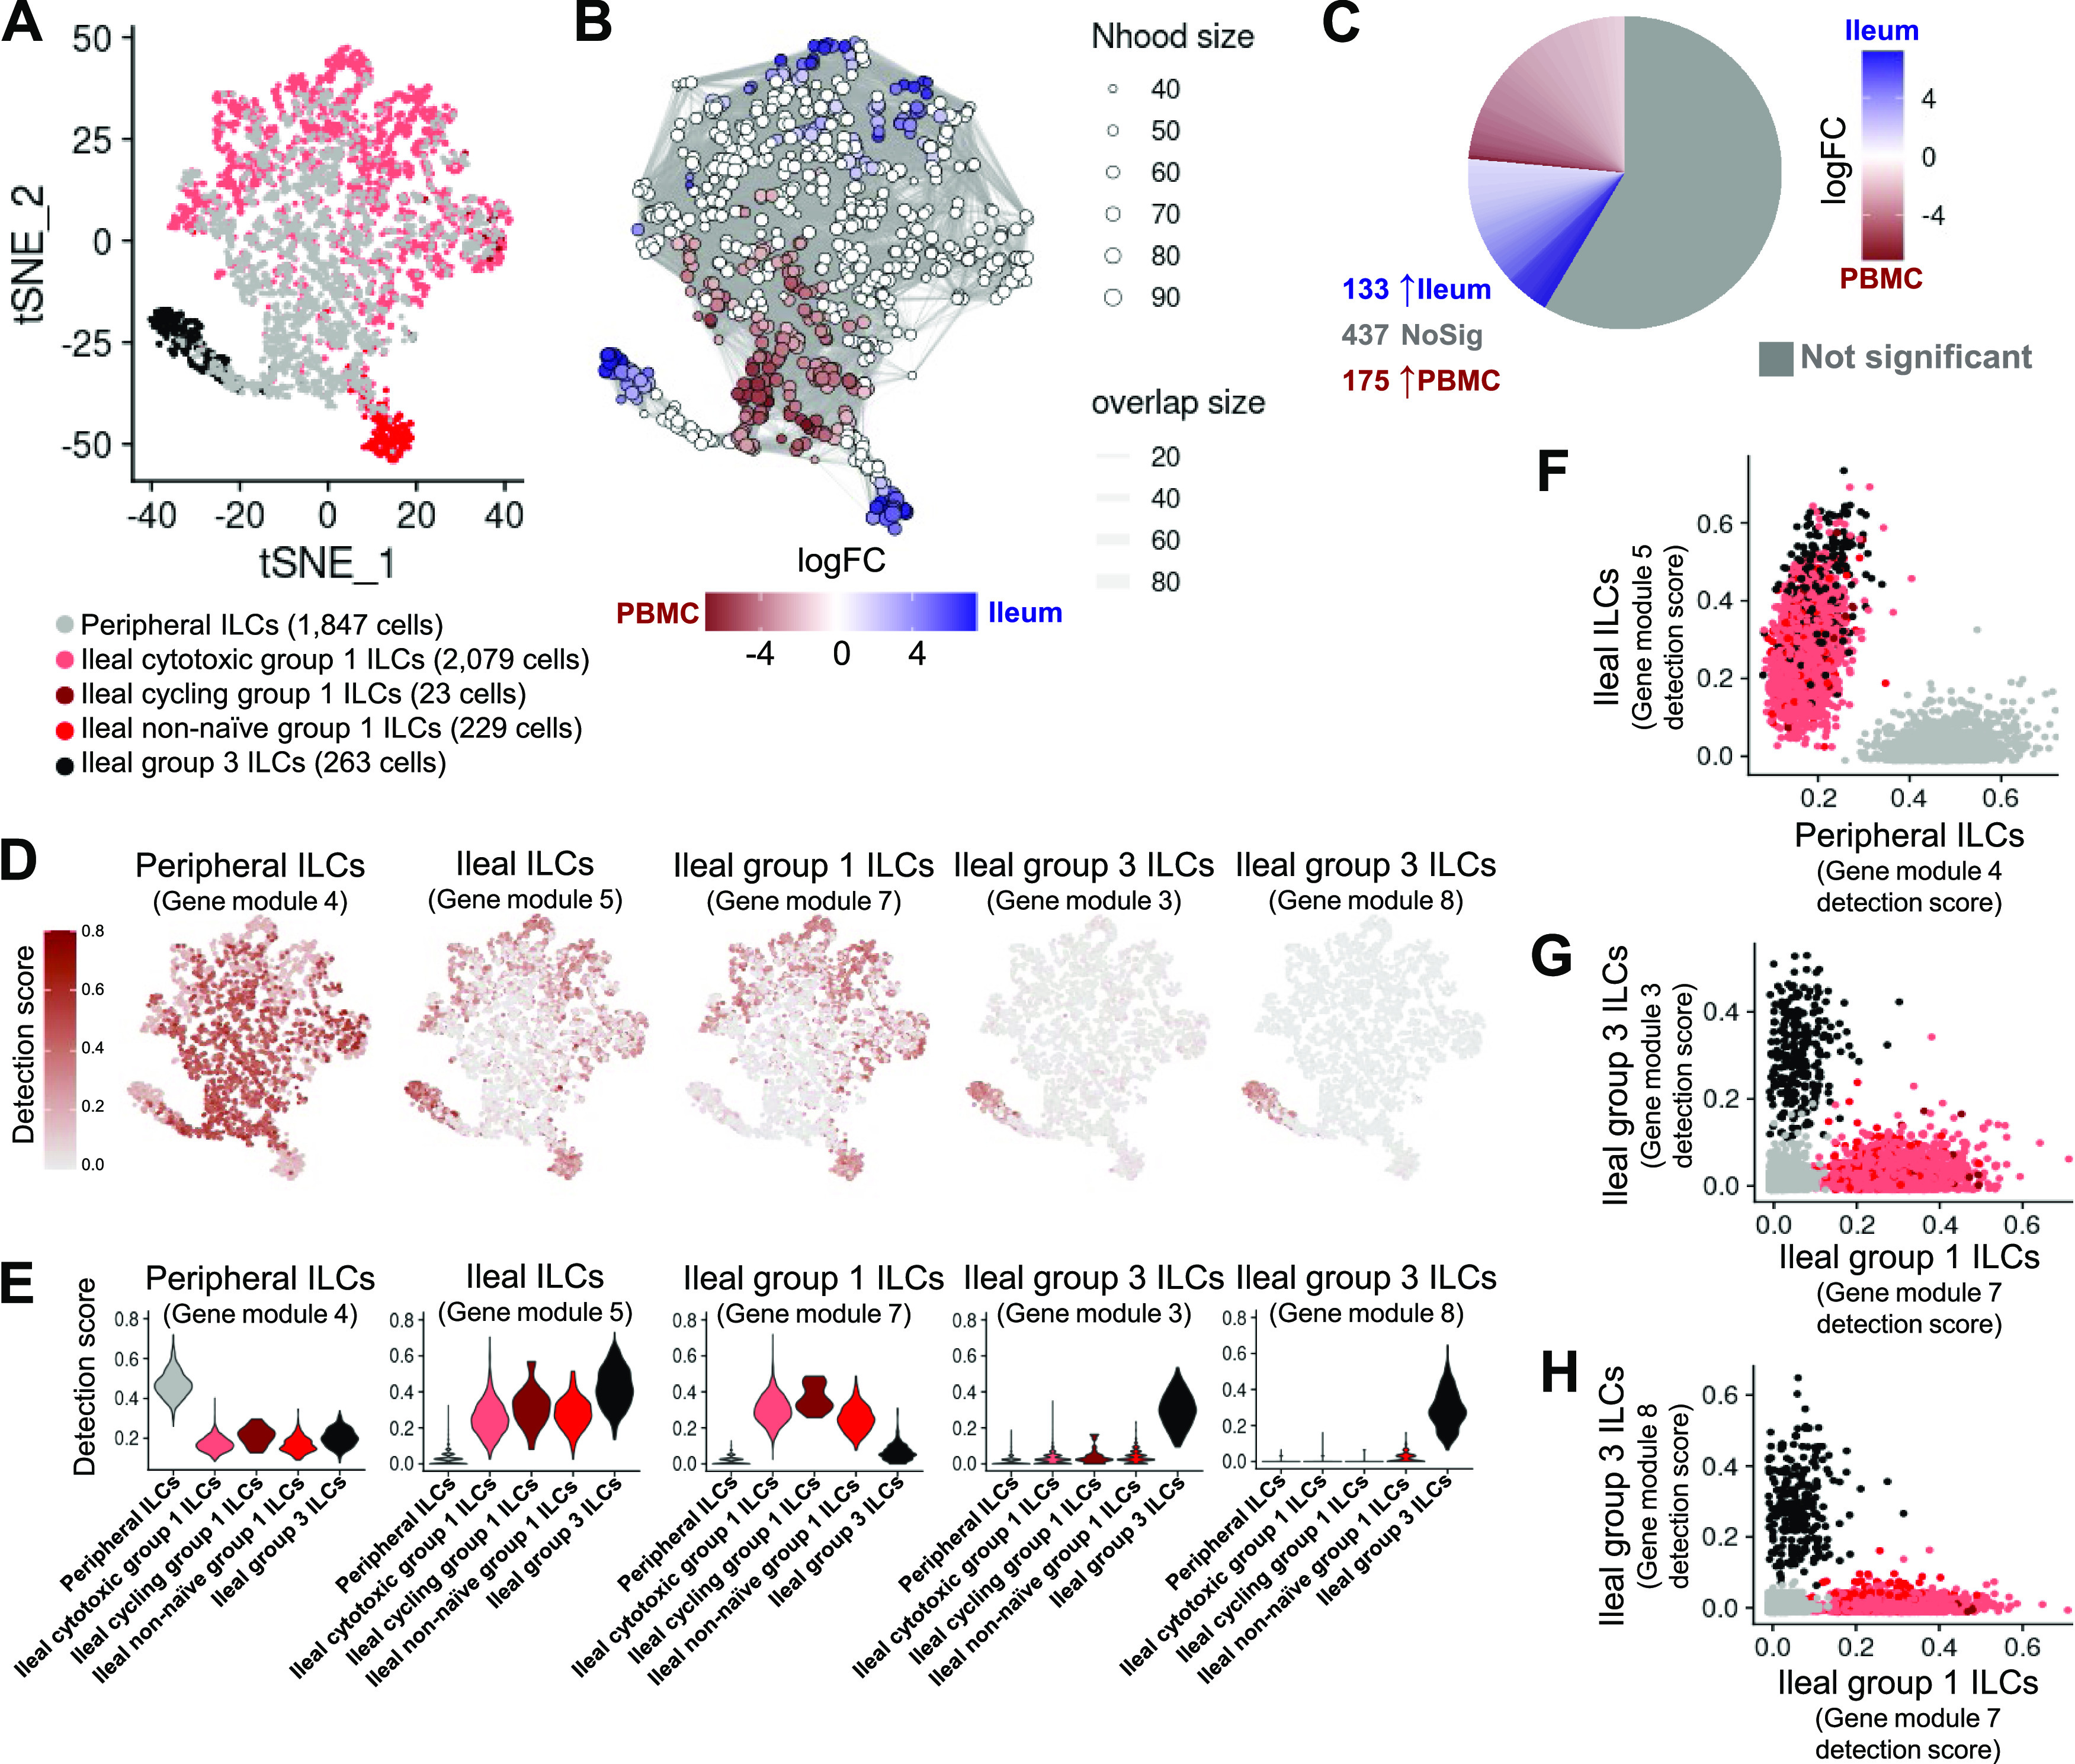
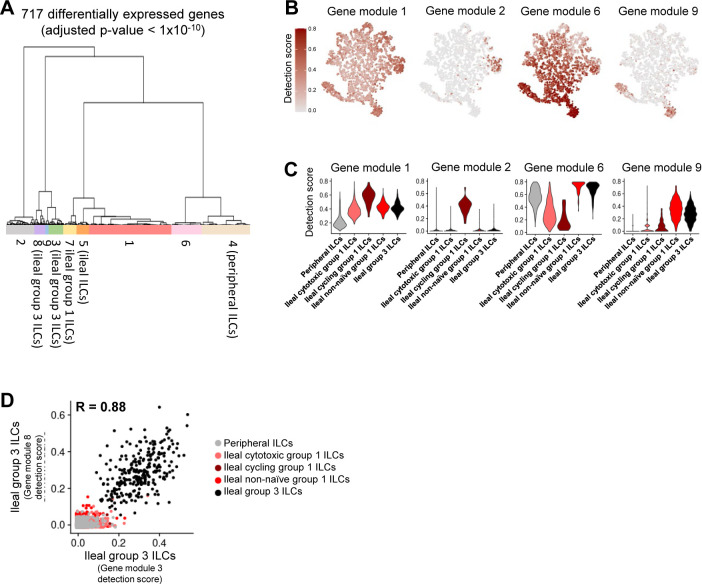
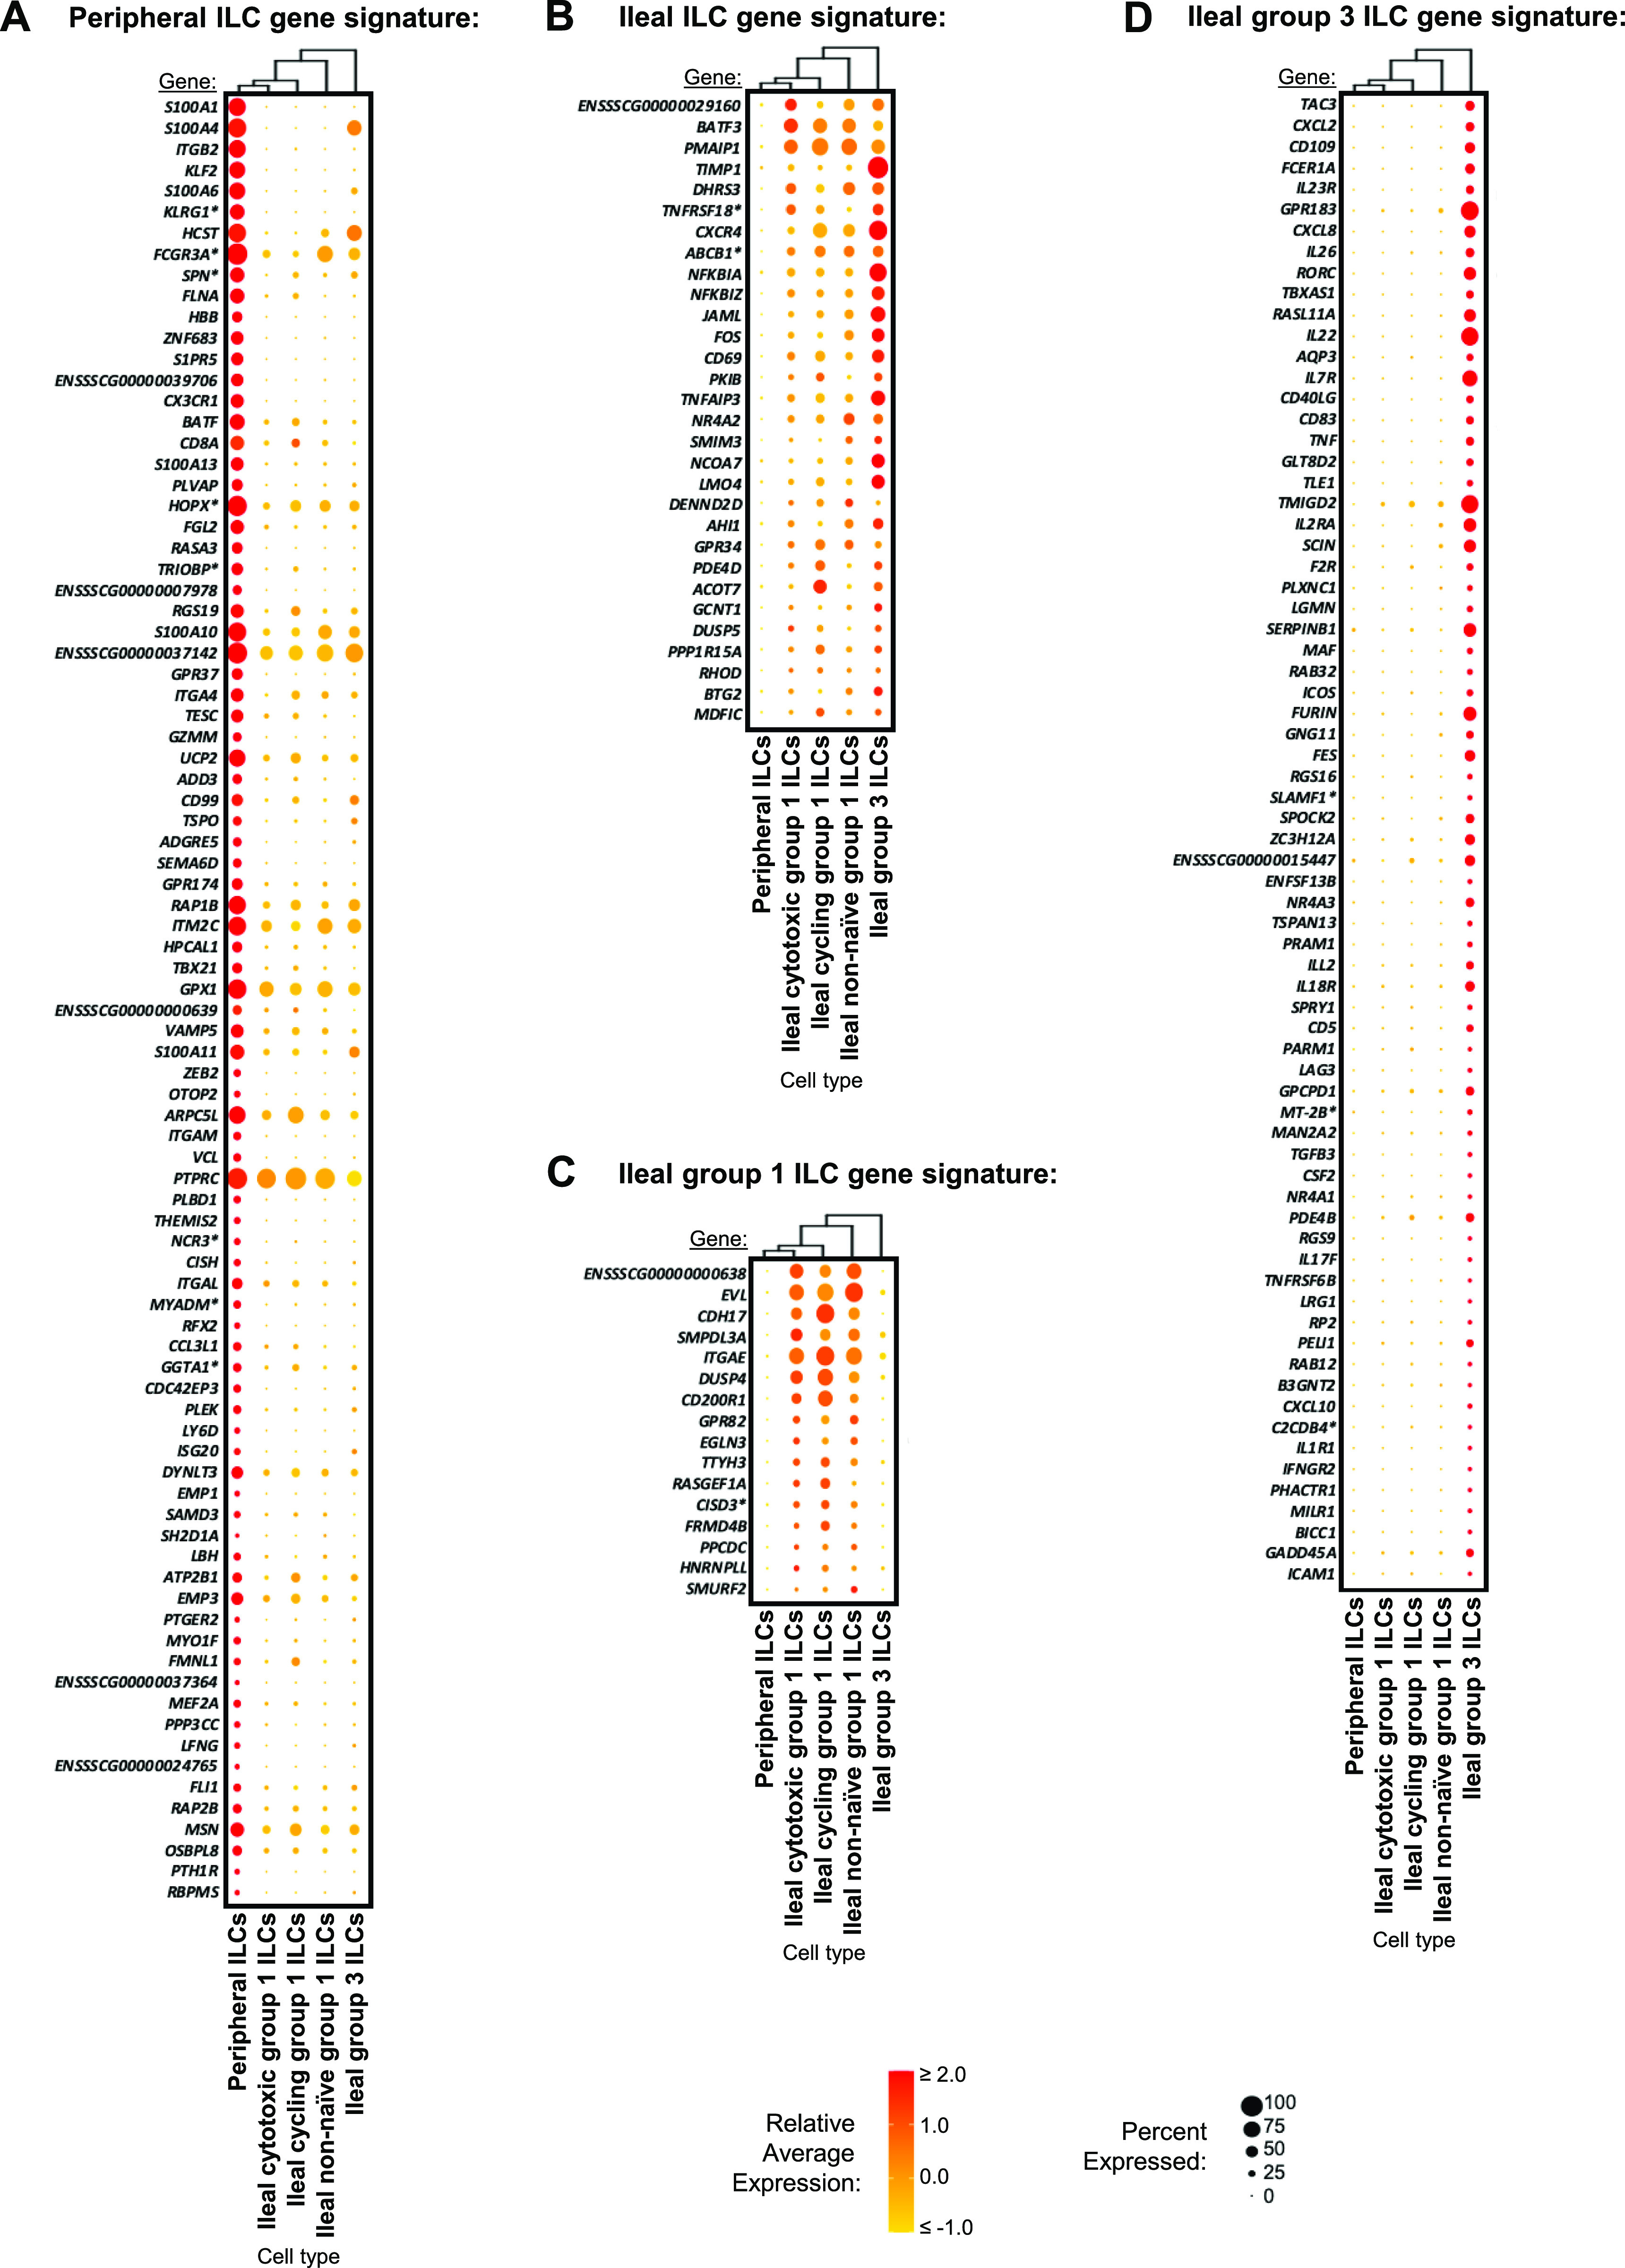
Lymphocytes can heavily influence intestinal health, but resolving intestinal lymphocyte function is challenging as the intestine contains a vastly heterogeneous mixture of cells. Pigs are an advantageous biomedical model, but deeper understanding of intestinal lymphocytes is warranted to improve model utility. Twenty-six cell types were identified in the porcine ileum by single-cell RNA sequencing and further compared with cells in human and murine ileum. Though general consensus of cell subsets across species was revealed, some porcine-specific lymphocyte subsets were identified. Differential tissue dissection and in situ analyses conferred spatial context, revealing similar locations of lymphocyte subsets in Peyer's patches and epithelium in pig-to-human comparisons. Like humans, activated and effector lymphocytes were abundant in the ileum but not periphery of pigs, suggesting tissue-specific and/or activation-associated gene expression. Gene signatures for peripheral and ileal innate lymphoid cells newly discovered in pigs were defined and highlighted similarities to human innate lymphoid cells. Overall, we reveal novel lymphocyte subsets in pigs and highlight utility of pigs for intestinal research applications.


Conflict of interest statement

The authors declare that they have no conflict of interest.

Figures

Figure 1.
Figure 1.. Experimental overview and annotation of cells recovered from scRNA-seq of the porcine ileum.
(A) Ileal samples collected from two 7-wk-old pigs for scRNA-seq. Left: representative image of tissue collection site from the ileum of the distal small intestine within the porcine gastrointestinal tract. Right: representative images of tissue dissections from transverse cross sections of the ileum. Dissections from each pig included a cross section of the whole ileum including areas with and without Peyer’s patches (whole ileum), the ileum containing only regions with Peyer’s patches (PP), and the ileum containing only regions without Peyer’s patches (non-PP), resulting in a total of six samples processed for scRNA-seq. (A) Two-dimensional t-SNE visualization of 31,983 cells isolated from porcine ileal samples described in (A), subjected to scRNA-seq, and included in the final dataset following data processing and quality filtering. Each point represents a single cell. (B, C, D) Plots show which sample cells are derived from (B) and cell lineage (C) or cell type (D) annotations. In (B), cells in individual panels are derived from a specified sample. In (C, D), the color of a cell indicates cell lineage (C) or cell type (D) annotation. (B, C, D) The number of cells belonging to each sample (B), cell lineage (C), and cell type (D) are listed next to corresponding panels. Abbreviations: ILC, innate lymphoid cell; PP, Peyer’s patch; scRNA-seq, single-cell RNA sequencing; tSNE, t-distributed stochastic neighbor embedding.
Figure S1.
Figure S1.. Histology and dissection of the porcine ileum.
(A) Transverse cross section of the ileum collected from the distal small intestine of a 7-wk-old pig used for scRNA-seq as shown in Fig 1A and stained with hemotoxylin (purple) and eosin (pink). Histological structures corresponding to tissue muscularis, Peyer’s patches, epithelium, and lamina propria are indicated. (B) Representative images of tissue dissections performed on the ileum to obtain a whole transverse cross section of the ileum (whole ileum), the ileum containing only regions with Peyer’s patches (PP), and the ileum containing only regions without Peyer’s patches (non-PP). Images shown in (B) were from a 9-wk-old pig and were not from animals used for scRNA-seq. Abbreviations: PP, Peyer’s patch; scRNA-seq, single-cell RNA sequencing.
Figure S2.
Figure S2.. Enrichment of poor-quality epithelial cells in the ileum without Peyer’s patches.
(A) Plots of two quality control metrics (genes detected per cell [y-axis] and proportion mitochondrial reads per cell [x-axis]) used to identify and filter out poor quality cells from scRNA-seq data. Each point represents a single cell. Point fill color corresponds to raw gene counts for epithelial genes EPCAM (left) and KRT8 (center) and pan-leukocyte gene PTPRC (right). Plots are shown from the whole ileum (top), PP (middle), and non-PP (bottom) samples collected from one 7-wk-old pig used for scRNA-seq. (B) Flow cytometry gating strategy to identify leukocytes (CD45+) and epithelial cells (EPCAM+) from total live cells isolated from the porcine ileum. Gating is shown for a whole-ileum sample (containing both regions with and without Peyer’s patches). (B, C) Overlay of gated leukocytes and epithelial cells from (B) onto original forward- and side-scatter coordinates to infer parameters of cell size and complexity, respectively, that are consistent with leukocytes and epithelial cells. Ratio of the number of leukocytes to the number of epithelial cells (y-axis) identified by flow cytometry gating shown in (B). Cells were isolated from three types of ileal dissections (x-axis); samples derived from different ileal dissections of the same pig are connected with a gray line. (E) IHC staining for epithelial pan-cytokeratin protein (brown) in a region of the ileum with Peyer’s patches (left) or without Peyer’s patches (right). Flow cytometry and IHC experiments were not performed on animals used for scRNA-seq. (B, C, D) Flow cytometry experiments shown in (B, C, D) were conducted using four 6-wk-old pigs. (E) IHC staining in (E) was completed on a 5-wk-old pig. Abbreviations: FSC-A, forward scatter area; FSC-H, forward scatter height; IHC, immunohistochemistry; PP, Peyer’s patch; scRNA-seq, single-cell RNA sequencing; SSC-A, side scatter area.
Figure S3.
Figure S3.. Overlay of cell type annotations onto t-SNE visualization of cells from porcine-ileum scRNA-seq data.
Overlay of 26 annotated cell types onto two-dimensional t-SNE visualization of 31,983 cells recovered from the ileum of two 7-wk-old pigs via scRNA-seq. Each point represents a single cell. Cell type is indicated in a respective panel by one of 26 colors corresponding to cell types shown in Fig 1D, whereas all other cells not corresponding to a specified cell type are shown in light gray. Abbreviations: ILC, innate lymphoid cell; scRNA-seq, single-cell RNA sequencing; t-SNE, t-distributed stochastic neighbor embedding.
Figure S4.
Figure S4.. Cell lineage annotation of cells from porcine-ileum scRNA-seq data.
(A) Two-dimensional t-SNE visualization of 31,983 cells recovered from the porcine ileum via scRNA-seq. Each point represents a single cell; color of a point corresponds to one of 54 cell clusters a cell belonged to, with more transcriptionally similar cells belonging to the same cluster. The number of cells belonging to each cluster is listed in the cluster key. (B) Gene expression patterns of selected canonical genes (y-axis) across cell clusters shown in (A) (x-axis). Within the plot, size of a dot corresponds to the percentage of cells expressing a gene within a cell cluster; color of a dot corresponds to average expression level of a gene for those cells expressing it within a cell cluster relative to all other cells in the dataset shown in (A). Below cluster ID on the x-axis, the color of a circle corresponds to cell lineage annotation given to each cluster. (C) Expression of a subset of canonical genes from (B) overlaid onto two-dimensional t-SNE visualization coordinates of cells shown in (A). Color of a point corresponds to expression level of a specified gene within a cell relative to all other cells in the dataset shown in (A). scRNA-seq data shown in (A, B, C) were derived from the ileum of two 7-wk-old pigs. *Ensembl identifiers found in gene annotation were converted to gene symbols; refer to methods section “Gene name modifications” for more details Abbreviations: ILC, innate lymphoid cell; scRNA-seq, single-cell RNA sequencing; t-SNE, t-distributed stochastic neighbor embedding.
Figure S5.
Figure S5.. Annotation of T/ILC lineage lymphocytes from porcine-ileum scRNA-seq data.
(A) Two-dimensional t-SNE visualization of 14,742 cells recovered from the porcine ileum via scRNA-seq and classified as T/ILC lineage lymphocytes in Figs 1C and S4B. Each point represents a single cell; color of a point corresponds to one of 26 cell clusters a cell belonged to, with more transcriptionally similar cells belonging to the same cell cluster. The number of cells belonging to each cell cluster is listed in the cluster key. (B) Gene expression of selected canonical genes overlaid onto two-dimensional t-SNE visualization coordinates of cells shown in (A). Color of a point corresponds to expression level of a specified gene within a cell relative to all other cells in the dataset shown in (A). (C) Gene expression patterns of selected canonical genes (y-axis) across cell clusters shown in (A) (x-axis). Within the plot, size of a dot corresponds to the percentage of cells expressing a gene within a cell cluster. Color of a dot corresponds to average expression level of a gene for those cells expressing it within a cell cluster relative to other cells in the dataset shown in (A). Below cluster ID on the x-axis, the color of a circle corresponds to a further T/ILC classification given to each cell cluster. (D) Radial plots showing the percentage of cells expressing CD4, CD8B, or TRDC within each respective cell cluster shown in (A). Shaded gray triangles at the center of each plot indicate the minimum limit of positive detection (10%), whereas the outer limits of each plot are equivalent to 100%. T/ILC classification given to each cluster based on the percentage of cells positive for each gene are shown by plot color and outline. Two-dimensional t-SNE visualization of cells shown in (A), where color of a point now corresponds to T/ILC classification given to a cell cluster in (C, D). (F) Heatmap of top differentially expressed genes within each cell cluster shown in (A). Up to five differentially expressed genes with the highest positive logFC values were selected for each cell cluster. Genes were differentially expressed in a specified cluster relative to the average of all other cells in the dataset shown in (A). Gene expression profiles from up to 100 cells of each cluster are shown in the heatmap. Each column represents a single cell. Selected gene names are shown on the y-axis, and cell cluster IDs are shown on the x-axis. (C, D, E) T/ILC classification given to each cluster in (C, D, E) is indicated below each cell cluster ID on the x-axis. Hierarchical relationships of cell clusters are shown using a phylogenetic tree at the top of the heatmap. scRNA-seq data shown in (A, B, C, D, E, F) were derived from the ileum of two 7-wk-old pigs. *Ensembl identifiers found in gene annotation were converted to gene symbols; refer to methods section “Gene name modifications” for more details. Abbreviations: ILC, innate lymphoid cell; logFC, log fold-change; scRNA-seq, single-cell RNA sequencing; t-SNE, t-distributed stochastic neighbor embedding.
Figure S6.
Figure S6.. Annotation of CD4 αβ T cells from porcine-ileum scRNA-seq data.
(A) Two-dimensional t-SNE visualization of 2,668 cells recovered from the porcine ileum via scRNA-seq and classified as CD4 αβ T cells in Fig S5C–F. Each point represents a single cell; color of a point corresponds to one of five cell clusters a cell belonged to, with more transcriptionally similar cells belonging to the same cell cluster. The number of cells belonging to each cell cluster is listed in the cluster key. (B) Heatmap of top differentially expressed genes within each cell cluster shown in (A). Up to five differentially expressed genes with the highest positive logFC values were selected for each cell cluster. Genes were differentially expressed in a specified cluster relative to the average of all other cells in the dataset shown in (A). Gene expression profiles from up to 100 cells of each cell cluster are shown in the heatmap, with each column representing a single cell. Selected gene names are shown on the y-axis, and cell cluster IDs are shown on the x-axis. Hierarchical relationships of cell clusters are shown using a phylogenetic tree at the top of the heatmap. (C) Topic weights from topic modeling of cells shown in (A) overlaid onto two-dimensional t-SNE visualization coordinates. Color of a point corresponds to proportional weighting of a topic within a cell, where total weighting across all topics in each cell is equal to one. (D) Gene module detection scores from multidimensional differential gene expression analysis of cells shown in (A) overlaid onto two-dimensional t-SNE visualization coordinates. Color of a point corresponds to detection score for a gene module within a cell. (E) Scatter plot of gene module 2 detection scores (y-axis) versus topic 3 weights (x-axis) for all cells shown in (A). Each point represents a single cell. Cells with a gene module 2 detection score >0.1 and/or topic 3 weight >0.4 are shown in red and were annotated as cycling cells. Remaining cells are shown in black and were classified as non-cycling cells. (F) Scatter plots of gene module 3 detection scores (y-axis) versus topic 2 weights (x-axis) for all non-cycling cells shown in (E). Each point represents a single cell. Left: point fill corresponds to topic 1 weights. Right: cells with a gene module 3 detection score >0.3 and/or topic 2 weight > topic 1 weight are shown in red and annotated as follicular cells. Remaining cells are shown in black and annotated as activated cells. (G) CD4 αβ T cell annotations established in (B, C, D, E, F) overlaid onto two-dimensional t-SNE visualization coordinates of cells shown in (A). Color of a point corresponds to cell type annotation. The number of cells belonging to each cell type is listed in the key on the right. (H) Overlay of individual cell types onto two-dimensional t-SNE visualization shown in (G). Cell type is indicated in a respective panel by one of three colors corresponding to cell types shown in (G), whereas all other cells not corresponding to a specified cell type are shown in light gray. scRNA-seq data shown in (A, B, C, D, E, F, G, H) were derived from the ileum of two 7-wk-old pigs. *Ensembl identifiers found in gene annotation were converted to gene symbols; refer to methods section “Gene name modifications” for more details. Abbreviations: logFC, log fold-change; scRNA-seq, single-cell RNA sequencing; t-SNE, t-distributed stochastic neighbor embedding.
Figure S7.
Figure S7.. Annotation of γδ and CD8 αβ T cells from porcine-ileum scRNA-seq data.
(A) Two-dimensional t-SNE visualization of 8,905 cells recovered from the porcine ileum via scRNA-seq and classified as γδ T cells, CD8 αβ T cells, or mixed γδ/CD8 αβ T cells in Fig S5C–F. Each point represents a single cell; color of a point corresponds to one of 15 cell clusters a cell belongs to, with more transcriptionally similar cells belonging to the same cell cluster. The number of cells belonging to each cell cluster is listed in the cluster key. (B) Heatmap of top differentially expressed genes within each cell cluster shown in (A). Up to five differentially expressed genes with the highest positive logFC values were selected for each cell cluster. Genes were differentially expressed in a specified cell cluster relative to the average of all other cells in the dataset shown in (A). Gene expression profiles from up to 100 cells of each cluster are shown in the heatmap, with each column representing a single cell. Selected gene names are shown on the y-axis, and cell cluster IDs are shown on the x-axis. Hierarchical relationships of cell clusters are shown using a phylogenetic tree at the top of the heatmap. At the bottom of the heatmap, cells in cluster 31 were annotated as CD2 γδ T cells, and cells in cluster 51 were annotated as SELLhi γδ T cells. (C) Topic weights from topic modeling of cells shown in (A) overlaid onto two-dimensional t-SNE visualization coordinates. Color of a point corresponds to proportional weighting of a topic within a cell, where total weighting across all topics in each cell is equal to one. (D) Gene module detection scores from multidimensional differential gene expression analysis of cells shown in (A) overlaid onto two-dimensional t-SNE visualization coordinates. Color of a point corresponds to detection score for a gene module within a cell. (E) Scatter plot of gene module 3 detection scores (y-axis) versus topic 3 weights (x-axis) for all cells shown in (A), excluding CD2 γδ T cells (cell cluster 31) and SELLhi γδ T cells (cell cluster 51). Each point represents a single cell. Cells with a gene module 3 detection score >0.11 and/or topic 3 weight >0.41 are shown in red and annotated as cycling cells. Remaining cells are shown in black and classified as non-cycling cells. (F) Scatter plots of gene module 1 detection scores (y-axis) versus topic 1 weights (x-axis) for all non-cycling cells shown in (E). Each point represents a single cell. Upper: point fill corresponds to topic 2 weights. Lower: cells with a gene module 1 detection score >0.25 and/or topic 1 weight at least 4× greater than topic 2 weight are shown in red and classified as activated cells. Remaining cells are shown in black and classified as cytotoxic cells. (G) Relative gene expression levels of CD8B (left), TRDC (right), and merged CD8B and TRDC overlaid onto two-dimensional t-SNE visualization coordinates shown in (A). (H) Scatter plot of ratios of log-normalized CD8B/TRDC (y-axis) and TRDC/CD8B (x-axis) counts for all cells shown in (E). Each point represents a single cell. Cells with a TRDC/CD8B ratio >1 are shown in red and classified as γδ T cells. Remaining cells are shown in black and classified as CD8 αβ T cells. (I) γδ and CD8 αβ T cell annotations established from combined classifications in (B, C, D, E, F, G, H) overlaid onto two-dimensional t-SNE visualization coordinates of cells shown in (A). Color of a point corresponds to cell type annotation. The number of cells belonging to each cell type is listed in the color key on the bottom. (J) Overlay of individual cell types onto two-dimensional t-SNE visualization shown in (I). Cell type is indicated in a respective panel by one of eight colors corresponding to cell types shown in (I), whereas all other cells not corresponding to a specified cell type are shown in light gray. scRNA-seq data shown in (A, B, C, D, E, F, G, H, I, J) were derived from the ileum of two 7-wk-old pigs. *Ensembl identifiers found in gene annotation were converted to gene symbols; refer to methods section “Gene name modifications” for more details Abbreviations: logFC, log fold-change; scRNA-seq, single-cell RNA sequencing; t-SNE, t-distributed stochastic neighbor embedding.
Figure S8.
Figure S8.. Annotation of ILCs from porcine-ileum scRNA-seq data.
(A) Two-dimensional t-SNE visualization of 2,594 cells recovered from the porcine ileum via scRNA-seq and classified as ILCs in Fig S5C–F. Each point represents a single cell; color of a point corresponds to one of five cell clusters a cell belongs to, with more transcriptionally similar cells belonging to the same cell cluster. The number of cells belonging to each cell cluster is listed in the cluster key. (B) Heatmap of top differentially expressed genes within each cell cluster shown in (A). Up to five differentially expressed genes with the highest positive logFC values were selected for each cell cluster. Genes were differentially expressed in a specified cell cluster relative to the average of all other cells in the dataset shown in (A). Gene expression profiles from up to 100 cells of each cell cluster are shown in the heatmap, with each column representing a single cell. Selected gene names are shown on the y-axis, and cell cluster IDs are shown on the x-axis. Hierarchical relationships of cell clusters are shown using a phylogenetic tree at the top of the heatmap. At the bottom of the heatmap, cluster 53 was annotated as cycling group 1 ILCs. (C) Topic weights from topic modeling of cells shown in (A) overlaid onto two-dimensional t-SNE visualization coordinates. Color of a point corresponds to proportional weighting of a topic within a cell, where total weighting across all topics in each cell is equal to one. (D) Gene module detection scores from multidimensional differential gene expression analysis of cells shown in (A) overlaid onto two-dimensional t-SNE visualization coordinates. Color of a point corresponds to detection score for a gene module within a cell. (E) Scatter plots of gene module 3 detection scores (y-axis) versus topic 1 weights (x-axis) for all cells shown in (A). Each point represents a single cell. Left: point fill corresponds to gene module 1 detection score. Right: cells belonging to cluster 43 are shown in red and were annotated as group 3 ILCs. Remaining cells are shown in black and classified as group 1 ILCs. (F) Scatter plots of gene module 2 detection scores (y-axis) versus topic 3 weights (x-axis) for cells belonging to cell clusters 1, 18, or 44 in (A, B). Each point represents a single cell. Upper: point fill corresponds to topic 2 weights. Lower: cells with a topic 3 weight <0.05 and gene module 2 detection scores >0.4 or topic 2 weights >0.9 are shown in red and annotated as activated cells. Remaining cells are shown in black and annotated as cytotoxic cells. (G) ILC annotations established in (B, C, D, E, F) overlaid onto two-dimensional t-SNE visualization coordinates of cells shown in (A). Color of a point corresponds to cell type annotation. The number of cells belonging to each cell type is listed in the color key on the bottom. (H) Overlay of individual cell types onto two-dimensional t-SNE visualization shown in (G). Cell type is indicated in a respective panel by one of four colors corresponding to cell types shown in (G), whereas all other cells not corresponding to a specified cell type are shown in light gray. scRNA-seq data shown in (A, B, C, D, E, F, G, H) were derived from the ileum of two 7-wk-old pigs. *Ensembl identifiers found in gene annotation were converted to gene symbols; refer to methods section “Gene name modifications” for more details. Abbreviations: ILC, innate lymphoid cell; logFC, log fold-change; scRNA-seq, single-cell RNA sequencing; t-SNE, t-distributed stochastic neighbor embedding.
Figure S9.
Figure S9.. Annotation of B lineage lymphocytes from porcine-ileum scRNA-seq data.
(A) Two-dimensional t-SNE visualization of 16,070 cells recovered from the porcine ileum via scRNA-seq and classified as B lineage lymphocytes in Figs 1C and S4B. Each point represents a single cell; color of a point corresponds to one of 22 cell clusters a cell belongs to, with more transcriptionally similar cells belonging to the same cell cluster. The number of cells belonging to each cell cluster is listed in the cluster key. (B) Heatmap of top differentially expressed genes within each cell cluster shown in (A). Up to five differentially expressed genes with the highest positive logFC values were selected for each cell cluster. Genes were differentially expressed in a specified cell cluster relative to the average of all other cells in the dataset shown in (A). Gene expression profiles from up to 100 cells of each cell cluster are shown in the heatmap, with each column representing a single cell. Selected gene names are shown on the y-axis, and cell cluster IDs are shown on the x-axis. Hierarchical relationships of clusters are shown using a phylogenetic tree at the top of the heatmap. At the bottom of the heatmap, cluster 33 was annotated as transitioning B cells, cluster 25 as antibody-secreting cells, and clusters 9, 13, and 30 as resting B cells. (C) Topic weights from topic modeling of cells shown in (A) overlaid onto two-dimensional t-SNE visualization coordinates. Color of a point corresponds to proportional weighting of a topic within a cell, where total weighting across all topics in each cell is equal to one. (D) Gene module detection scores from multidimensional differential gene expression analysis of cells shown in (A) overlaid onto two-dimensional t-SNE visualization coordinates. Color of a point corresponds to detection score for a gene module within a cell. (E) Scatter plots of gene module 3 detection scores (y-axis) versus topic 2 weights (x-axis) for all cells shown in (A), excluding resting B cells (clusters 9, 13, 20), transitioning B cells (cluster 33), and antibody-secreting cells (cluster 25). Each point represents a single cell. Cells with gene module 3 detection scores >0.06 and/or topic 2 weights >0.32 are shown in red and annotated as cycling cells. Remaining cells are shown in black and annotated as activated cells. (F) B lineage lymphocyte annotations established in (B, C, D, E) overlaid onto two-dimensional t-SNE visualization coordinates of cells shown in (A). Cell type is indicated in a respective panel by one of five colors corresponding to annotated cell types, whereas all other cells not corresponding to a specified cell type are shown in light gray. scRNA-seq data shown in (A, B, C, D, E, F) were derived from the ileum of two 7-wk-old pigs. *Ensembl identifiers found in gene annotation were converted to gene symbols; refer to methods section “Gene name modifications” for more details. Abbreviations: logFC, log fold-change; scRNA-seq, single-cell RNA sequencing; t-SNE, t-distributed stochastic neighbor embedding.
Figure S10.
Figure S10.. Annotation of non-lymphocytes from porcine-ileum scRNA-seq data.
(A) Two-dimensional t-SNE visualization of 458 cells recovered from the porcine ileum via scRNA-seq and classified as myeloid lineage leukocytes in Figs 1C and S4B. Each point represents a single cell; color of a point corresponds to one of three cell clusters a cell belongs to, with more transcriptionally similar cells belonging to the same cell cluster. The number of cells belonging to each cell cluster is listed in the cluster key. (B) Heatmap of top differentially expressed genes within each cell cluster shown in (A). Up to five differentially expressed genes with the highest positive logFC values were selected for each cell cluster. Genes were differentially expressed in a specified cell cluster relative to the average of all other cells in the dataset shown in (A). Gene expression profiles from up to 100 cells of each cell cluster are shown in the heatmap, with each column representing a single cell. Selected gene names are shown on the y-axis, and cell cluster IDs are shown on the x-axis. Hierarchical relationships of cell clusters are shown using a phylogenetic tree at the top of the heatmap. (C) Myeloid lineage leukocyte annotations established from cell clusters in (B) overlaid onto two-dimensional t-SNE visualization coordinates of cells shown in (A). Color of a point corresponds to cell type annotation. The number of cells belonging to each cell type is listed in the color key below. (D) Overlay of individual cell types onto two-dimensional t-SNE visualization shown in (C). Cell type is indicated in a respective panel by one of three colors corresponding to cell types shown in (C), whereas all other cells not corresponding to a specified cell type are shown in light gray. (E) Two-dimensional t-SNE visualization of 713 cells recovered from the porcine ileum via scRNA-seq and classified as non-leukocytes in Figs 1C and S4B. Each point represents a single cell; color of a point corresponds to one of three cell clusters a cell belonged to, with more transcriptionally similar cells belonging to the same cell cluster. The number of cells belonging to each cell cluster is listed in the cluster key. (F) Heatmap of top differentially expressed genes within each cell cluster shown in (E). Up to five differentially expressed genes with the highest positive logFC values were selected for each cell cluster. Genes were differentially expressed in a specified cell cluster relative to the average of all other cells in the dataset shown in (E). Gene expression profiles from up to 100 cells of each cell cluster are shown in the heatmap, with each column representing a single cell. Gene names are shown on the y-axis, and cell cluster IDs are shown on the x-axis. Hierarchical relationships of cell clusters are shown using a phylogenetic tree at the top of the heatmap. (G) Non-leukocyte annotations established from cell clusters in (F) overlaid onto two-dimensional t-SNE visualization coordinates of cells shown in (E). Color of a point corresponds to cell type annotation. The number of cells belonging to each cell type is listed in the color key below. (H) Overlay of individual cell types onto two-dimensional t-SNE visualization shown in (G). Cell type is indicated in a respective panel by one of three colors corresponding to cell types shown in (G), whereas all other cells not corresponding to a specified cell type are shown in light gray. scRNA-seq data shown in (A, B, C, D, E, F, G, H) were derived from the ileum of two 7-wk-old pigs. *Ensembl identifiers found in gene annotation were converted to gene symbols; refer to methods section “Gene name modifications” for more details. Abbreviations: logFC, log fold-change; scRNA-seq, single-cell RNA sequencing; t-SNE, t-distributed stochastic neighbor embedding.
Figure S11.
Figure S11.. Mapping scores of porcine ileal cells to reference scRNA-seq datasets.
Mapping scores from mapping of porcine-ileum scRNA-seq query data to reference scRNA-seq datasets of porcine PBMCs (left), human ileum (center), and murine ileum (right) overlaid onto two-dimensional t-SNE visualization of porcine-ileum scRNA-seq data shown in Fig 1C and D. Each point represents a single cell; the color of each point indicates mapping score to a corresponding reference dataset. Higher mapping scores indicate better representation of a cell from the porcine ileum in a specified reference dataset. Query scRNA-seq data were derived from the ileum of two 7-wk-old pigs. Abbreviations: PBMC, peripheral blood mononuclear cell; scRNA-seq, single-cell RNA sequencing; t-SNE, t-distributed stochastic neighbor embedding.
Figure S12.
Figure S12.. Prediction scores of porcine ileal cells to annotated cell types in reference scRNA-seq datasets.
(A, B, C) Prediction probabilities for porcine-ileum scRNA-seq query data from label transfer of annotated cell types in reference scRNA-seq datasets of (A) porcine PBMCs, (B) human ileum, and (C) murine ileum overlaid onto two-dimensional t-SNE visualization of porcine-ileum scRNA-seq data shown in Fig 1C and D. Each point represents a single cell; the color of each point indicates prediction probability to a corresponding cell type annotation from a specified reference dataset. Cell lineage of each annotated reference cell type is indicated by a circle next to each respective annotated cell type name. Within each of (A, B, C), cumulative prediction probabilities for each cell across all annotated reference cell types are equal to one. Query scRNA-seq data were derived from the ileum of two 7-wk-old pigs. † Identical cell type annotations were given to cells in both the porcine ileum and a reference scRNA-seq dataset. Cell type annotations were given to each dataset by independent rationales, and identical annotations do not necessarily indicate identical cell types were recovered from both porcine-ileum and reference data. Abbreviations: ASC, antibody-secreting cell; c1, cluster 1; c2, cluster 2; cDC, convnentional dendritic cell; DC, dendritic cell; DN, double-negative; DZ, dark zone; GC, germinal center; ILC, innate lymphoid cell; LTi, lymphoid tissue inducer; LZ, light zone; PBMC, peripheral blood mononuclear cell; pDC, plasmacytoid dendritic cell; NK, natural killer; NKT, natural killer T; scRNA-seq, single-cell RNA sequencing; t-SNE, t-distributed stochastic neighbor embedding; TA, transit amplifying; TFH, T follicular helper; Treg, T regulatory.
Figure 2.
Figure 2.. scRNA-seq profiles of T/ILC lineage lymphocytes in the porcine ileum.
(A) Two-dimensional t-SNE visualization of 14,742 cells recovered from the porcine ileum via scRNA-seq that were classified as T/ILC lineage lymphocytes in Figs 1C and S4B and further annotated into 16 cell types in Figs 1D and S5–S8. Each point represents a single cell; the color of each point indicates cell types shown in Fig 1D. (B) Hierarchical relationship of T/ILC lineage lymphocyte cell types from the porcine ileum shown in a dendrogram (upper) and expression patterns of selected genes within each cell type shown in a dot plot (lower). In the dot plot, selected genes are listed on the y-axis, and cell types are listed on the x-axis. Within the dot plot, size of a dot corresponds to the percentage of cells expressing a gene within an annotated cell type; color of a dot corresponds to average expression level of a gene for those cells expressing it within a cell type relative to all other cells in the dataset shown in (A). (C) Box plots of the distribution of mapping scores for T/ILC lineage lymphocyte cell types from the porcine ileum mapped to each reference scRNA-seq dataset. Results for a single cell type are located within a single box, with color of the box corresponding to colors used for cell types in (A). The color of each box in a plot corresponds to the reference dataset porcine ileal cells were mapped to, including porcine PBMCs (light gray), human ileum (medium gray), and murine ileum (black). Boxes span the interquartile range (IQR) of the data (25th and 75th percentiles), with the median (50th percentile) indicated by a horizontal line. Whiskers span the 5th and 95th percentiles of the data. A red dot represents the data mean. (D) Prediction probabilities for porcine-ileum scRNA-seq query data from label transfer of selected annotated T/ILC types in reference scRNA-seq datasets of porcine PBMCs (left), human ileum (middle), and murine ileum (right) overlaid onto two-dimensional t-SNE visualization shown in (A). Each point represents a single cell; the color of each point indicates prediction probability to a corresponding cell type from reference data, as indicated directly above each t-SNE plot. A higher prediction probability indicates higher similarity to a specified annotated cell type in a reference scRNA-seq dataset. scRNA-seq data shown in (A, B, C, D) were derived from the ileum of two 7-wk-old pigs. *Ensembl identifiers found in gene annotation were converted to gene symbols; refer to methods section “Gene name modifications” for more details. † Identical cell type annotations were given to cells in both the porcine ileum and a reference scRNA-seq dataset. Cell type annotations were given to each dataset by independent rationales, and identical annotations do not necessarily indicate identical cell types were recovered from both porcine-ileum and reference data. Abbreviations: ILC, innate lymphoid cell; IQR, interquartile range; LTi, lymphoid tissue inducer; NK, natural killer; NKT, natural killer T; PBMC, peripheral blood mononuclear cell; scRNA-seq, single-cell RNA sequencing; t-SNE, t-distributed stochastic neighbor embedding; TFH, T follicular helper; Treg, T regulatory.
Figure S13.
Figure S13.. Overlay of T/ILC annotations onto t-SNE visualization of cells from porcine-ileum scRNA-seq data.
Overlay of 16 annotated T/ILC types onto two-dimensional t-SNE visualization of 14,742 cells recovered from the ileum of two 7-wk-old pigs via scRNA-seq and classified as T/ILC lineage lymphocytes in Figs 1C and S4B. Each point represents a single cell. Cell type is indicated in a respective panel by one of 16 colors corresponding to cell types shown in Fig 2A, whereas all other cells not corresponding to a specified cell type are shown in light gray. Abbreviations: ILC, innate lymphoid cell; scRNA-seq, single-cell RNA sequencing; t-SNE, t-distributed stochastic neighbor embedding.
Figure S14.
Figure S14.. Overlay of mapping scores onto t-SNE reduction of T/ILC lineage lymphocytes from porcine-ileum scRNA-seq data.
Mapping scores from mapping of porcine ileum scRNA-seq query data to reference scRNA-seq datasets of porcine PBMCs (left), human ileum (center), and murine ileum (right). Mapping scores are the same as shown in Fig S11 but are now shown only for T/ILC lineage lymphocytes overlaid onto two-dimensional t-SNE visualization of porcine-ileum scRNA-seq data shown in Fig 2A. Each point represents a single cell; the color of each point indicates mapping score to a corresponding reference dataset. Higher mapping scores indicate better representation of a cell from the porcine ileum in a specified reference dataset. Query scRNA-seq data were derived from the ileum of two 7-wk-old pigs. Abbreviations: ILC, innate lymphoid cell; PBMC, peripheral blood mononuclear cell; scRNA-seq, single-cell RNA sequencing; t-SNE, t-distributed stochastic neighbor embedding.
Figure S15.
Figure S15.. Prediction of porcine ileal T/ILC lineage lymphocytes to annotated cell types in porcine PBMCs.
Box plots of the distribution of prediction probabilities (y-axes) for T/ILC lineage lymphocyte cell types from the porcine ileum (represented by individual box plots) with labels transferred to annotated cell types of a porcine PBMC scRNA-seq reference dataset (x-axes and box plot color). Boxes span the interquartile range (IQR) of the data (25th and 75th percentiles), with the median (50th percentile) indicated by a horizontal line. Whiskers span the 5th and 95th percentiles of the data. A red dot represents the data mean. Query scRNA-seq data were derived from the ileum of two 7-wk-old pigs. † Identical cell type annotations were given to cells in both the porcine ileum and a reference scRNA-seq dataset. Cell type annotations were given to each dataset by independent rationales, and identical annotations do not necessarily indicate identical cell types were recovered from both porcine-ileum and reference data. Abbreviations: ASC, antibody-secreting cell; cDC, conventional dendritic cell; ILC, innate lymphoid cell; IQR, interquartile range; NK, natural killer; PBMC, peripheral blood mononuclear cell; pDC, plasmacytoid dendritic cell; scRNA-seq, single-cell RNA sequencing.
Figure S16.
Figure S16.. Prediction of porcine ileal T/ILC lineage lymphocytes to annotated cell types in the human ileum.
Box plots of the distribution of prediction probabilities (y-axes) for T/ILC lineage lymphocyte cell types from the porcine ileum (represented by individual box plots) with labels transferred to annotated cell types of a human ileum scRNA-seq reference dataset (x-axes and box plot color). Boxes span the interquartile range (IQR) of the data (25th and 75th percentiles), with the median (50th percentile) indicated by a horizontal line. Whiskers span the 5th and 95th percentiles of the data. A red dot represents the data mean. Query scRNA-seq data were derived from the ileum of two 7-wk-old pigs. † Identical cell type annotations were given to cells in both the porcine ileum and a reference scRNA-seq dataset. Cell type annotations were given to each dataset by independent rationales, and identical annotations do not necessarily indicate identical cell types were recovered from both porcine-ileum and reference data. Abbreviations: cDC, convnentional dendritic cell; DC, dendritic cell; ILC, innate lymphoid cell; IQR, interquartile range; pDC, plasmacytoid dendritic cell; NK, natural killer; scRNA-seq, single-cell RNA sequencing; TA, transit amplifying; TFH, T follicular helper; Treg, T regulatory.
Figure S17.
Figure S17.. Prediction of porcine ileal T/ILC lineage lymphocytes to annotated cell types in the murine ileum.
Box plots of the distribution of prediction probabilities (y-axes) for T/ILC lineage lymphocyte cell types from the porcine ileum (represented by individual box plots) with labels transferred to annotated cell types of a murine-ileum scRNA-seq reference dataset (x-axes and box plot color). Boxes span the interquartile range (IQR) of the data (25th and 75th percentiles), with the median (50th percentile) indicated by a horizontal line. Whiskers span the 5th and 95th percentiles of the data. A red dot represents the data mean. Query scRNA-seq data were derived from the ileum of two 7-wk-old pigs. † Identical cell type annotations were given to cells in both porcine ileum and a reference scRNA-seq dataset. Cell type annotations were given to each dataset by independent rationales, and identical annotations do not necessarily indicate identical cell types were recovered from both porcine-ileum and reference data. Abbreviations: c1, cluster 1; c2, cluster 2; DC, dendritic cell; DN, double-negative; DZ, dark zone; GC, germinal center; ILC, innate lymphoid cell; IQR, interquartile range; LTi, lymphoid tissue inducer; LZ, light zone; pDC, plasmacytoid dendritic cell; NK, natural killer; NKT, natural killer T; scRNA-seq, single-cell RNA sequencing; TA, transit amplifying; TFH, T follicular helper; Treg, T regulatory.
Figure 3.
Figure 3.. scRNA-seq profiles of B lineage lymphocytes in the porcine ileum.
(A) Two-dimensional t-SNE visualization of 16,070 cells recovered from the porcine ileum via scRNA-seq that were classified as B lineage lymphocytes in Figs 1C and S4B and further annotated into five cell types in Figs 1D and S9. Each point represents a single cell; the color of each point indicates cell types shown in Fig 1D. (B) Hierarchical relationship of B lineage lymphocyte cell types from the porcine ileum shown in a dendrogram (left), and expression patterns of selected genes within each cell type shown in a dot plot (right). In the dot plot, selected genes are listed on the x-axis, and cell types are listed on the y-axis. Within the dot plot, size of a dot corresponds to the percentage of cells expressing a gene within an annotated cell type; color of a dot corresponds to average expression level of a gene for those cells expressing it within a cell type relative to all other cells in the dataset shown in (A). (C) Box plots of the distribution of mapping scores for B lineage lymphocyte cell types from the porcine ileum mapped to each reference scRNA-seq dataset. Results for a single cell type are located within a single box, with color of the box corresponding to colors used for cell types in (A). The color of each box in a plot corresponds to the reference dataset porcine ileal cells were mapped to, including porcine PBMCs (light gray), human ileum (medium gray), and murine ileum (black). Boxes span the interquartile range (IQR) of the data (25th and 75th percentiles), with the median (50th percentile) indicated by a horizontal line. Whiskers span the 5th and 95th percentiles of the data. A red dot represents the data mean. (D) Prediction probabilities for porcine-ileum scRNA-seq query data from label transfer of selected annotated B/antibody-secreting cell types in reference scRNA-seq datasets of porcine PBMCs (left), human ileum (middle), and murine ileum (right) overlaid onto two-dimensional t-SNE visualization shown in (A). Each point represents a single cell; the color of each point indicates prediction probability to a corresponding cell type from reference data, as indicated directly above each t-SNE plot. A higher prediction probability indicates higher similarity to a specified annotated cell type in a reference scRNA-seq dataset. scRNA-seq data shown in (A, B, C, D) were derived from ileum of two 7-wk-old pigs. *Ensembl identifiers found in gene annotation were converted to gene symbols; refer to methods section “Gene name modifications” for more details. † Identical cell type annotations were given to cells in both porcine ileum and a reference scRNA-seq dataset. Cell type annotations were given to each dataset by independent rationales, and identical annotations do not necessarily indicate identical cell types were recovered from both porcine-ileum and reference data. Abbreviations: DZ, dark zone; GC, germinal center; IQR, interquartile range; LZ, light zone; PBMC, peripheral blood mononuclear cell; scRNA-seq, single-cell RNA sequencing; t-SNE, t-distributed stochastic neighbor embedding.
Figure S18.
Figure S18.. Overlay of mapping scores onto t-SNE reduction of B lineage lymphocytes from porcine-ileum scRNA-seq data.
Mapping scores from mapping of porcine-ileum scRNA-seq query data to reference scRNA-seq datasets of porcine PBMCs (left), human ileum (center), and murine ileum (right). Mapping scores are the same as shown in Fig S11 but are now shown only for B lineage lymphocytes overlaid onto two-dimensional t-SNE visualization of porcine-ileum scRNA-seq data shown in Fig 3A. Each point represents a single cell; the color of each point indicates mapping score to a corresponding reference dataset. Higher mapping scores indicate better representation of a cell from the porcine ileum in a specified reference dataset. Query scRNA-seq data were derived from the ileum of two 7-wk-old pigs. Abbreviations: PBMC, peripheral blood mononuclear cell; scRNA-seq, single-cell RNA sequencing; t-SNE, t-distributed stochastic neighbor embedding.
Figure S19.
Figure S19.. Prediction of porcine ileal B lineage lymphocytes to annotated cell types in porcine PBMCs.
Box plots of the distribution of prediction probabilities (y-axes) for B lineage lymphocyte cell types from the porcine ileum (represented by individual box plots) with labels transferred to annotated cell types of a porcine PBMC scRNA-seq reference dataset (x-axes and box plot color). Boxes span the interquartile range (IQR) of the data (25th and 75th percentiles), with the median (50th percentile) indicated by a horizontal line. Whiskers span the 5th and 95th percentiles of the data. A red dot represents the data mean. Query scRNA-seq data were derived from the ileum of two 7-wk-old pigs. † Identical cell type annotations were given to cells in both the porcine ileum and a reference scRNA-seq dataset. Cell type annotations were given to each dataset by independent rationales, and identical annotations do not necessarily indicate identical cell types were recovered from both porcine-ileum and reference data. Abbreviations: ASC, antibody-secreting cell; cDC, conventional dendritic cell; IQR, interquartile range; NK, natural killer; PBMC, peripheral blood mononuclear cell; pDC, plasmacytoid dendritic cell; scRNA-seq, single-cell RNA sequencing.
Figure S20.
Figure S20.. Prediction of porcine ileal B lineage lymphocytes to annotated cell types in the human ileum.
Box plots of the distribution of prediction probabilities (y-axes) for B lineage lymphocyte cell types from the porcine ileum (represented by individual box plots) with labels transferred to annotated cell types of a human-ileum scRNA-seq reference dataset (x-axes and box plot color). Boxes span the interquartile range (IQR) of the data (25th and 75th percentiles), with the median (50th percentile) indicated by a horizontal line. Whiskers span the 5th and 95th percentiles of the data. A red dot represents the data mean. Query scRNA-seq data were derived from the ileum of two 7-wk-old pigs. † Identical cell type annotations were given to cells in both the porcine ileum and a reference scRNA-seq dataset. Cell type annotations were given to each dataset by independent rationales, and identical annotations do not necessarily indicate identical cell types were recovered from both porcine-ileum and reference data. Abbreviations: cDC, convnentional dendritic cell; DC, dendritic cell; IQR, interquartile range; pDC, plasmacytoid dendritic cell; NK, natural killer; scRNA-seq, single-cell RNA sequencing; TA, transit amplifying; TFH, T follicular helper; Treg, T regulatory.
Figure S21.
Figure S21.. Prediction of porcine ileal B lineage lymphocytes to annotated cell types in the murine ileum.
Box plots of the distribution of prediction probabilities (y-axes) for B lineage lymphocyte cell types from the porcine ileum (represented by individual box plots) with labels transferred to annotated cell types of a murine-ileum scRNA-seq reference dataset (x-axes and box plot color). Boxes span the interquartile range (IQR) of the data (25th and 75th percentiles), with the median (50th percentile) indicated by a horizontal line. Whiskers span the 5th and 95th percentiles of the data. A red dot represents the data mean. Query scRNA-seq data were derived from the ileum of two 7-wk-old pigs. † Identical cell type annotations were given to cells in both the porcine ileum and a reference scRNA-seq dataset. Cell type annotations were given to each dataset by independent rationales, and identical annotations do not necessarily indicate identical cell types were recovered from both porcine-ileum and reference data. Abbreviations: c1, cluster 1; c2, cluster 2; DC, dendritic cell; DN, double-negative; DZ, dark zone; GC, germinal center; ILC, innate lymphoid cell; IQR, interquartile range; LTi, lymphoid tissue inducer; LZ, light zone; pDC, plasmacytoid dendritic cell; NK, natural killer; NKT, natural killer T; scRNA-seq, single-cell RNA sequencing; TA, transit amplifying; TFH, T follicular helper; Treg, T regulatory.
Figure S22.
Figure S22.. Comparison of sample types from scRNA-seq of the porcine ileum.
(A) Multidimensional scaling (MDS) plot of pseudobulk samples from six porcine ileal samples subjected to scRNA-seq. Pseudobulk samples are comprised of the cumulative gene counts from all reads/cells of each sample before quality control filtering (top) and in the final filtered dataset (bottom). (B) Stacked bar plot of annotated cell type frequencies (x-axis) within each porcine-ileal sample and total cells (y-axis) subjected to scRNA-seq. Bar size is indicative of total frequency (1) within each sample and is not indicative of the number of cells in each sample. (C) Stacked bar plot of sample frequencies (y-axis) within each annotated porcine ileal cell type and total cells (x-axis) recovered via scRNA-seq. Bar size is indicative of total frequency (1) within each cell type and is not indicative of the number of cells in each cell type. scRNA-seq data shown in (A, B, C) were derived from the ileum of two 7-wk-old pigs. Abbreviations: dim, dimension; ILC, innate lymphoid cell; logFC, log fold-change; MDS, multidimensional scaling; PP, Peyer’s patch; scRNA-seq, single-cell RNA sequencing.
Figure 4.
Figure 4.. Compositional differences in lymphocytes from the ileum with or without Peyer’s patches.
(A) Cell compositions of scRNA-seq data from the whole ileum (top), PP (middle), and non-PP (bottom) samples. Cells from each sample type (depicted on the far left) were combined from a total of two animals and overlaid onto t-SNE coordinates originally presented in Fig 1B–D. The total numbers of cells derived from the total of two animals for each sample type are listed on the far left. On the t-SNE plots, each point represents a single cell; the color of each point corresponds to cell lineage (left t-SNE), cell type (center t-SNE), or cell density (right t-SNE). (B) Pie charts showing proportions of cells from each annotated cell lineage within total cells derived from each sample type in (A). The color of a pie slice indicates cell lineage. The total area of each pie chart is not proportional to the total number of cells derived from each sample type. Proportions were calculated from total cells derived from two pigs for each sample type. (C) Plot of the percentage of B cells (CD79α+) within total leukocytes (CD45+; y-axis) from samples of the whole ileum, PP, and non-PP (x-axis), as assessed by flow cytometry gating shown in Fig S23A. Measurements from different sample types derived from the same animal are connected by a light gray line. (D) IHC staining for B cell CD79α protein (brown) in a region of the ileum with Peyer’s patches (left) or without Peyer’s patches (right). (E) Plot of the percentage of T cells (CD3ε+) within total leukocytes (CD45+; y-axis) from samples of the whole ileum, PP, and non-PP (x-axis), as assessed by flow cytometry gating shown in Fig S23A. Measurements from different sample types derived from the same animal are connected by a light gray line. (F) IHC staining for T cell CD3ε protein (brown) in a region of the ileum with Peyer’s patches (left) or without Peyer’s patches (right). (G) Plot of the percentage of CD4 αβ T cells (left), CD8 αβ T cells (center), or γδ T cells (right) within total T cells (y-axis) of the porcine-ileum scRNA-seq dataset. Percentages from samples of the whole ileum, PP, and non-PP are shown on the x-axis. CD4 αβ T cells included cells annotated as follicular CD4 αβ T cells, non-naive CD4 αβ T cells, or cycling CD4 αβ T cells and cells annotated as naive CD4/CD8 αβ T cells with prediction probability to porcine PBMC CD4+ αβ T cells > prediction probability to porcine PBMC CD8 αβ+ αβ T cells. CD8 αβ T cells included cells annotated as non-naive CD8 αβ T cells, cytotoxic CD8 αβ T cells, or cycling CD8 αβ T cells and cells annotated as naive CD4/CD8 αβ T cells with prediction probability to porcine PBMC CD8αβ+ αβ T cells > prediction probability to porcine PBMC CD4+ αβ T cells. γδ T cells included cells annotated as non-naive γδ T cells, cytotoxic γδ T cells, cycling γδ T cells, SELLhi γδ T cells, and CD2 γδ T cells. Measurements from different sample types derived from the same animal are connected by a light gray line. (H) Plot of the percentage of CD4 αβ T cells (γδTCRCD4+; left), CD8 αβ T cells (γδTCRCD8β+; center), or γδ T cells (γδTCR+; right) within total T cells (CD3ε+; y-axis) from samples of the whole ileum, PP, and non-PP (x-axis), as assessed by flow cytometry gating shown in Fig S23B. Measurements from different sample types derived from the same animal are connected by a light gray line. (I) RNA ISH staining for TRDC (top, red), CD8B (bottom, green), or CD4 (bottom, red) transcripts in regions of the ileum with Peyer’s patches (left) or regions of the ileum without Peyer’s patches (right). (J) Differential abundance analysis of cell types from porcine-ileum scRNA-seq PP versus non-PP samples. Annotated cell types are listed on the y-axis. Each point represents an individual cell neighborhood, where a neighborhood was assigned as a specific cell type if >70% of cells within the neighborhood belonged to the specified cell type annotation. Cell neighborhoods with <70% of cells belonging to a single cell type are not shown. Gray points indicate cell neighborhoods that were not significantly more abundant in a specific sample type. Non-gray points indicate cell neighborhoods exhibiting differential abundance (P < 0.1), and red/blue fill of differentially abundant points corresponds to the magnitude and direction of logFC (also corresponding to values listed on the x-axis). Red indicates increased abundance in PP samples, whereas blue indicates increased abundance in non-PP samples. On the far right, counts of cell neighborhoods with increased abundance in PP samples/no differential abundance/increased abundance in non-PP samples are shown for each cell type. Cycling γδ T cells and cycling group 1 ILCs are not shown on the y-axis because of no cell neighborhoods being assigned to these cell types. scRNA-seq data shown in (A, B, G, J) were derived from the ileum of two 7-wk-old pigs. (I) Images shown in (I) were also taken from a 7-wk-old pig used for ileum scRNA-seq. Flow cytometry and IHC experiments were not performed on animals used for scRNA-seq. Flow cytometry experiments shown in (C, E) were conducted using four 6-wk-old pigs. Flow cytometry data shown in (H) was performed using five 9-wk-old pigs. IHC staining in (D) and (F) was completed on 6-wk-old pigs. Abbreviations: IHC, immunohistochemistry; ILC, innate lymphoid cell; ISH, in situ hybridization; logFC, log fold-change; NoSig, no significance; PBMC, peripheral blood mononuclear cell; PP, Peyer’s patch; scRNA-seq, single-cell RNA sequencing; t-SNE, t-distributed stochastic neighbor embedding; TCR, T cell receptor.
Figure S23.
Figure S23.. Validation of scRNA-seq lymphocyte compositions via flow cytometry.
(A) Flow cytometry gating strategy used to identify percentages of T cells (CD3ε+) and B cells (CD79α+) from total viable CD45+ leukocytes within porcine ileal samples. Gating is shown for the same whole-ileum sample (containing both regions with and without Peyer’s patches) shown in Fig S2B, starting from the parent population of cells captured and gated as leukocytes in Fig S2B. (B) Flow cytometry gating strategy used to identify percentages of CD4 αβ T cells (γδTCRCD4+), CD8 αβ T cells (γδTCRCD8β+), or γδ T cells (γδTCR+) within total viable CD3ε+ T cells of porcine ileal samples. Gating is shown for a whole-ileum sample (containing both regions with and without Peyer’s patches). (C) Plot of the percentage of CD4 αβ T cells (γδTCRCD4+; left), CD8 αβ T cells (γδTCRCD8β+; center), or γδ T cells (γδTCR+; right) within total T cells (CD3ε+; y-axis) from PP (upper) and non-PP (lower) samples. Within each sample, cells were collected from epithelial, subepithelial, and merged (containing epithelial and subepithelial cell fractions; same as shown in Fig 4H) cell fractions (x-axes) and assessed by the flow cytometry gating strategy in (B). Measurements from different cell fractions derived from the same animal are connected by a light gray line. Flow cytometry experiments were not performed on animals used for scRNA-seq and were instead performed on four 6-wk-old pigs in (A) and five 9-wk-old pigs in (B, C). Abbreviations: FSC-A, forward scatter area; FSC-H, forward scatter height; PP, Peyer’s patch; scRNA-seq, single-cell RNA sequencing; SSC-A, side scatter area; TCR, T cell receptor.
Figure S24.
Figure S24.. Differential abundance analysis of the porcine ileum with versus without Peyer’s patches.
(A) Cell neighborhoods identified by differential abundance analysis. Only cells derived from PP and non-PP samples were included in differential abundance analysis but were overlaid back onto their original t-SNE coordinates of the full dataset that included whole-ileum samples, shown in Fig 1C and D. Size of a circle indicates the number of cells in a neighborhood (Nhood size); color of a circle indicates magnitude of logFC in abundance in non-PP (blue) versus PP (red) samples; width of lines between cell neighborhoods indicates the number of overlapping cells found in each of two neighborhoods (overlap size). (B) Pie chart of differential abundance results for cell neighborhoods shown in (A). Gray indicates the proportion of cell neighborhood that was not differentially abundant, whereas cell neighborhoods with significantly increased abundance (P < 0.01) in non-PP or PP samples are shown in blue and red, respectively. The logFC magnitude of differential abundance is also shown by red or blue shading. (C) Plot similar to that shown for differential abundance analysis in Fig 5J but for all mixed cell neighborhoods that were not assigned as a specific cell type because of having <70% of cells belonging to a single cell type annotation. Each point represents an individual cell neighborhood. Gray points indicate cell neighborhoods that were not significantly more abundant in a specific sample type. Non-gray points indicate cell neighborhoods exhibiting differential abundance (P < 0.1). Red/blue fill of differentially abundant points corresponds to the magnitude and direction of logFC. Red indicates increased abundance in PP samples, whereas blue indicates increased abundance in non-PP samples. On the far right, counts of cell neighborhoods with increased abundance in PP samples/no differential abundance/increased abundance in non-PP samples are shown for each cell type. scRNA-seq data shown in (A, B, C) were derived from the ileum of two 7-wk-old pigs. Abbreviations: logFC, log fold-change; Nhood, neighborhood; NoPP, Peyer’s patch; No Sig, no significance; t-SNE, t-distributed stochastic neighbor embedding.
Figure S25.
Figure S25.. Gene expression profiles of group 1 and group 3 ILCs in the porcine ileum.
(A) Overlay onto two-dimensional t-SNE visualization shown in Fig 1C and D of cells annotated as ILCs (activated group 1 ILCs, cytotoxic group 1 ILCs, cycling group 1 ILCs, or group 3 ILCs; shown in black) in porcine-ileum scRNA-seq data. All cells not annotated as ILCs (non-ILCs) are shown in light gray. Each point represents a single cell. (B) Expression of a subset of canonical genes used to identify group 1 and group 3 ILCs in porcine-ileum scRNA-seq data, overlaid onto two-dimensional t-SNE visualization coordinates of cells shown in (A). Color of a point corresponds to the expression level of a specified gene within a cell relative to all other cells in the dataset shown in (A). Regions on the t-SNE plot with concentrations of ILCs are indicated by red circles. (C) Gene expression patterns of canonical genes shown in (B) (x-axis) across annotated cell types in porcine-ileum scRNA-seq data (x-axis). Within the plot, size of a dot corresponds to the percentage of cells expressing a gene within an annotated cell type; color of a dot corresponds to average expression level of a gene for those cells expressing it within an annotated cell type relative to all other cells in the dataset shown in (A). scRNA-seq data shown in (A, B, C) were derived from the ileum of two 7-wk-old pigs. *Ensembl identifiers found in gene annotation were converted to gene symbols; refer to methods section “Gene name modifications” for more details. Abbreviations: ILC, innate lymphoid cell; scRNA-seq, singe-cell RNA sequencing; t-SNE, t-distributed stochastic neighbor embedding.
Figure 5.
Figure 5.. Ex vivo and in situ identification of ILCs in the porcine ileum.
(A) Flow cytometry gating strategy used to identify CD2+Lin (Lin = CD172αCD3εCD79α) within total viable cells of porcine ileal samples. (C) Gating is shown for a whole-ileum sample (containing both regions with and without Peyer’s patches) for pig A (corresponding to pig IDs in (C)). (B) Flow cytometry forward- and side-scatter plots of total viable cells (left) and CD2+Lin cells (right) within a sample of the porcine whole ileum shown in (A). A gate identifying cells with scatter profiles consistent with lymphocytes is shown, with percentages of cells within the lymphocyte gate listed in the top right of each plot. (C) Histogram of the percentage of CD45+ cells within CD2+Lin cells identified from samples of the porcine ileum using the flow cytometry gating strategy shown in (A). A fluorescence-minus-one (FMO) sample lacking α-CD45 antibody staining was used as a negative control. (D) Dual fluorescent staining of CD3ε protein and ITGAE RNA in villi (epithelium + lamina propria) of the porcine ileum. Left column: overlay of all stains, including CD3ε protein (green), ITGAE RNA (magenta), and nuclei (DAPI staining; blue). Additional columns show individual stain overlays in white, including (from left to right) nuclei, CD3ε protein, and ITGAE RNA. Panels of two separate villi are shown in each row. Panels were selected from larger stitched images as shown in Fig S26A. Yellow arrows indicate location of ITGAE+CD3ε cells. (E) Dual fluorescent staining of CD3ε protein and IL22 RNA in lamina propria/GALT of the porcine ileum. Left column: overlay of all stains, including CD3ε protein (green), IL22 RNA (magenta), and nuclei (DAPI staining; blue). Additional columns show individual stain overlays in white, including (from left to right) nuclei, CD3ε protein, and IL22 RNA. Panels of four separate tissue locations are shown in each row. Panels were selected from larger stitched images as shown in Fig S26B. Yellow arrows indicate location of IL22+CD3ε cells. Orange arrows indicate location of IL22+CD3ε+ cells. Flow cytometry experiments shown in (A, B, C) were conducted using three 6-wk-old pigs. Dual IF/ISH experiments shown in (D, E) were conducted using a 7-wk-old pig used for ileum scRNA-seq. Abbreviations: FMO, fluorescence-minus-one; FSC-A, forward scatter area; FSC-H, forward scatter height; GALT, gut-associated lymphoid tissue; IF, immunofluorescence; ISH, in situ hybridization; ILC, innate lymphoid cell; scRNA-seq, single-cell RNA sequencing; SSC-A, side scatter area.
Figure S26.
Figure S26.. Microscopy images of in situ ILC detection.
(A, B) Confocal images for in situ detection of group 1 ILCs (A) and group 3 ILCs (B) in the porcine ileum. Individual image frames were acquired at 60× magnification and stitched together. In both (A) and (B), the upper left image shows overlay of all stains together, including nuclei (DAPI staining; blue), CD3ε protein (green), and RNA for ITGAE (A) or IL22 (B) shown in magenta. The upper right image shows only nuclei staining (white); the lower left image shows only CD3ε protein staining (white); the lower right image shows only ITGAE (A) or IL22 (B) RNA staining (white). All images in (A) and all images in (B) show the same captured frames. Yellow boxes indicate tissue areas shown at higher magnification in Fig 5D and E. Number of a box in the upper left panels corresponds to the frame number shown in Fig 5D and E. Dual IF/ISH experiments shown in (A, B) were conducted using a 7-wk-old pig used for ileum scRNA-seq. Abbreviations: IF, immunofluorescence; ILC, innate lymphoid cell; ISH, in situ hybridization.
Figure S27.
Figure S27.. Identification of peripheral ILCs from porcine PBMC scRNA-seq data.
(A) Two-dimensional t-SNE visualization of porcine PBMCs subjected to scRNA-seq and included in a final dataset following data processing and quality filtering. Each point represents a single cell. Plots show whether cells were derived from pig 1 (6,223 cells; left) or pig 2 (6,548 cells; right). (B) Two-dimensional t-SNE visualization of 12,771 porcine PBMCs (combined cells from pig 1 and pig 2 shown in (A)). Each point represents a single cell; color of a point corresponds to one of 35 cell clusters a cell belongs to, with more transcriptionally similar cells belonging to the same cell cluster. The number of cells belonging to each cell cluster is listed in the cluster key. (C) Expression of a subset of canonical genes used to identify ILCs overlaid onto two-dimensional t-SNE visualization coordinates of cells shown in (B). Color of a point corresponds to expression level of a specified gene within a cell relative to all other cells in the dataset shown in (A). (D) Hierarchical relationship of cell clusters in porcine PBMCs shown in a dendrogram (left) and dot plot showing gene expression patterns within each cell cluster shown in (B) (right). In the dot plot, gene expression patterns of canonical genes used to identify ILCs (x-axis) across cell clusters shown in (B) are on the y-axis. Within the plot, size of a dot corresponds to the percentage of cells expressing a gene within a cell cluster; color of a dot corresponds to average expression level of a gene for those cells expressing it within a cell cluster relative to all other cells in the dataset shown in (B). A blue box is drawn around clusters identified as ILCs. (E) Overlay onto two-dimensional t-SNE visualization shown in (B) of cells annotated as ILCs (black; cell clusters p0, p4, p26, p28, and p30) in (D). All cells not annotated as ILCs (non-ILCs) are shown in light gray. Each point represents a single cell. scRNA-seq data shown in (A, B, C, D, E) were derived from PBMCs of two 7-wk-old pigs. Ileum and PBMC samples for scRNA-seq were collected from the same two pigs and processed in parallel. *Ensembl identifiers found in gene annotation were converted to gene symbols; refer to methods section “Gene name modifications” for more details. Abbreviations: ILC, innate lymphoid cell; PBMC, peripheral blood mononuclear cell; scRNA-seq, single-cell RNA sequencing; t-SNE, t-distributed stochastic neighbor embedding.
Figure 6.
Figure 6.. Peripheral ILCs are transcriptionally distinct from ileal ILCs.
(A) Two-dimensional t-SNE visualization of 4,441 cells recovered from the porcine ileum (2,594 cells) and porcine PBMCs (1,847 cells) via scRNA-seq and classified as ILCs in Figs S5C–F and S27D and E. Each point represents a single cell; color of a point corresponds to one of five ILC annotations. The number of cells belonging to each cell type is listed in the color key below. Derivation from the ileum or PBMC scRNA-seq samples for annotated ILC types is indicated in the annotation name. (B) Cell neighborhoods identified by differential abundance analysis between cells derived from the ileum and PBMCs as shown in (A), overlaid onto t-SNE coordinates also shown in (A). Size of a circle indicates the number of cells in a neighborhood (Nhood size); color of a circle indicates magnitude of logFC in abundance in the ileum (blue) versus PBMCs (red); width of lines between cell neighborhoods indicates the number of overlapping cells found in each of two neighborhoods (overlap size). (C) Pie chart of differential abundance results for cell neighborhoods shown in (B). Gray indicates the proportion of cell neighborhoods that were not differentially abundant, whereas cell neighborhoods with significantly increased abundance (P < 0.01) in the ileum or PBMC samples are shown in blue and red, respectively. The logFC magnitude of differential abundance is also shown by red or blue shading. (D) Selected gene module detection scores from multidimensional differential gene expression analysis of cells shown in (A) overlaid onto two-dimensional t-SNE visualization coordinates. Color of a point corresponds to detection score for a gene module within a cell. (E) Violin plots summarizing gene module detections scores shown in (D) (y-axis) across annotated ILC types shown in (A) (x-axis). (F) Scatter plot of gene module 5 detection scores (y-axis) versus gene module 4 detection scores (x-axis) for all cells shown in (A). Each point represents a single cell; color of a point corresponds to cell type annotations shown in (A). (G) Scatter plot of gene module 3 detection scores (y-axis) versus gene module 7 detection scores (x-axis) for all cells shown in (A). Each point represents a single cell; color of a point corresponds to cell type annotations shown in (A). (H) Scatter plot of gene module 8 detection scores (y-axis) versus gene module 7 detection scores (x-axis) for all cells shown in (A). Each point represents a single cell; color of a point corresponds to cell type annotations shown in (A). scRNA-seq data shown in (A, B, C, D, E, F, G, H) were derived from the ileum and PBMCs of two 7-wk-old pigs. Ileum and PBMC samples for scRNA-seq were collected from the same two pigs and processed in parallel. Abbreviations: ILC, innate lymphoid cell; logFC, log fold-change; Nhood, neighborhood; No Sig, no significance; PBMC, peripheral blood mononuclear cell; scRNA-seq, single-cell RNA sequencing; t-SNE, t-distributed stochastic neighbor embedding.
Figure S28.
Figure S28.. Gene module detection in ILCs from porcine-ileum and PBMC scRNA-seq data.
(A) Dendrogram of the top differentially expressed genes (P < 1 × 10⁻¹⁰) recovered through multidimensional differential gene expression analysis. Based on the dendrogram, genes were grouped into nine gene modules, as indicated at the bottom of the dendrogram. (B) Selected gene module detection scores from multidimensional differential gene expression analysis of cells shown in Fig 6A overlaid onto two-dimensional t-SNE visualization coordinates. Color of a point corresponds to detection score for a gene module within a cell. (C) Violin plots summarizing gene module detections scores shown in (B) (y-axis) across annotated ILC types shown in Fig 6A (x-axis). (D) Scatter plot of gene module 8 detection scores (y-axis) versus gene module 3 detection scores (x-axis) for all cells shown in Fig 6A. Each point represents a single cell; color of a point corresponds to cell type annotations shown in Fig 6A. Correlation value (R) is shown at the top of the plot. scRNA-seq data shown in (A, B, C, D) were derived from the ileum and PBMCs of two 7-wk-old pigs. Ileum and PBMC samples for scRNA-seq were collected from the same two pigs and processed in parallel. Abbreviations: ILC, innate lymphoid cell; PBMC, peripheral blood mononuclear cell; scRNA-seq, single-cell RNA sequencing; t-SNE, t-distributed stochastic neighbor embedding.
Figure 7.
Figure 7.. Core gene signatures of ileal and peripheral ILCs.
(A, B, C, D) Dot plots showing expression patterns within each annotated ILC type for selected genes from gene module 4 used to create a peripheral ILC gene signature (A), gene module 5 used to create an ileal ILC gene signature (B), gene module 7 used to create an ileal group 1 ILC gene signature (C), and gene modules 3 and 8 used to create an ileal group 3 ILC gene signature (D). Genes are shown on the y-axis, and annotated ILC types from the porcine ileum and PBMCs are shown on the x-axis. Within the dot plot, size of a dot corresponds to the percentage of cells expressing a gene within an annotated cell type; color of a dot corresponds to average expression level of a gene for those cells expressing it within a cell type relative to all other cells in the dataset shown in Fig 6A. Hierarchical relationships of annotated ILC types are shown with a dendrogram on the top of each dot plot. scRNA-seq data shown in (A, B, C, D) were derived from the ileum and PBMCs of two 7-wk-old pigs. Ileum and PBMC samples for scRNA-seq were collected from the same two pigs and processed in parallel. *Ensembl identifiers found in gene annotation were converted to gene symbols; refer to methods section “Gene name modifications” for more details. Abbreviations: ILC, innate lymphoid cell; PBMC, peripheral blood mononuclear cell; scRNA-seq, single-cell RNA sequencing.
Figure S29.
Figure S29.. Flow cytometry controls used for gating.
FMO controls for all flow cytometry panels and gating strategies used throughout all main text and supplementary figures. (A) FMO controls corresponding to the flow cytometry panel and gating shown in Figs S2B and S23A. (B) FMO controls corresponding to the flow cytometry panel and gating shown in Fig S23B. (C) FMO controls corresponding to the flow cytometry panel and gating shown in Fig 5A. For each FMO plot, the gating strategy of the shown parent population is listed above each plot and corresponds to the gating strategy used in respective flow cytometry figures. Slight autofluorescence in FITC and BV650 channels of (C) were verified to be absent from final gated populations of CD2+Lin cells identified in corresponding gating of Fig 5A. Abbreviations: FMO, fluorescence-minus-one; SSC-A, side scatter area.

Similar articles

Cited by

References

    1. Agarwal S, Cunningham-Rundles C (2019) Gastrointestinal manifestations and complications of primary immunodeficiency disorders. Immunol Allergy Clin North Am 39: 81–94. 10.1016/j.iac.2018.08.006 - DOI - PMC - PubMed
    1. Alexa A, Rahnenführer J, Lengauer T (2006) Improved scoring of functional groups from gene expression data by decorrelating GO graph structure. Bioinformatics 22: 1600–1607. 10.1093/bioinformatics/btl140 - DOI - PubMed
    1. Allman D, Jain A, Dent A, Maile RR, Selvaggi T, Kehry MR, Staudt LM (1996) BCL-6 Expression during B-cell activation. Blood 87: 5257–5268. 10.1182/blood.v87.12.5257.bloodjournal87125257 - DOI - PubMed
    1. Annamalai T, Lu Z, Jung K, Langel SN, Tuggle CK, Dekkers JCM, Waide EH, Kandasamy S, Saif LJ (2019) Infectivity of GII.4 human norovirus does not differ between T-B-NK+ severe combined immunodeficiency (SCID) and non-SCID gnotobiotic pigs, implicating the role of NK cells in mediation of human norovirus infection. Virus Res 267: 21–25. 10.1016/j.virusres.2019.05.002 - DOI - PMC - PubMed
    1. Annamalai T, Saif LJ, Lu Z, Jung K (2015) Age-dependent variation in innate immune responses to porcine epidemic diarrhea virus infection in suckling versus weaned pigs. Vet Immunol Immunopathol 168: 193–202. 10.1016/j.vetimm.2015.09.006 - DOI - PMC - PubMed

Publication types