. 2022 Oct 15;149(20):dev192310.
doi: 10.1242/dev.192310. Epub 2022 Aug 22.

A pendulum of induction between the epiblast and extra-embryonic endoderm supports post-implantation progression

Affiliations

A pendulum of induction between the epiblast and extra-embryonic endoderm supports post-implantation progression

Erik J Vrij et al. Development. .

Abstract

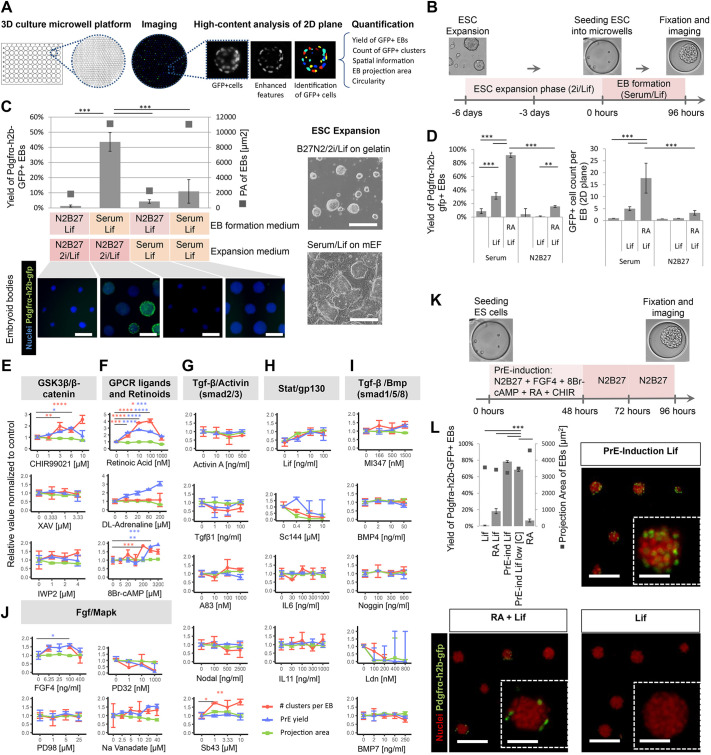
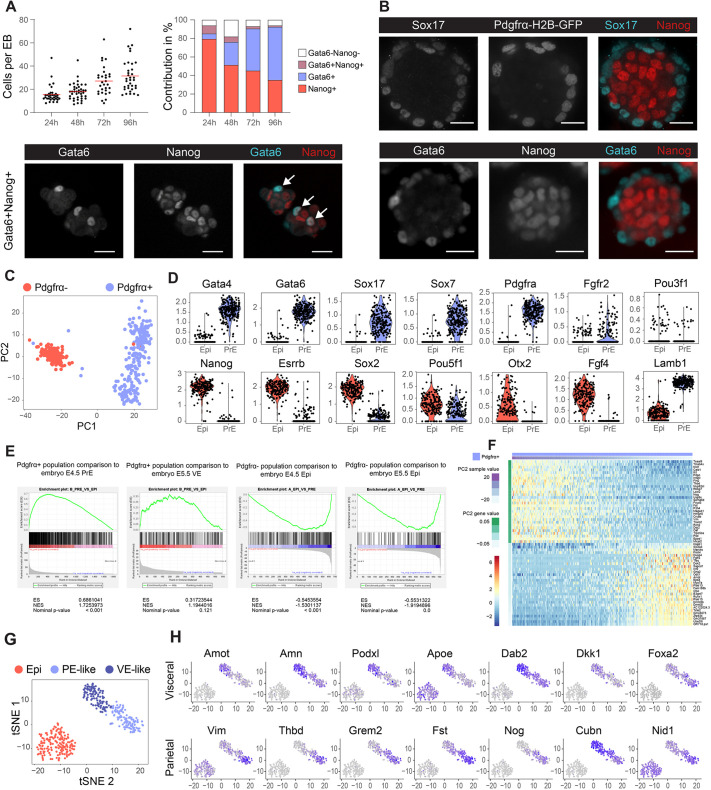
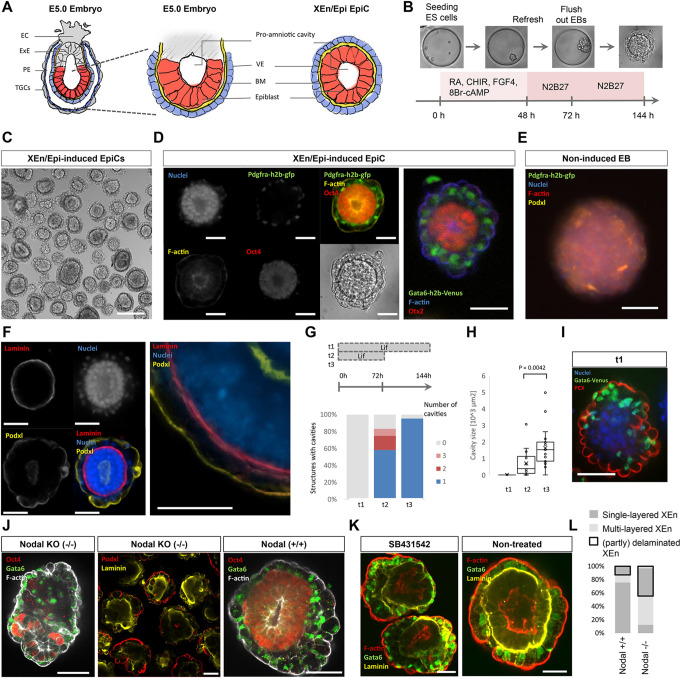
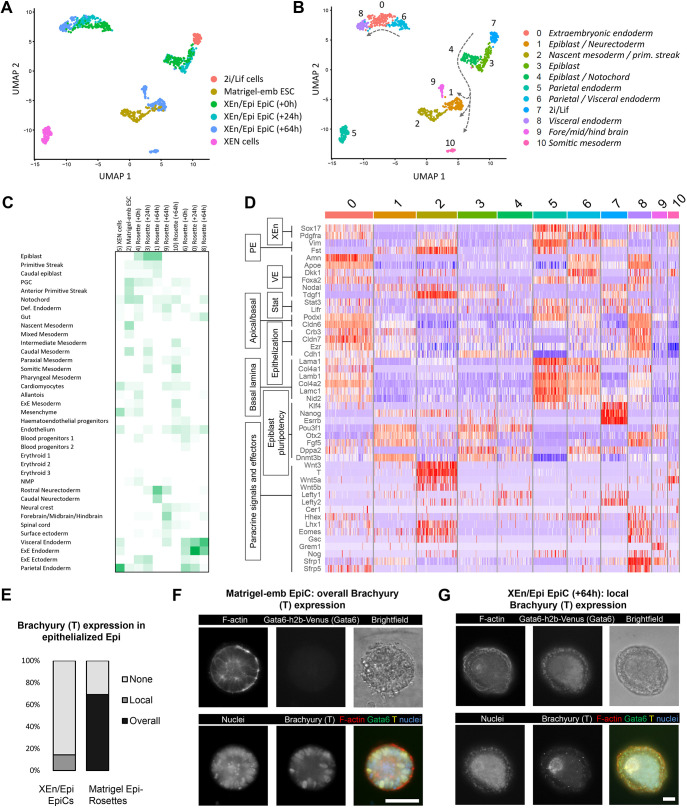
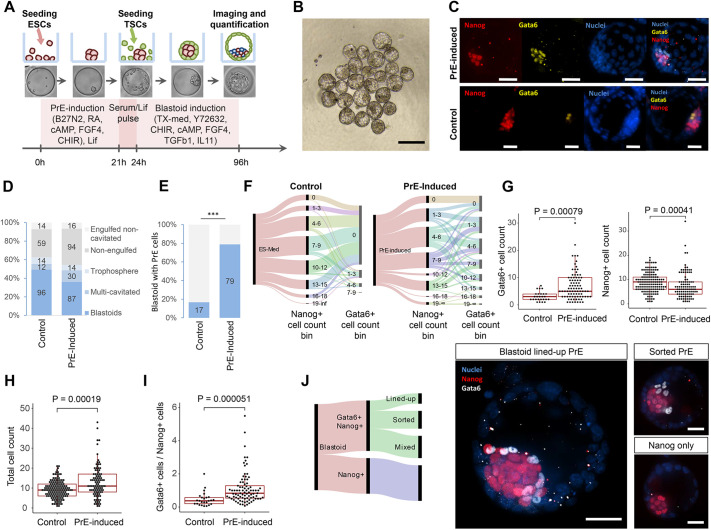
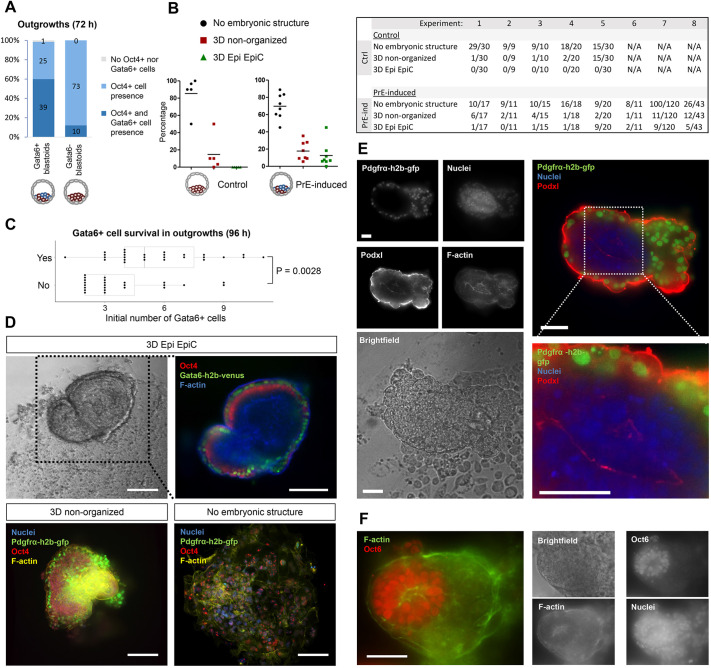
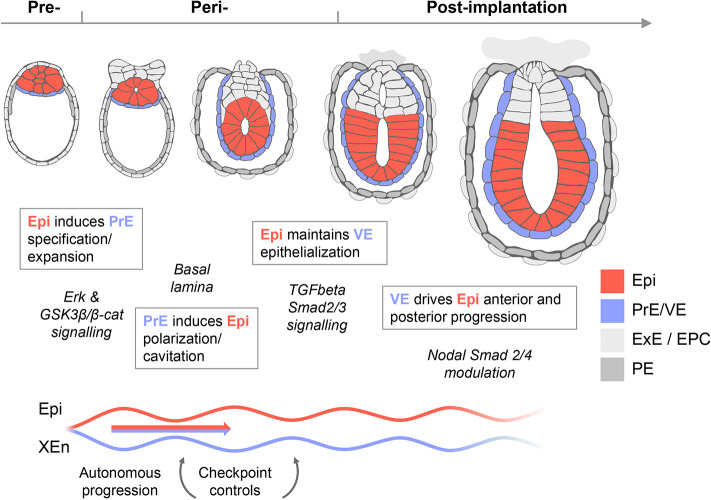
Embryogenesis is supported by dynamic loops of cellular interactions. Here, we create a partial mouse embryo model to elucidate the principles of epiblast (Epi) and extra-embryonic endoderm co-development (XEn). We trigger naive mouse embryonic stem cells to form a blastocyst-stage niche of Epi-like cells and XEn-like cells (3D, hydrogel free and serum free). Once established, these two lineages autonomously progress in minimal medium to form an inner pro-amniotic-like cavity surrounded by polarized Epi-like cells covered with visceral endoderm (VE)-like cells. The progression occurs through reciprocal inductions by which the Epi supports the primitive endoderm (PrE) to produce a basal lamina that subsequently regulates Epi polarization and/or cavitation, which, in return, channels the transcriptomic progression to VE. This VE then contributes to Epi bifurcation into anterior- and posterior-like states. Similarly, boosting the formation of PrE-like cells within blastoids supports developmental progression. We argue that self-organization can arise from lineage bifurcation followed by a pendulum of induction that propagates over time.

Keywords: Blastoids; Embryonic stem cells; Extra-embryonic endoderm/epiblast rosette; Post-implantation development; Primitive endoderm; Pro-amniotic cavity.


Conflict of interest statement

Competing interests N.C.R., E.J.V. and C.A.v.B. are inventors on the patents US14/784,659 and PCT/NL2014/050239, which describe the formation of mouse blastoids (April 2014). All rights and duties are maintained by the Institute for Molecular Biotechnology, Austrian Academy of Science.

Figures

Fig. 1.
Fig. 1.
The initial naive state of ESCs and specific signaling pathways induce efficient co-development of the PrE-/Epi-like niche in vitro. (A) High-content screening (HCS) method for 96-well plates imprinted with agarose microwell arrays (430 microwells per well) in which EBs are formed (each microwell captures a single EB), cultured and imaged (2D mid-focal plane). (B) Schematic of experimental set-up, including ESC expansion and EB-based primitive endoderm (PrE) differentiation. (C) Top and right: quantified yield of PrE-differentiation (Pdgfrα+, left axis) and proxy for EB size (2D projection area, right axis) derived from ESCs expanded in naive (N2B27/2i/Lif) versus serum/Lif conditions. Bottom: fluorescence images show the nuclei (blue) and Pdgfrα-h2b-gfp+ clusters (green) within EBs formed by combinations of different formation and ESC expansion media. Bright-field images of ESCs expanded in N2B27/2i/Lif or serum/Lif [on mouse embryonic fibroblasts (mEFs)]. Scale bars: 200 µm. (D) Yield of Pdgfrα-h2b-gfp+ EBs and the number of GFP+ clusters per EB in N2B27 or serum media supplemented with or without Lif and with or without RA. Data are mean±s.d. obtained from n=4 wells, with each well containing ∼400 EBs. ANOVA with Bonferroni post-hoc test (***P<0.001, **P<0.01). (E-J) Dose-response curves showing the effect of different soluble pathway modulators after 96 h in culture on the yield of Pdgfrα-h2b-gfp+ EBs (blue), the number of Pdgfrα-h2b-gfp+ clusters per EB (red) in median focus plane (10× objective) and the EB projection area (as a proxy for EB size, green). All values were normalized to H2O/DMSO controls. Mean and s.d. values were obtained from n=3 or 4 wells, with every well containing ∼400 EBs. ANOVA with Tukey's multiple comparison test (****P<0.0001, ***P<0.001, **P<0.01, *P<0.05). (K) Schematic for chemically induced differentiation of EBs towards PrE. (L) Graph shows yields for PrE differentiation (left axis) and EB projection area (right axis) using the induction cocktail. Low [C] indicates lower concentrations of cAMP (1 mM) and CHIR99021 (3 µM). Representative fluorescent images of indicated conditions. PrE inductions in Lif and RA/Lif media are shown for comparison. Scale bars: 200 µm; 40 µm (insets). Data are mean±s.d. obtained from n=4 wells, with each well containing ∼400 EBs. ANOVA with Tukey's multiple comparison test (***P<0.001). Images in C, K and L are taken after 96 h of culture.
Fig. 2.
Fig. 2.
EBs form a niche that includes both Epi- and PrE-like cells with putative PE and VE populations. (A) Total cell numbers per PrE-induced EB at 24, 48, 72 and 96 h (left), and associated average contribution of double-positive (Nanog+, Gata6+), double-negative (Gata6, Nanog), Gata6+ and Nanog+ cells per EB over time (right). The image depicts double-positive (Gata6+ and Nanog+, white arrows) cells found within PrE-induced EBs at 24 h (confocal spinning disk fluorescence image, single plane). EBs were randomly selected and pooled from n=3 wells. (B) Immunofluorescence images of Sox17, Pdgfrα-H2B-GFP, Nanog and Gata6 of PrE-induced EBs after 96 h of culture. Scale bars: 50 µm. (C) Principal component analysis of single-cell transcriptomics data for PrE-induced EBs after 96 h of culture in microwells. (D) Violin plots of RNA normalized transcript counts for PrE and Epi markers found in Pdgfrα+ cells (PrE) and Pdgfrα cells (Epi). (E) Gene set enrichment analysis (GSEA) comparing the gene expression signature of the Pdgfrα+ (first and second images) and Pdgfrα (third and fourth images) cell cluster to mouse embryo E4.5 PrE, E5.5 VE, E4.5 Epi and E5.5 Epi (Mohammed et al., 2017). ES, enrichment score; NES, normalized enrichment score. (F) Heatmap depicting single-cell RNA expression data of the top and bottom 30 most differentially expressed genes along the PC2 axis in the subpopulation of Pdgfrα+ cells. (G) tSNE mapping delineates three putative subpopulations: E4.5 Epi, early VE and early PE. (H) tSNE maps for the early VE genes Amot, Amn, Podxl, Apoe, Dab2, Dkk1 and Foxa2, and for the PE genes Vim, Thbd, Grem2, Fst, Nog, Cubn and Nid1. Axes labels are tSNE dimension 1 (vertical) and 2 (horizontal). Color intensity correlates with expression level.
Fig. 3.
Fig. 3.
The PrE-/Epi-like niche spontaneously progresses into a post-implantation extra-embryonic endoderm/epiblast epithelialized pro-amniotic-like cavity (XEn/Epi EpiC) in minimal culture conditions. (A) Schematic depicting an E5.0 conceptus (left, middle) and corresponding tissues in an XEn/Epi EpiC (right). EC, ectoplacental cone; ExE, extra-embryonic ectoderm; PE, parietal endoderm; TGCs, trophoblast giant cells; VE, visceral endoderm; BM, basal lamina. (B) Schematic for XEn/Epi EpiC formation. (C) Bright-field image of XEn/Epi rosettes and EpiCs. Scale bar: 200 µm. (D) Immunofluorescence and bright-field images of individual XEn/Epi rosette images after 120 h of culture. Staining for nuclei (DNA), F-actin (pro-amniotic cavity), Pdgfrα-h2b-gfp (PrE), Oct4 (pluripotent Epi) (left) and Otx2 (right). (E) EB cultured under the same basic conditions but without PrE-induction molecules. (F) Immunofluorescence images depicting cell nuclei (DNA), Podxl (polarization) and laminin (basal lamina) in a XEn/Epi pro-amniotic-like cavity. (G,H) Effect of Lif on (G) the percentage of structures forming a pro-amniotic cavity or multiple cavities and (H) the resulting integrated surface area of the cavities. P-value calculated according to the Mann–Whitney U-test. Boxes and whiskers indicate the first, median and third quartile, and minimum and maximum data points excluding outliers, respectively. This result was repeatedly replicated (>10 times) in other experiments as inclusion of a negative control. (I) Immunofluorescence image of a non-cavitated and non-polarized structure resulting from continuous Lif supplementation, labeled for nuclei, Gata6 (PrE) and Podxl (polarization). (J) Immunofluorescence images of 120 h XEn/Epi EpiCs from double Nodal knockout (−/−) and control (+/+) ESCs. (K) Immunofluorescence images of 120 h XEn/Epi EpiCs treated with the Nodal/activin signaling inhibitor SB431542 and non-treated controls. (L) Percentage of structures (32 in total) that contained a laminated or delaminated XEn layer (outlined in black) that is either single or multilayered. Scale bars in D-F,I-K: 50 µm.
Fig. 4.
Fig. 4.
Cellular identities of XEn/Epi EpiCs over time. (A) UMAP plot of single-cell RNA-seq data of indicated culture conditions. Timepoints indicate the number of hours after EpiCs were flushed out from the microwells. Matrigel-emb ESCs were cultured for 96 h in total. XEN and 2i/Lif cells were cultured as monolayers. (B) Cell points are numbered and colored based on their computationally assigned cluster, and annotated by tissue type. Lines with arrows indicate the trajectory over time of EpiCs (+0 till +64 h). (C) Inferred tissue types per cluster by comparing top gene list with embryo data from Pijuan-Sala et al. (2019). (D) Heatmap plot depicting differentially expressed genes for extra-embryonic endoderm (XEn), parietal endoderm (PE), visceral endoderm (VE), STAT signaling, apical/basal polarity, epithelialization and basal lamina formation, epiblast pluripotency, and paracrine signals and effectors in the Nodal, BMP and Wnt pathways. (E) Brachyury (T) immunofluorescence found in epithelial-like epiblast compartments in XEn/Epi EpiCs (24 structures total) and in Matrigel-embedded Epi-EpiCs (13 structures total). (F,G) Representative immunofluorescence images of overall and local brachyury expression in (F) Matrigel-embedded Epi-EpiCs and (G) XEn/Epi rosettes (+64 h), respectively. Scale bars: 50 µm.
Fig. 5.
Fig. 5.
The PrE/Epi priming of ESCs induces the formation of the niche in blastoids. (A) Schematic for PrE-induced blastoid formation. (B) Bright-field image of representative selection of PrE-induced blastoids. Structures with a single cavity and an inner cell compartment were classified as blastoids. (C) Maximum intensity confocal projection immunofluorescence images of representative PrE-induced and control blastoids stained for Nanog (red) and Gata6 (yellow). DAPI staining (blue) shows cell nuclei. Scale bars: 200 µm. (D) Percentages of the different structures found in microwell arrays in control (n=195) and PrE-induced (n=241) conditions, pooled from two wells per condition. (E) Percentage of blastoids including Gata6+/Nanog+ cells formed under the control of PrE-induced conditions (left). Pooled results from three datasets. ***P<0.001, Fisher's exact test. (F) Alluvial diagram displaying cell count of Nanog+ and Gata6+ dichotomy for control and PrE-induced blastoids (left). (G) Gata6+ and Nanog+ cell counts compared between control and PrE-induced blastoids that contain both Nanog+ and Gata6+ cells. (H) Total number of inner cells within blastoids. (I) Ratio of Gata6+/Nanog+ cells per blastoid containing both Gata6+ and Nanog+ cells. Boxes and whiskers indicate the first, median and third quartile, and minimum and maximum data points excluding outliers, respectively. (J) Alluvial diagram displaying contributions of resulting phenotypes following PrE-induced blastoid formation. Representative immunofluorescence images of PrE/Epi blastoid phenotypes. Scale bars: 50 µm. Data in D-I are derived from two independent experiments with three pooled wells each. In G-I, the P-values were determined using the Mann–Whitney U-test.
Fig. 6.
Fig. 6.
The induction of the PrE-/Epi-like niche in blastoids supports the formation of post-implantation-like tissues. (A) Presence of Epi (Oct4+) and PrE (Gata6+) cells within in vitro outgrown (for 72 h) PrE-induced blastoids with and without Gata6+ cells (96 h). Total number of structures pooled from four experiments are displayed within the bars. (B) Percentage (left) and number (right) of different tissue phenotypes arising from PrE-induced blastoids including two or more Gata6+ cells compared with non-induced blastoids. Every data point represents an independent experiment. Monolayer outgrowths were classified as ‘no embryonic structure’; structures with 3D outgrowths without a pro-amniotic-like cavity and irrespective of cell type were classified as ‘3D non-organized’. Structures with 3D outgrowths that contained Epi cells, PrE cells and had a pro-amniotic-like cavity, as observed by F-actin and/or Podxl staining, were classified as ‘3D Epi EpiC’. (C) The presence of PrE tissue (Gata6+) within in vitro grown PrE-induced blastoids (yes/no, at 96 h) as a function of the numbers of Gata6+ cells within the initial blastoids. Each point represents an individual cell aggregate. P-values were determined by a Mann–Whitney U-test. (D) Top: bright-field and immunofluorescence images of an in vitro grown blastoid with Oct4+ Epi (red) and Gata6+ PrE (green) cells surrounding a pro-amniotic cavity and growing on top of a TSC monolayer (96 h). Bottom: representative images of in vitro grown blastoid phenotypes with Oct4+ Epi (red), Pdgfrα+ PrE (green) and overall F-actin (yellow) and nuclei (blue). Scale bars: 200 µm. (E) Pdgfrα+ cells surrounding an epiblast-like tissue, including a pro-amniotic-like cavity marked by Podxl expression (72 h). Scale bars: 50 µm. (F) Oct6+ epiblast-like tissue blastoid outgrowth (48 h). Scale bar: 50 µm.
Fig. 7.
Fig. 7.
Self-organized reciprocal inductions and pathways underpinning the co-developing XEn-/Epi-like tissues. Signals from the pre-implantation Epi (Erk and GSK3β/β-catenin signaling) support the primitive endoderm (PrE) to produce a basal lamina that subsequently regulates Epi polarization and cavitation. In exchange, the Epi channels the transcriptomic progression to VE through TGFβ signals. This VE then contributes to Epi bifurcation into anterior- and posterior-like states. In this model, self-organization arises from lineage bifurcation followed by a pendulum of induction that propagates over time.

Similar articles

Cited by

References

    1. Anderson, K. G. V., Hamilton, W. B., Roske, F. V., Azad, A., Knudsen, T. E., Canham, M. A., Forrester, L. M. and Brickman, J. M. (2017). Insulin fine-tunes self-renewal pathways governing naive pluripotency and extra-embryonic endoderm. Nat. Cell Biol. 19, 1164-1177. 10.1038/ncb3617 - DOI - PubMed
    1. Andersson-Rolf, A., Mustata, R. C., Merenda, A., Kim, J., Perera, S., Grego, T., Andrews, K., Tremble, K., Silva, J. C. R., Fink, J.et al. (2017). One-step generation of conditional and reversible gene knockouts. Nat. Methods 14, 287-289. 10.1038/nmeth.4156 - DOI - PMC - PubMed
    1. Arnold, S. J. and Robertson, E. J. (2009). Making a commitment: cell lineage allocation and axis patterning in the early mouse embryo. Nat. Rev. Mol. Cell Biol. 10, 91-103. 10.1038/nrm2618 - DOI - PubMed
    1. Artus, J., Panthier, J.-J. and Hadjantonakis, A.-K. (2010). A role for PDGF signaling in expansion of the extra-embryonic endoderm lineage of the mouse blastocyst. Development 137, 3361-3372. 10.1242/dev.050864 - DOI - PMC - PubMed
    1. Artus, J., Piliszek, A. and Hadjantonakis, A.-K. (2011). The primitive endoderm lineage of the mouse blastocyst: sequential transcription factor activation and regulation of differentiation by Sox17. Dev. Biol. 350, 393-404. 10.1016/j.ydbio.2010.12.007 - DOI - PMC - PubMed

Publication types