Review
. 2022 Oct 1;114(16):1014-1036.
doi: 10.1002/bdr2.2079. Epub 2022 Aug 18.

Using high throughput screens to predict miscarriages with placental stem cells and long-term stress effects with embryonic stem cells

Affiliations
Review

Using high throughput screens to predict miscarriages with placental stem cells and long-term stress effects with embryonic stem cells

Elizabeth E Puscheck et al. Birth Defects Res. .

Abstract

A problem in developmental toxicology is the massive loss of life from fertilization through gastrulation, and the surprising lack of knowledge of causes of miscarriage. Half to two-thirds of embryos are lost, and environmental and genetic causes are nearly equal. Simply put, it can be inferred that this is a difficult period for normal embryos, but that environmental stresses may cause homeostatic responses that move from adaptive to maladaptive with increasing exposures. At the lower 50% estimate, miscarriage causes greater loss-of-life than all cancers combined or of all cardio- and cerebral-vascular accidents combined. Surprisingly, we do not know if miscarriage rates are increasing or decreasing. Overshadowed by the magnitude of miscarriages, are insufficient data on teratogenic or epigenetic imbalances in surviving embryos and their stem cells. Superimposed on the difficult normal trajectory for peri-gastrulation embryos are added malnutrition, hormonal, and environmental stresses. An overarching hypothesis is that high throughput screens (HTS) using cultured viable reporter embryonic and placental stem cells (e.g., embryonic stem cells [ESC] and trophoblast stem cells [TSC] that report status using fluorescent reporters in living cells) from the pre-gastrulation embryo will most rapidly test a range of hormonal, environmental, nutritional, drug, and diet supplement stresses that decrease stem cell proliferation and imbalance stemness/differentiation. A second hypothesis is that TSC respond with greater sensitivity in magnitude to stress that would cause miscarriage, but ESC are stress-resistant to irreversible stemness loss and are best used to predict long-term health defects. DevTox testing needs more ESC and TSC HTS to model environmental stresses leading to miscarriage or teratogenesis and more research on epidemiology of stress and miscarriage. This endeavor also requires a shift in emphasis on pre- and early gastrulation events during the difficult period of maximum loss by miscarriage.

Keywords: DevTox; SGA blastocysts; high throughput screens; miscarriage; stem cells; stress.


Conflict of interest statement

Conflict of Interest

The authors declare that the research was conducted in the absence of any commercial or financial relationships that could be construed as a potential conflict of interest.

Figures

Fig.1.
Fig.1.
Human embryo, fetal, placental results for A-E, and mouse for F-H. Pyramid with nonlinear time periods from fertilization at bottom and live birth at top, three negative outcomes and one positive outcome on left, fractional outcomes in pyramid, and methods of assignment of timepoint thresholds on right of pyramid Modified from (Macklon et al., 2002). B. Weeks of pregnancy based on last menses. C. Days of pregnancy where fertilization = E0, D embryonic-fetal events, E. placental events, F. Days of pregnancy after fertilization. G. Mouse embryonic-fetal events, H. Fetal placental events. Blue asterisks in F, G, and H refer to groups of lethal mutants affecting specific functions over short periods of developmental times as indicated.
Fig.2.
Fig.2.
From normal stemness culture (NS) to a high, but viable, stress-forced loss of stemness and gain of first lineage, bright first lineage sorted Pdgfra-promoter ESC increase from nothing to about 1%, whereas first lineage trophoblast giant cells induced from TSC increase from about 5% to 50%. In ESC (A) the key comparison is between NS after 3dy culture and 300mM sorbitol override of NS (LIF+/stemness maintain growth factor) (modified from Li et al. 2018, Abdulhasan et al. 2021). In TSC (B) the same type of comparison as ESC is between baseline NS after 6day of culture and 0.5% oxygen – sharply stressful compared with optimal 2% oxygen – and its override of NS (fibroblast growth factor (FGF)4/stemness maintaining growth factor). 300mM sorbitol and 0.5% oxygen produce similar levels of growth decrease in ESC and TSC, respectively (modified from Yang et al., 2016). Note that maximum ESC first lineage XEN is ~1% bright after 3day of 300mM sorbitol, but that at 0.5% hypoxia oxygen levels at 3day 27% of TSC are first lineage giant cells and by 6day 51% are giant cells.
Fig.3.
Fig.3.
Human and mouse embryos accelerate stem cell proliferation from allocation of ESC and TSC prior to and after implantation. But TSC acceleration precedes ESC. (A, B) Mouse exponential growth diagrams were modified from (McLaren and Snow, 1976). (C.) The human exponential growth diagram was modified from (Hardy et al. 1989) and first lineages assignments were added from (Petropoulos et al. 2015). At the top, oxygen levels in the oviduct and uterus before implantation are on the left and after implantation on the right, from (Houghton, 2021). In (A) at the far left, increase in cell number or embryo/fetus mass is shown throughout mouse gestation (McLaren and Snow, 1976). In the red box, is shown the period of exponential growth that starts when ESC and TSC are allocated in the preimplantation embryo and continues for days after implantation. The start of the exponential period in the red box is enlarged for mouse (B) and human (C) peri-implantation development, where yellow highlights show ESC and TSC first lineages, blue highlights show ICM and ESC early pluripotent lineages and light brown highlights other multipotent TSC lineages.
Fig.4.
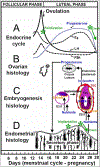
Fig.4.. Oocytes are fertilized mid-endocrine/menstrual cycle (A), implant during the E2 peak about 6 days later, and must produce sufficient embryonic hCG (C) to maintain progesterone synthesis by maintaining ovarian luteal secretion (B) that maintains endometrial secretory phase nutrition (D) for the implanting embryo and its XEN nutritional uptake (C).
As embryos implant into the uterus at E4.5 and access maternal blood supply, they produce first lineages from ESC (e.g., nutrient acquiring extra-embryonic endoderm/aka XEN cells) and from TSC (C) (e.g., indirect nutrient-requesting hormone from syncytiotrophoblasts 1st lineage in human-human chorionic gonadotropin-(hCG) and from mouse trophoblast giant cells/TGC- placental lactogen-(PL)1) (Yang et al. 2017). If hCG does not increase exponentially and induce luteal progesterone that induces endometrial nutritional support for the implanting embryo, the embryo miscarries (Wilcox et al., 1988). If XEN, and its early lineage primitive and visceral endoderm sub-lineages, are not sufficient to absorb nutrients and deliver them to the adjacent embryonic or extra-embryonic cells, the embryonic ectoderm cells die (Rappolee, 1999). Modified from the above references and Kronenberg and Williams, 2008. First lineage of the inner cell mass (ICM, dark purple) of ESC is XEN (orange XEN/ExEndo in E3.5 preimplantation and E5.5 post-implantation embryo). XEN next to the preimplantation ICM at E4.5 is called primitive endoderm and at E5.5 XEN adjacent to embryonic ectoderm is called visceral endoderm. First lineage from TSC arises by E5.5 as the red outer cells (trophoblast giant cells secreting hCG for mouse orPL1 for human. TSC at E3.5 and E5.5 are light purple, and require FGF4 to maintain multipotency, proliferation and aerobic glycolysis. Note that dark purple cells at E3.5 are 0th lineage naïve pluripotent ESC lineage, and at E5.5 have restricted to formative pluripotent ESC 2nd lineage. In green is shown the times when major events happen such as implantation (C), and if the first lineage differentiated from TSC makes insufficient hCG, the crash of progesterone (A) and subsequent secretory endometrial crash (D). The greatest miscarriage rate is during early implantation, but the placental progesterone production does not replace luteal progesterone for another 5 weeks and hCG must increase exponentially during this period to maintain luteal progesterone and prevent embryo loss.
Fig.5.
Fig.5.
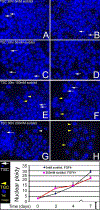
During a 30hr exposure, the number of 1st lineage trophoblast giant cells (TGC, yellow arrowheads) with ploidy > 8, increases from 0mM sorbitol (A, B), 50mM (C, D), 100mM (E, F) to 200mM sorbitol (G, H). And TSC (2–4N, white arrows) decreases. This happens despite the presence of FGF4 which normally maintains TSC multipotency and proliferation, ploidy (2–4N). (I) During a 7-day exposure at 200mM sorbitol, initially at 2day stress overriding stemness creates higher levels of ploidy despite FGF4 presence, but by 7 days 0mM sorbitol with FGF4 removal increased ploidy to significantly higher levels of ploidy (Pvalue <0.05 by t test). A similar finding of early increase of ploidy at 2 days for hypoxic stress at 0.5% O2 despite FGF4 (as in Figure 1) and higher ploidy at 20% O2 with FGF4 removal at a later day was previously published (Xie et al., 2014). Modified from data previously reported (Awonuga et al., 2011).
Fig.6.
Fig.6.
TSC maintain stemness and low ploidy (2–4N, white arrows as in Figure 4) in standard culture with FGF4 and ambient O2 (A). But hypoxic stress of 0.5% O2 (below the 2% O2 optimum) overrides FGF4 to produce trophoblast giant cells (TGC) with high ploidy (yellow arrowheads as in Figure 4) (B). Hypoxic stress with FGF4 removal (D) causes imbalanced differentiation to TGC like normal balanced differentiation (C). In ESC (A) the key comparison is between NS after 3dy culture and 300mM sorbitol override of NS (LIF+/stemness maintain growth factor) (modified from Li et al. 2018, Abdulhasan et al. 2021). In TSC (B) the same type of comparison as ESC is between baseline NS after 6day of culture and 0.5% oxygen – sharply stressful compared with optimal 2% oxygen – and its override of NS (fibroblast growth factor (FGF)4/stemness maintaining growth factor). 300mM sorbitol and 0.5% oxygen produce similar levels of growth decrease in ESC and TSC, respectively (modified from Yang et al., 2016).
Fig.7.
Fig.7.
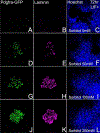
During a 3-day exposure, the number of 1st lineage XEN is low compared to all Hoechst-stained cells at any sorbitol dose from 0–250mM sorbitol overriding LIF (Li et al., 2019). XEN cells are visualized by co-expressing Pdgfra promoter-GFP (A, D, G, J), and endogenous laminin detected by immunofluorescence (B, E, H, K), but these are found in in contiguous colonies of cells only occasionally and even then, are only a small subpopulation of cells as visualized by Hoechst nuclear stain (C, F, I, L). Compare this with the high frequency of first lineage TGC induced by hyperosmotic sorbitol (Fig.4) or hypoxic O2 (Fig.4) despite FGF4. Compared also are the subpopulation fraction size of cells expressing first giant cell nuclei after hypoxia in Fig.1B with the fraction of Pdgfra promoter-GFP+ bright cells in Fig.1A. This figure was modified from data from Li et al, 2019.

Similar articles

Cited by

References

    1. Building and managing an IVF laboratory : a practical guide. pages cm p.
    1. Abdulhasan M, Ruden X, Marben T, Harris S, Ruden DM, Awonuga AO, Puscheck EE, Rappolee DA. 2022. Using Live Imaging and Fluorescence Ubiquitinated Cell Cycle Indicator Embryonic Stem Cells to Distinguish G1 Cell Cycle Delays for General Stressors like Perfluoro-Octanoic Acid and Hyperosmotic Sorbitol or G2 Cell Cycle Delay for Mutagenic Stressors like Benzo(a)pyrene. Stem Cells Dev 31(11–12):296–310. - PMC - PubMed
    1. Abdulhasan M, Ruden X, You Y, Harris S, Ruden D, Awonuga A, Alvero A, Puscheck E, Rappolee D. 2021. Using live imaging and FUCCI embryonic stem cells (ESC) to rank Devtox risks: adverse growth effects of PFOA compared with DEP are 26times faster, 1,000 times more sensitive, and 13 times greater in magnitude. Frontiers in Toxicology 3:1–15. - PMC - PubMed
    1. Ain R, Dai G, Dunmore JH, Godwin AR, Soares MJ. 2004. A prolactin family paralog regulates reproductive adaptations to a physiological stressor. Proc Natl Acad Sci U S A 101(47):16543–16548. - PMC - PubMed
    1. Alam SM, Konno T, Dai G, Lu L, Wang D, Dunmore JH, Godwin AR, Soares MJ. 2007. A uterine decidual cell cytokine ensures pregnancy-dependent adaptations to a physiological stressor. Development 134(2):407–415. - PubMed

Publication types