. 2022 Oct 1;33(12):ar115.
doi: 10.1091/mbc.E22-04-0118. Epub 2022 Aug 17.

Revisiting the multisite phosphorylation that produces the M-phase supershift of key mitotic regulators

Affiliations

Revisiting the multisite phosphorylation that produces the M-phase supershift of key mitotic regulators

Tan Tan et al. Mol Biol Cell. .

Abstract

The term M-phase supershift denotes the phosphorylation-dependent substantial increase in the apparent molecular weight of numerous proteins of varied biological functions during M-phase induction. Although the M-phase supershift of multiple key mitotic regulators has been attributed to the multisite phosphorylation catalyzed by the Cdk1/cyclin B/Cks complex, this view is challenged by multiple lines of paradoxical observations. To solve this problem, we reconstituted the M-phase supershift of Xenopus Cdc25C, Myt1, Wee1A, APC3, and Greatwall in Xenopus egg extracts and characterized the supershift-producing phosphorylations. Our results demonstrate that their M-phase supershifts are each due to simultaneous phosphorylation of a considerable portion of S/T/Y residues in a long intrinsically disordered region that is enriched in both S/T residues and S/TP motifs. Although the major mitotic kinases in Xenopus egg extracts, Cdk1, MAPK, Plx1, and RSK2, are able to phosphorylate the five mitotic regulators, they are neither sufficient nor required to produce the M-phase supershift. Accordingly, inhibition of the four major mitotic kinase activities in Xenopus oocytes did not inhibit the M-phase supershift in okadaic acid-induced oocyte maturation. These findings indicate that the M-phase supershift is produced by a previously unrecognized category of mitotic phosphorylation that likely plays important roles in M-phase induction.


Figures

FIGURE 1:
FIGURE 1:
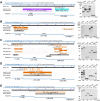
Reconstitution of the M-phase supershift of the five key mitotic regulators by phosphorylation of recombinant proteins with MEE. (A) Phosphorylation of myc-tagged Xenopus Cdc25C, Gwl, APC3, Myt1, and Wee1A with IOE or MEE for 2 h, followed by immunoblotting with anti-myc tag antibodies. (B) Phosphorylation of myc-tagged human Pin1, sea urchin cyclin B ∆90, Xenopus Plk1 (Plx1), Xenopus MEK1, and Xenopus MAPK with IOE or MEE for 2 h, followed by myc-tag immunoblotting. (C) Phosphorylation of myc-tagged Cdc25C, Gwl or Myt1 with CSF extract or MEE, followed by myc-tag immunoblotting. (D–F) Left panels show results from progesterone stimulation of Xenopus oocytes that ectopically expressed each of the indicated myc-tagged Cdc25C proteins for the indicated hours, followed by oocyte extraction and myc-tag immunoblotting. Right panels show results from phosphorylation of the TNT products of the same myc-tagged Cdc25C proteins with MEE for the indicated hours, followed by myc-tag immunoblotting.
FIGURE 2:
FIGURE 2:
Association of the M-phase supershift with specific protein regions. Cdc25C (A), Gwl (B), APC3 (C), Myt1 (D), and Wee1A (E) were each divided into indicated fragments according to their functional domains from NCBI search, with indication of the supershift fragments identified by four asterisks (left). Indicated myc-tagged full-length and fragment proteins were phosphorylated with MEE for 2 h, followed by myc-tag immunoblotting (right). Estimated magnitudes of the MEE-induced gel mobility shifts for different proteins are indicated.
FIGURE 3:
FIGURE 3:
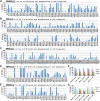
Common features of the supershift fragments. (A) Prediction of disordered regions in Xenopus Cdc25C, Gwl, APC3, Myt1, and Wee1A (green and blue) by d2p2 with parallel indication of the supershift ability of tested fragments. (B) The percentage of S/T residues (upper) and the number of S/TP motifs per 100 residues (lower) were determined for indicated fragments of the five proteins and graphed.
FIGURE 4:
FIGURE 4:
Significant phosphorylation of most of the S/T or S/T/Y residues in the supershift domain. (A–E) Phosphorylation sites identified in the supershift fragments of Cdc25C (A), Gwl (B), APC3 (C), Myt1 (D), and Wee1A (E). Strikethroughs indicate nonrecovered sequences. Red and blue types indicate phosphorylated and nonphosphorylated S/T/Y residues determined by mass spectrometry, respectively. Underlines are S/T/Y clusters. Shaded S/T/Y residues in red types indicate <5% of phosphorylation identification frequencies. (F) A summary of recovered S/T/Y residues and identified phosphorylation sites from the five supershift fragments.
FIGURE 5:
FIGURE 5:
Widespread medium to high phosphorylation stoichiometries in the supershift domain. (A–E) Phosphorylation identification frequencies for individual S/T/Y residues in Cdc25C9-374 (A), Gwl179-745 (B), APC3147-457 (C), Myt1352-548 (D), and Wee1A1-199 (E). Asterisks indicate proline-directed S/T residues, and < symbols indicate tyrosine residues. Crosses indicate the S/T/Y residues in nonrecovered regions. (F) Percentages of the phosphorylation sites that were identified at ≥5%, ≥20%, and ≥40% frequencies by mass spectrometry for the five supershift fragments. (G) Percentages of total S/T, Y, or S/T/Y residues recovered from each of the five supershift fragments that were phosphorylated.
FIGURE 6:
FIGURE 6:
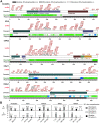
Informatic analysis of phosphorylation patterns of human Cdc25C, Gwl, APC3, Myt1, and Wee1. (A) Curated compilation of previously identified phosphorylation sites in human Cdc25C, Gwl, APC3, Myt1, and Wee1 with parallel indications of intrinsically disordered regions (green and blue) and similar divisions as done for their Xenopus orthologs. Proline-directed phosphorylation sites are underlined. Black sites indicate phosphorylated S/T residues in equivalent positions of rodent orthologs. (B) The percentage of S/T residues (upper) and the number of S/TP motifs per 100 residues (lower) are graphed for indicated fragments of the five proteins.
FIGURE 7:
FIGURE 7:
Generation of supershifts by additive numerous small shifts. (A) Phosphorylation of myc-tagged Cdc25C9-79 (left) and Cdc25C9-129 (right) for the indicated minutes, followed by myc-tag immunoblotting. Red numbers indicate discernible steps in the process of developing the supershift. (B) The upper panel shows the amino acid sequence of Cdc25C19-80 with numbering of the 12 S/T residues (red underlined), with conserved TP motifs at T48 and T67 highlighted by yellow, and the additional proline-directed S/T residue is indicated by an asterisk. The lower panel shows myc-tag immunoblots of different mutant forms of Cdc25C19-80 without MEE treatment (left and middle) or with MEE treatment (right). (C) The upper panel shows the amino acid sequence of Cdc25C81-213 with numbering of the 22 S/T residues, with the conserved TP motifs at T138 highlighted by yellow and the remaining six proline-directed S/T residues indicated each by an asterisk. The lower panel shows myc-tag immunoblots of different mutant forms of 10DE Cdc25C19-213 without MEE treatment (left) or with MEE treatment (right). (D) Phosphorylation of myc-tagged wild type (WT) or all ST-to-DE mutant forms (DE) of the five supershift fragments with MEE for 2 h, followed by myc-tag immunoblotting. The shift value was calculated by dividing the shift kDa from all DE mutations by the total number of DE mutations.
FIGURE 8:
FIGURE 8:
Phosphorylation of the five mitotic regulators with the four major mitotic kinases produced by TNT is insufficient to produce the M-phase supershift. (A) A schematic diagram of Cdc25C with illustration of the major Cdk1, MAPK, Plx1, and RSK2 phosphorylation sites identified in the supershift domain. (B–F) Myc tagged Cdc25C9-375 (B), Gwl179-745 (C), Myt1 (D), Wee1A (E), and APC3 (F) were each phosphorylated either with the four major mitotic kinases individually in parallel with MEE (left panels) or with the four kinases collectively (4 kinase mix) in parallel with 1:4 MEE (right panels) for the indicated hours, followed by myc-tag immunoblotting.
FIGURE 9:
FIGURE 9:
Activation of all four of the major mitotic kinases in IOE is insufficient to induce the M-phase supershift. (A) 1:10-IOE*-OA was incubated with EB-treated or MEE-phosphorylated myc-Cdc25C immunocomplex at indicated intervals for up to 60 min (short time course) or for up to 2.5 h (long time course), followed by immunoblotting with indicated antibodies to visualize activations of Cdk1, Plx1, MAPK, and RSK2. (B) 1:10-IOE*-OA was incubated for the indicated hours with either control IgG immunoprecipitate (mock IP) or myc-Cdc25C immunoprecipitate (Cdc25 IP) that had been treated with EB, MEE, or IOE. After beads were pelleted down at indicated time points, SN proteins were immunoblotted in parallel with 1:10 MEE with the same antibodies as used in A and B to visualize activations of MAPK and Cdk1, with anti-Cdc25C antibodies to visualize gel mobility shifts of endogenous Cdc25C, and with MPM-2 to assess M-phase entry.
FIGURE 10:
FIGURE 10:
Inhibition of the four major mitotic kinase activities had little effect on MEE-induced supershifts of the five supershift fragments. (A) Kinase inhibitors and their concentrations used in MEE. (B) Phosphorylation of indicated supershift fragments with MEE in the presence of individual kinase inhibitors for the indicated minutes, followed by myc-tag immunoblotting. (C, D) Phosphorylation of indicated supershift fragments with MEE in the presence of all four of specific kinase inhibitors or ST for the indicated minutes, followed by myc-tag immunoblotting. (E) Side-by-side myc-tag immunoblotting of the Gwl179-745 samples from three different time points in D.
FIGURE 11:
FIGURE 11:
Immunodepletion of the four major mitotic kinases had no or minor effects on MEE-induced supershifts of the five supershift fragments. (A) Immunodepletion of MEE with each of indicated kinase-specific antibodies or control IgG, followed by immunoblotting of SNs with antibodies for each of indicated proteins. (B) Phosphorylation of each of myc-tagged supershift fragments with individual kinase-depleted or control IgG-absorbed MEE for the indicated minutes, followed by myc-tag immunoblotting. (C) Phosphorylation of each of myc-tagged supershift fragments with all four kinase-depleted or control IgG-absorbed MEE for the indicated minutes, followed by myc-tag immunoblotting.
FIGURE 12:
FIGURE 12:
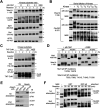
p9-enhanced multisite phosphorylation by the Cdk1/CycB complex does not play a physiologically important role in the M-phase supershift. (A) Phosphorylation of myc-tagged five supershift fragments with increased ratios of p9-Cdk1:substrate or MEE for the indicated hours, followed by myc-tag immunoblotting. (B) Parallel phosphorylation of myc-tagged Cdc25C9-375 or Wee1A1-199 with serial dilutions of p9-Cdk1 or MEE for 1 h, followed by myc-tag immunoblotting. (C) Parallel phosphorylation of each of the indicated myc-tagged supershift fragments with increased ratios of TNT-Cdk1:substrate or MEE for the indicated hours, followed by myc-tag immunoblotting. (D) Parallel phosphorylation of WT and all SP mutant form (All SPs) of myc-tagged Myt1406-548 or Wee1A1-199 with p9-Cdk1 or MEE for the indicated hours, followed by myc-tag immunoblotting. The mutant sites in the two proteins are specified. (E) MEE was absorbed with GST or GST-p9 once or twice, and the SN and bound proteins (beads) were immunoblotted with anti-Cdk1 or anti-Plx1 antibodies. (F) Phosphorylation of myc-Cdc25C9-375 for the indicated minutes with MEE that was absorbed with GST- or GST-p9 once or twice, followed by myc-tag immunoblotting.
FIGURE 13:
FIGURE 13:
The four major mitotic kinases are not required for the M-phase supershift in OA-induced Xenopus oocyte maturation. (A) Xenopus oocytes were injected with mRNA for each of the five myc-tagged supershift fragments and cultured for 6–8 h. These injected oocytes were further cultured in the presence of indicated kinase inhibitors for 2–4 h and then either stimulated with progesterone (Prog) (A) or injected with OA (B) in the continued presence of the kinase inhibitors. GVBD was scored at the indicated h. Proteins extracts of lastly collected oocytes were assayed for H1 kinase activity by 32P incorporation and immunoblotted with indicated antibodies.

Similar articles

Cited by

References

    1. Abe S, Nagasaka K, Hirayama Y, Kozuka-Hata H, Oyama M, Aoyagi Y, Obuse C, Hirota T (2011). The initial phase of chromosome condensation requires Cdk1-mediated phosphorylation of the CAP-D3 subunit of condensin II. Genes Dev 25, 863–874. - PMC - PubMed
    1. Alberts B, Johnson A, Lewis J, Morgan D, Raff M, Roberts K, Walter P (2015). The cell cycle. In: Molecular Biology of the Cell, New York: Garland Science.
    1. Alexander J, Lim D, Joughin BA, Hegemann B, Hutchins JR, Ehrenberger T, Ivins F, Sessa F, Hudecz O, Nigg EA, et al. (2011). Spatial exclusivity combined with positive and negative selection of phosphorylation motifs is the basis for context-dependent mitotic signaling. Sci Signal 4, ra42. - PMC - PubMed
    1. Bhatt RR, Ferrell JE Jr (2000). Cloning and characterization of Xenopus Rsk2, the predominant p90 Rsk isozyme in oocytes and eggs. J Biol Chem 275, 32983–32990. - PubMed
    1. Blake-Hodek KA, Williams BC, Zhao Y, Castilho PV, Chen W, Mao Y, Yamamoto TM, Goldberg ML (2012). Determinants for activation of the atypical AGC kinase Greatwall during M phase entry. Mol Cell Biol 32, 1337–1353. - PMC - PubMed

Publication types