. 2022 Aug 15;12(1):13815.
doi: 10.1038/s41598-022-17845-1.

Loss of Nexmif results in the expression of phenotypic variability and loss of genomic integrity

Affiliations

Loss of Nexmif results in the expression of phenotypic variability and loss of genomic integrity

Caroline Stekelenburg et al. Sci Rep. .

Abstract

We identified two NEXMIF variants in two unrelated individuals with non-autoimmune diabetes and autistic traits, and investigated the expression of Nexmif in mouse and human pancreas and its function in pancreatic beta cells in vitro and in vivo. In insulin-secreting INS-1E cells, Nexmif expression increased strongly in response to oxidative stress. CRISPR Cas9-generated Nexmif knockout mice exhibited a reduced number of proliferating beta cells in pancreatic islets. RNA sequencing of pancreatic islets showed that the downregulated genes in Nexmif mutant islets are involved in stress response and the deposition of epigenetic marks. They include H3f3b, encoding histone H3.3, which is associated with the regulation of beta-cell proliferation and maintains genomic integrity by silencing transposable elements, particularly LINE1 elements. LINE1 activity has been associated with autism and neurodevelopmental disorders in which patients share characteristics with NEXMIF patients, and can cause genomic instability and genetic variation through retrotransposition. Nexmif knockout mice exhibited various other phenotypes. Mortality and phenotypic abnormalities increased in each generation in both Nexmif mutant and non-mutant littermates. In Nexmif mutant mice, LINE1 element expression was upregulated in the pancreas, brain, and testis, possibly inducing genomic instability in Nexmif mutant mice and causing phenotypic variability in their progeny.


Conflict of interest statement

The authors declare no competing interests.

Figures
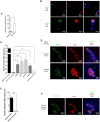
Figure 1
Figure 1
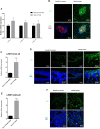
Nexmif expression in beta cells in different species and in INS-1E cells. (A) Nexmif mRNA expression in rat brain (n = 3) and in INS-1E cells (n = 3). (B) Nexmif localization (green) in proliferating INS-1E cells marked by Ki67 staining (red). DAPI staining in blue. (C) Nexmif mRNA expression from left to right in mouse brain at postnatal day 3 (MBP3) (positive control, n = 3); mouse liver at 1 year (negative control, n = 3); mouse pancreas at postnatal day 0 (n = 3), postnatal day 7 (n = 3), postnatal day 14 (n = 3), and postnatal day 21 (n = 3); and adult mouse islets (n = 3). Error bars, standard deviation; n, sample size. (D) Nexmif localization (green) in mouse pancreas at postnatal days 0 and 21, partially co-staining (yellow) with insulin (red). (E) Nexmif mRNA expression in human pancreatic endocrine (n = 3) and exocrine tissue (n = 3). (F) Nexmif localization (green) in human pancreas partially co-staining (yellow) with insulin (red). Error bars, standard deviation; n, sample size. *P ≤ 0.05, **P ≤ 0.01, and ***P ≤ 0.001.
Figure 2
Figure 2
Pancreatic islet proliferation and function in Nexmif mutant mice. (A) Percentage of proliferating beta cells marked by Ki67 in the pancreatic islets of Nexmif non-mutant (n = 3) and mutant mice (n = 3) at postnatal day 21. Error bars indicate the standard deviation. The box plots are presented as median with 25th percentiles (boxes). Two-tailed unpaired Student t-test. ****P ≤ 0.0001. (B) Beta-cell counts in pancreatic islets of Nexmif non-mutant (n = 3) and mutant mice (n = 3) at postnatal day 21. (C) Islet size distribution in Nexmif non-mutant (n = 3) versus mutant mice (n = 3) at postnatal day 21. (D, E) Area under the curve for glucose levels and determination of insulin levels after intra-peritoneal glucose tolerance tests in control C57BL6 mice outside the colony at 12 weeks (n = 3) and 40 weeks (n = 3), Nexmif non-mutant mice at 12 weeks (n = 8) and 40 weeks (n = 13), and Nexmif mutant mice at 12 weeks (n = 12) and 40 weeks (n = 18). Only male mice were used. Error bars indicate the standard deviation and “n” is the sample size. Significance was determined using 2-way ANOVA for repeated measurements followed by a multiple comparisons post hoc test. *Control vs. Nexmif mutant, P ≤ 0.05; ***Control vs. Nexmif mutant, P ≤ 0.001; $$Nexmif non-mutant vs. Nexmif mutant, P ≤ 0.01; #Control vs. Nexmif non-mutant, P ≤ 0.05. Ns: non-significant. The quantitative insulin sensitivity check index (QUICKI) was calculated with the following formula: 1/(log(fasting insulin μU/mL) + log(fasting glucose mg/dL)), the HOMA B% with (20 × Insulin μU/mL)/(glucose (mmol/l) – 3.5),. Significance was determined using one-way ANOVA analysis. Error bars indicate the standard deviation.
Figure 3
Figure 3
DNA damage in pancreatic islets of Nexmif mutant mice. DNA double-strand breaks marked by immunofluorescent staining with γ-H2AX (green) in pancreatic islets of Nexmif non-mutant (n = 3) and mutant mice (n = 3) at postnatal day 21. Insulin (red), DAPI (blue).
Figure 4
Figure 4
RNAseq in pancreatic islets of Nexmif mutant mice. (A) Gene expression profile of differentially expressed genes in pancreatic islets of male Nexmif mutant and Nexmif non-mutant mice. Kendall’s Tau was used for clustering possibly co-expressed pathway genes (n = 3). RNAseq mRNA expression data from pancreatic islets. The most highly expressed genes that were upregulated at least twofold in Nexmif mutant islets compared with Nexmif non-mutant islets (n = 3) are shown. (B) RNAseq mRNA expression data from pancreatic islets. The most highly expressed genes that were downregulated at least twofold in Nexmif mutant islets compared with Nexmif non-mutant islets (n = 3) are shown. (C) Confirmation of downregulated genes by qPCR: Hsp90ab1, Hsp90aa1, H3f3b, Zfp36 (n = 3). Error bars indicate the standard deviation. Two-tailed unpaired Student’s t-test: *P ≤ 0.05, **P ≤ 0.01. ***P ≤ 0.001, ****P ≤ 0.0001.
Figure 5
Figure 5
Nexmif expression in reaction to oxidative stress in INS-1E cells. (A) Nexmif mRNA expression over a time course in response to 200 µM H2O2 at time points 0 h, 0.5 h, 2 h, 6 h, and 24 h (n = 3). Error bars indicate the standard deviation. Two-tailed unpaired Student t-test: *P ≤ 0.05, **P ≤ 0.01, ***P ≤ 0.001, ****P ≤ 0.0001. (B) Nexmif localization (green) in INS-1E cells challenged with 200 µM H2O2 over a time course of 0 h, 0.5 h, and 6 h by immunofluorescence. DAPI (blue). (C) Expression and co-localization of Nexmif (green) by fluorescent in situ RNA hybridization (FISH) with G3BP1 (red) in INS-1E cells, marking stress granules by immunofluorescence.
Figure 6
Figure 6
Determination of whether Nexmif transcripts are ARE mRNAs. (A) Elavl4 and Nexmif expression in Elavl4 knockdown INS-1E cells (n = 3). (B) Localization of Nexmif mRNA (green) and G3BP1 protein (red) after 6-h H2O2 treatment of INS-1E cells. (C) Beta-actin and Nexmif expression in INS-1E cells after incubation at 37 °C for 0 h, 0.5 h, 2 h and 6 h (n = 3). (D) Beta-actin and Nexmif expression in INS-1E cells after incubation with 10 µg/mL actinomycin D for 0 h, 0.5 h, 2 h and 6 h (n = 3). Error bars, standard deviation; n, sample size.
Figure 7
Figure 7
LINE1 activation. (A) RNAseq expression data for transposable LINE1 elements in pancreatic islets of 6-week-old Nexmif mutant and non-mutant mice (n = 3). (B) ORF1 protein (green) expression in Nexmif mutant and non-mutant mouse pancreas at postnatal day 21 by immunofluorescence. Insulin (red), DAPI (blue). (C) LINE1 mRNA expression in Nexmif mutant and non-mutant mouse brain at postnatal day 0 (n = 3). (D) ORF1 expression (green) in Nexmif mutant and non-mutant mouse brain (cortex) at postnatal day 0 by immunofluorescence. DAPI (blue). (E) LINE1 mRNA expression in Nexmif mutant and non-mutant mouse testis at postnatal day 0 (n = 3). ****P ≤ 0.0001. (F) ORF1 expression (green) in Nexmif mutant and non-mutant mouse testis at postnatal day 0 by immunofluorescence. DAPI (blue).

Similar articles

Cited by

References

    1. Stamberger H, Hammer TB, Gardella E, Vlaskamp DRM, Bertelsen B, Mandelstam S, et al. NEXMIF encephalopathy: An X-linked disorder with male and female phenotypic patterns. Genet. Med. 2021;23:363–373. doi: 10.1038/s41436-020-00988-9. - DOI - PubMed
    1. Cantagrel V, Haddad M-R, Ciofi P, Andrieu D, Lossi A-M, van Maldergem L, et al. Spatiotemporal expression in mouse brain of Kiaa 2022, a gene disrupted in two patients with severe mental retardation. Gene Express. Patterns. 2009;9:423–429. doi: 10.1016/j.gep.2009.06.001. - DOI - PubMed
    1. Ishikawa T, Miyata S, Koyama Y, Yoshikawa K, Hattori T, Kumamoto N, et al. Transient expression of Xpn, an XLMR protein related to neurite extension, during brain development and participation in neurite outgrowth. Neuroscience. 2012;214:181–191. doi: 10.1016/j.neuroscience.2012.04.030. - DOI - PubMed
    1. Martin SK, Wood RD. DNA polymerase ζ in DNA replication and repair. Nucleic Acids Res. 2019;47:8348–8361. doi: 10.1093/nar/gkz705. - DOI - PMC - PubMed
    1. Lin W, Wu X, Wang Z. A full-length cDNA of hREV3 is predicted to encode DNA polymerase zeta for damage-induced mutagenesis in humans. Mutat. Res. 1999;433:89–98. doi: 10.1016/S0921-8777(98)00065-2. - DOI - PubMed

Publication types

LinkOut - more resources