Chromatin structure undergoes global and local reorganization during murine dendritic cell development and activation
- PMID: 35969760
- PMCID: PMC9407307
- DOI: 10.1073/pnas.2207009119
Chromatin structure undergoes global and local reorganization during murine dendritic cell development and activation
Abstract
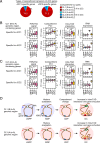
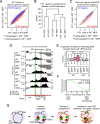
Classical dendritic cells (cDCs) are essential for immune responses and differentiate from hematopoietic stem cells via intermediate progenitors, such as monocyte-DC progenitors (MDPs) and common DC progenitors (CDPs). Upon infection, cDCs are activated and rapidly express host defense-related genes, such as those encoding cytokines and chemokines. Chromatin structures, including nuclear compartments and topologically associating domains (TADs), have been implicated in gene regulation. However, the extent and dynamics of their reorganization during cDC development and activation remain unknown. In this study, we comprehensively determined higher-order chromatin structures by Hi-C in DC progenitors and cDC subpopulations. During cDC differentiation, chromatin activation was initially induced at the MDP stage. Subsequently, a shift from inactive to active nuclear compartments occurred at the cDC gene loci in CDPs, which was followed by increased intra-TAD interactions and loop formation. Mechanistically, the transcription factor IRF8, indispensable for cDC differentiation, mediated chromatin activation and changes into the active compartments in DC progenitors, thereby possibly leading to cDC-specific gene induction. Using an infection model, we found that the chromatin structures of host defense-related gene loci were preestablished in unstimulated cDCs, indicating that the formation of higher-order chromatin structures prior to infection may contribute to the rapid responses to pathogens. Overall, these results suggest that chromatin structure reorganization is closely related to the establishment of cDC-specific gene expression and immune functions. This study advances the fundamental understanding of chromatin reorganization in cDC differentiation and activation.
Keywords: chromatin structure; dendritic cell; hematopoiesis; infection; transcription factor.
Conflict of interest statement
The authors declare no competing interest.
Figures


Similar articles
-
TGF-beta1 accelerates dendritic cell differentiation from common dendritic cell progenitors and directs subset specification toward conventional dendritic cells.J Immunol. 2010 Nov 1;185(9):5326-35. doi: 10.4049/jimmunol.0903950. Epub 2010 Sep 29. J Immunol. 2010. PMID: 20881193
-
Epigenetic control of early dendritic cell lineage specification by the transcription factor IRF8 in mice.Blood. 2019 Apr 25;133(17):1803-1813. doi: 10.1182/blood-2018-06-857789. Epub 2019 Feb 22. Blood. 2019. PMID: 30796024 Free PMC article.
-
Allograft Inflammatory Factor-1 Governs Hematopoietic Stem Cell Differentiation Into cDC1 and Monocyte-Derived Dendritic Cells Through IRF8 and RelB in vitro.Front Immunol. 2019 Feb 8;10:173. doi: 10.3389/fimmu.2019.00173. eCollection 2019. Front Immunol. 2019. PMID: 30800127 Free PMC article.
-
Dendritic cell development-History, advances, and open questions.Semin Immunol. 2015 Dec;27(6):388-96. doi: 10.1016/j.smim.2016.03.012. Epub 2016 Mar 31. Semin Immunol. 2015. PMID: 27040276 Free PMC article. Review.
-
Origin and development of classical dendritic cells.Int Rev Cell Mol Biol. 2019;349:1-54. doi: 10.1016/bs.ircmb.2019.08.002. Epub 2019 Nov 8. Int Rev Cell Mol Biol. 2019. PMID: 31759429 Review.
Cited by
-
A lncRNA identifies Irf8 enhancer element in negative feedback control of dendritic cell differentiation.Elife. 2023 Mar 14;12:e83342. doi: 10.7554/eLife.83342. Elife. 2023. PMID: 36916882 Free PMC article.
-
Transcriptional programming mediated by the histone demethylase KDM5C regulates dendritic cell population heterogeneity and function.Cell Rep. 2024 Aug 27;43(8):114506. doi: 10.1016/j.celrep.2024.114506. Epub 2024 Jul 24. Cell Rep. 2024. PMID: 39052479 Free PMC article.
-
Cohesin-mediated chromatin remodeling controls the differentiation and function of conventional dendritic cells.bioRxiv [Preprint]. 2024 Oct 30:2024.09.18.613709. doi: 10.1101/2024.09.18.613709. bioRxiv. 2024. PMID: 39345451 Free PMC article. Preprint.
-
Real-time monitoring of single dendritic cell maturation using deep learning-assisted surface-enhanced Raman spectroscopy.Theranostics. 2024 Oct 14;14(17):6818-6830. doi: 10.7150/thno.100298. eCollection 2024. Theranostics. 2024. PMID: 39479453 Free PMC article.
-
IRF8 defines the epigenetic landscape in postnatal microglia, thereby directing their transcriptome programs.Nat Immunol. 2024 Oct;25(10):1928-1942. doi: 10.1038/s41590-024-01962-2. Epub 2024 Sep 23. Nat Immunol. 2024. PMID: 39313544
References
-
- Steinman R. M., Decisions about dendritic cells: Past, present, and future. Annu. Rev. Immunol. 30, 1–22 (2012). - PubMed
-
- Mildner A., Jung S., Development and function of dendritic cell subsets. Immunity 40, 642–656 (2014). - PubMed
-
- Shortman K., Naik S. H., Steady-state and inflammatory dendritic-cell development. Nat. Rev. Immunol. 7, 19–30 (2007). - PubMed
Publication types
MeSH terms
Substances
LinkOut - more resources
Full Text Sources
Medical

