. 2022 Aug 23;119(34):e2204577119.
doi: 10.1073/pnas.2204577119. Epub 2022 Aug 15.

A photo-switchable assay system for dendrite degeneration and repair in Drosophila melanogaster

Affiliations

A photo-switchable assay system for dendrite degeneration and repair in Drosophila melanogaster

Han-Hsuan Liu et al. Proc Natl Acad Sci U S A. .

Abstract

Neurodegeneration arising from aging, injury, or diseases has devastating health consequences. Whereas neuronal survival and axon degeneration have been studied extensively, much less is known about how neurodegeneration affects dendrites, in part due to the limited assay systems available. To develop an assay for dendrite degeneration and repair, we used photo-switchable caspase-3 (caspase-Light-Oxygen-Voltage-sensing [caspase-LOV]) in peripheral class 4 dendrite arborization (c4da) neurons to induce graded neurodegeneration by adjusting illumination duration during development and adulthood in Drosophila melanogaster. We found that both developing and mature c4da neurons were able to survive while sustaining mild neurodegeneration induced by moderate caspase-LOV activation. Further, we observed active dendrite addition and dendrite regeneration in developing and mature c4da neurons, respectively. Using this assay, we found that the mouse Wallerian degeneration slow (WldS) protein can protect c4da neurons from caspase-LOV-induced dendrite degeneration and cell death. Furthermore, our data show that WldS can reduce dendrite elimination without affecting dendrite addition. In summary, we successfully established a photo-switchable assay system in both developing and mature neurons and used WldS as a test case to study the mechanisms underlying dendrite regeneration and repair.

Keywords: Drosophila; Wallerian degeneration slow protein; dendrite degeneration; dendrite regeneration; dendrite repair.


Conflict of interest statement

The authors declare no competing interest.

Figures
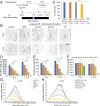
Fig. 1.
Fig. 1.
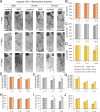
Caspase-LOV activation initiates graded dendrite degeneration in larval c4da neurons. (A) Protocol to illuminate and image larval c4da neurons expressing just tdTOM (control) or tdTOM and caspase-LOV using ppk-GAL4. Larvae were kept in the dark all the time (control; dark) or kept in the dark and illuminated at 48 h AEL for different durations. The same neurons were imaged at 24 and 72 h following illumination. (B) Representative images of c4da neurons from larva without caspase-LOV and kept in the dark (control), with caspase-LOV and kept in the dark (dark), or with caspase-LOV and illuminated for different durations. Neurons were imaged at 24 h (+24 h; Upper) and 72 h (+72 h; Lower) after illumination started. The red arrowhead indicates the soma of the same neuron imaged at 24 h. (Scale bars: 100 μm.) (C) Survival rates of c4da neurons expressing caspase-LOV decreased when illumination was extended. Survival of neurons was counted 72 h after illumination. The Kruskal–Wallis rank-sum test with Dunn’s post hoc test was further adjusted by the Benjamini–Hochberg False Discovery Rate (FDR) method for multiple independent samples. (DF) Quantifications of dendrite structures of survived c4da neurons following caspase-LOV activation, including total dendrite length (D), total dendrite tip numbers (E), and percentage of territory covered (F). The skeletal dendrite structures were predicted by in-house built deep learning models with the quantifications carried out using a python script. (G and H) Sholl analysis of dendrite complexity 24 h (G) and 72 h (H) after illumination. All conditions are significantly different from each other (P < 0.01). One-way ANOVA with Tukey’s post hoc test was used for multiple comparisons in DH. Error bars represent ± SEM (CF) or are in the shaded areas (G and H). n = 19 to 55 neurons for each experimental condition and time point as noted. n.d., not detected. ***P < 0.001.
Fig. 2.
Fig. 2.
Dendrite addition and elimination occur simultaneously following mild caspase-LOV activation. (A and B) Quantifications of changes in dendrite length (A) and dendrite tip numbers (B) of c4da neurons during the 24- to 72-h period after caspase-LOV activation. c4da neurons expressing caspase-LOV decrease growth in dendrite length and dendrite tip numbers as illumination is extended. (C) Illustration of the elimination and addition of dendrites that happened over the degeneration and repair process. (DF) Quantifications for the number of stable (D), eliminated (E), and added (F) dendrite tips over the 24- to 72-h period following caspase-LOV activation. (G and H) Quantifications for the percentage of eliminated (G) and added (H) dendrite tips over the 24- to 72-h period following caspase-LOV activation. The percentage of tips eliminated increased with longer illumination, while the percentage of tips added decreased. One-way ANOVA with Tukey’s post hoc test was used for multiple comparisons in A, B, and DH. Error bars represent ± SEM. n = 19 to 23 neurons for each experimental condition and time point as noted. n.d., not detected. *P < 0.05; **P < 0.01; ***P < 0.001.
Fig. 3.
Fig. 3.
Overexpression of WldS increased the number of stable dendrite tips and reduced the percentage of dendrite being eliminated following caspase-3–induced dendrite degeneration. (A) Representative images of c4da neurons from larvae harboring ppk-GAL4, UAS-tdTOM, UAS–caspase-LOV, and UAS-mIFP-2A-HO1 (control) or UAS-WldS (WldS). Larvae were kept in the dark or illuminated for 10 min and imaged following the protocol in Fig. 1A. The same neurons were imaged twice at 24 and 72 h following illumination. (Scale bars: 100 μm.) (BD) Quantifications of dendrite structures of surviving c4da neurons with or without caspase-LOV activation, including total dendrite length (B), total dendrite tip numbers (C), and percentage of territory covered (D). (E and F) Quantifications of changes in dendrite length (E) and dendrite tip numbers (F) of c4da neurons during the 24- to 72-h period after caspase-LOV activation. (GI) Quantifications for the number of stable (G), eliminated (H), and added (I) dendrite tips over the 24- to 72-h period following caspase-LOV activation. (J and K) Quantifications for the percentage of eliminated (J) and added (K) dendrite tips over the 24- to 72-h period following caspase-LOV activation. The percentage of tips eliminated decreased with WldS expression. Two-way ANOVA for testing the interaction between caspase-LOV activation and WldS expression was used. Square brackets mark the group that showed a statistically significant interaction. Error bars represent ± SEM. n = 16 to 30 neurons as noted. n.s., not significant. *P < 0.05; **P < 0.01; ***P < 0.001.
Fig. 4.
Fig. 4.
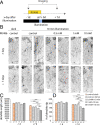
Illuminations induced graded dendrite degeneration in adult c4da neurons. (A) Protocol to feed RU486, illuminate, and image adult flies. Animals are raised in a normal light–dark cycle until moved to a food vial containing RU486 when flies are 6 d old. After a day with drugs, flies were illuminated for 10 or 30 min before being transferred back to normal food vials and kept in the dark. c4da neurons were imaged 1, 7, or 14 d after illumination. (B) Representative images of c4da neurons from adults harboring ppk-tdTOM, ppk-GS, and UAS–caspase-LOV and fed with EtOH (control) or RU486 (caspase-LOV) for a day before illumination. (Scale bar: 100 μm.) (C) Survival rates of c4da neurons at 1, 7, and 14 d after illumination. Significantly more neurons expressing caspase-LOV were found dead at 14 d after 30 min of illumination. (D and E) Quantifications of dendrite structures of survived c4da neurons, including total dendrite length (D) and total dendrite tip numbers (E). One-way ANOVA with Tukey’s post hoc test for multiple comparisons was used in CE. Error bars represent ± SEM. n = 16 to 36 neurons for each experimental condition and time point as noted. *P < 0.05; **P < 0.01; ***P < 0.001.
Fig. 5.
Fig. 5.
Expression of WldS can protect adult c4da neurons from mild dendrite degeneration. (A) Representative images of c4da neurons from adults harboring ppk-tdTOM, ppk-GS, UAS–caspase-LOV, and UAS-mIFP-2A-HO1 (control) or UAS-WldS (WldS). Adult flies were fed with RU486 for a day before illumination at 6 d after eclosion. Animals were illuminated for 10 or 30 min and imaged following the protocol in Fig. 4A. (Scale bar: 100 μm.) (BD) Survival rates of c4da neurons from animals kept in the dark (B), illuminated for 10 min (C), or illuminated for 30 min (D) were measured at 1, 7, and 14 d after illumination. (EJ) Quantifications of dendrite structures of survived c4da neurons from animals kept in the dark (E and H), illuminated for 10 min (F and I), or illuminated for 30 min (G and J). The measurements include total dendrite length (EG) and total dendrite tip numbers (HJ). One-way ANOVA with Tukey’s post hoc test for multiple comparisons was used in CE. Error bars represent ± SEM. n = 6 to 38 neurons for each experimental condition and time point as noted. *P < 0.05; **P < 0.01.
Fig. 6.
Fig. 6.
A low level of drug induction induced mild dendrite degeneration in the mature neurons. (A) Protocol to feed RU486, illuminate, and image adult flies. After a day with varying concentrations of drugs or EtOH (control), flies were kept in the dark or illuminated for 10 min before being transferred back to normal food vials and kept in the dark. c4da neurons were imaged 1 d before and 7 d after illumination. (B) Representative images of c4da neurons from adults harboring ppk-tdTOM, ppk-GS, and UAS–caspase-LOV and fed with EtOH (control) or RU486 (caspase-LOV) for a day before illumination. The red arrowheads indicate the regenerated dendrites in the c4da neurons 7 d after illumination. (Scale bar: 100 μm.) (C and D) Quantifications of dendrite structures of surviving c4da neurons, including total dendrite length (C) and total dendrite tip numbers (D). One-way ANOVA with Tukey’s post hoc test for multiple comparisons was used in C and D. Error bars represent ± SEM. n = 19 to 46 neurons for each experimental condition and time point as noted. **P < 0.01; ***P < 0.001.
Fig. 7.
Fig. 7.
Adult c4da neurons can regenerate following the activation of lower expression of caspase-LOV. (A and B) Quantifications of changes in dendrite length (A) and dendrite tip numbers (B) of c4da neurons between 1 d before (−1 d) and 7 d after (+7 d) caspase-LOV activation. c4da neurons expressing caspase-LOV exhibited decreases in dendrite length and dendrite tip numbers with 10 min of illumination. (C and D) Quantifications of +7/−1 d ratios of dendrite length (C) and tip numbers (D) for the same neurons following 10 min of illumination. (EG) Quantifications for the number of stable (E), eliminated (F), and added (G) dendrite tips over the −1- to +7-d period following caspase-LOV activation. (H and I) Quantifications for the percentage of eliminated (H) and added (I) dendrite tips over the −1- to +7-d period following caspase-LOV activation. One-way ANOVA with Tukey’s post hoc test for multiple comparisons was used in AI. Error bars represent ± SEM. n = 12 to 31 neurons for each experimental condition and time point as noted. *P < 0.05; **P < 0.01; ***P < 0.001.
Fig. 8.
Fig. 8.
Expression of WldS decreased dendrite degeneration without changing dendrite regeneration. (A) Representative images of c4da neurons from adults harboring ppk-tdTOM, ppk-GS, UAS–caspase-LOV, and UAS-mIFP-2A-HO1 (control) or UAS-WldS (WldS). Adult flies were fed with 1 mM RU486 for a day before illumination at 6 d after eclosion. Animals were illuminated for 10 min and imaged following the protocol Fig. 6A. (Scale bar: 100 μm.) (B and C) Quantifications of dendrite structures of c4da neurons, including total dendrite length (B) and total dendrite tip numbers (C). (D and E) Quantifications of changes in dendrite length (D) and dendrite tip numbers (E) of c4da neurons between 1 d before (−1 d) and 7 d after (+7 d) caspase-LOV activation. (F) Quantifications for the number of stable (Left), eliminated (Center), and added (Right) dendrite tips over the −1- to +7-d period following caspase-LOV activation. (G) Quantifications for the percentage of eliminated (Left) and added (Right) dendrite tips over the −1- to +7-d period following caspase-LOV activation. Student’s t test was used in BG. Error bars represent ± SEM. n = 11 to 22 neurons for each experimental condition and time point as noted. *P < 0.05.

Similar articles

Cited by

References

    1. Kulkarni V. A., Firestein B. L., The dendritic tree and brain disorders. Mol. Cell. Neurosci. 50, 10–20 (2012). - PubMed
    1. Kweon J. H., Kim S., Lee S. B., The cellular basis of dendrite pathology in neurodegenerative diseases. BMB Rep. 50, 5–11 (2017). - PMC - PubMed
    1. Mulherkar S., et al. , RhoA-ROCK inhibition reverses synaptic remodeling and motor and cognitive deficits caused by traumatic brain injury. Sci. Rep. 7, 10689 (2017). - PMC - PubMed
    1. Penzes P., Cahill M. E., Jones K. A., VanLeeuwen J.-E., Woolfrey K. M., Dendritic spine pathology in neuropsychiatric disorders. Nat. Neurosci. 14, 285–293 (2011). - PMC - PubMed
    1. Xiong Y., Mahmood A., Chopp M., Remodeling dendritic spines for treatment of traumatic brain injury. Neural Regen. Res. 14, 1477–1480 (2019). - PMC - PubMed

Publication types