Homeostatic regulation of extracellular signal-regulated kinase 1/2 activity and axonal Kv7.3 expression by prolonged blockade of hippocampal neuronal activity
- PMID: 35966206
- PMCID: PMC9366003
- DOI: 10.3389/fncel.2022.838419
Homeostatic regulation of extracellular signal-regulated kinase 1/2 activity and axonal Kv7.3 expression by prolonged blockade of hippocampal neuronal activity
Abstract
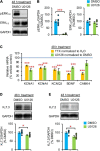
Homeostatic plasticity encompasses the mechanisms by which neurons stabilize their synaptic strength and excitability in response to prolonged and destabilizing changes in their network activity. Prolonged activity blockade leads to homeostatic scaling of action potential (AP) firing rate in hippocampal neurons in part by decreased activity of N-Methyl-D-Aspartate receptors and subsequent transcriptional down-regulation of potassium channel genes including KCNQ3 which encodes Kv7.3. Neuronal Kv7 channels are mostly heterotetramers of Kv7.2 and Kv7.3 subunits and are highly enriched at the axon initial segment (AIS) where their current potently inhibits repetitive and burst firing of APs. However, whether a decrease in Kv7.3 expression occurs at the AIS during homeostatic scaling of intrinsic excitability and what signaling pathway reduces KCNQ3 transcript upon prolonged activity blockade remain unknown. Here, we report that prolonged activity blockade in cultured hippocampal neurons reduces the activity of extracellular signal-regulated kinase 1/2 (ERK1/2) followed by a decrease in the activation of brain-derived neurotrophic factor (BDNF) receptor, Tropomyosin receptor kinase B (TrkB). Furthermore, both prolonged activity blockade and prolonged pharmacological inhibition of ERK1/2 decrease KCNQ3 and BDNF transcripts as well as the density of Kv7.3 and ankyrin-G at the AIS. Collectively, our findings suggest that a reduction in the ERK1/2 activity and subsequent transcriptional down-regulation may serve as a potential signaling pathway that links prolonged activity blockade to homeostatic control of BDNF-TrkB signaling and Kv7.3 density at the AIS during homeostatic scaling of AP firing rate.
Keywords: ERK; Kv7; ankyrin-G; axon initial segment; homeostatic plasticity.
Copyright © 2022 Baculis, Kesavan, Weiss, Kim, Tracy, Ouyang, Tsai and Chung.
Conflict of interest statement
The authors declare that the research was conducted in the absence of any commercial or financial relationships that could be construed as a potential conflict of interest.
Figures


Similar articles
-
N-methyl-D-aspartate receptors mediate activity-dependent down-regulation of potassium channel genes during the expression of homeostatic intrinsic plasticity.Mol Brain. 2015 Jan 20;8:4. doi: 10.1186/s13041-015-0094-1. Mol Brain. 2015. PMID: 25599691 Free PMC article.
-
NMDA receptors and L-type voltage-gated Ca²⁺ channels mediate the expression of bidirectional homeostatic intrinsic plasticity in cultured hippocampal neurons.Neuroscience. 2014 Sep 26;277:610-23. doi: 10.1016/j.neuroscience.2014.07.038. Epub 2014 Jul 31. Neuroscience. 2014. PMID: 25086314
-
M-current inhibition rapidly induces a unique CK2-dependent plasticity of the axon initial segment.Proc Natl Acad Sci U S A. 2017 Nov 21;114(47):E10234-E10243. doi: 10.1073/pnas.1708700114. Epub 2017 Nov 6. Proc Natl Acad Sci U S A. 2017. PMID: 29109270 Free PMC article.
-
Made for "anchorin": Kv7.2/7.3 (KCNQ2/KCNQ3) channels and the modulation of neuronal excitability in vertebrate axons.Semin Cell Dev Biol. 2011 Apr;22(2):185-92. doi: 10.1016/j.semcdb.2010.10.001. Epub 2010 Oct 19. Semin Cell Dev Biol. 2011. PMID: 20940059 Free PMC article. Review.
-
Neural KCNQ (Kv7) channels.Br J Pharmacol. 2009 Apr;156(8):1185-95. doi: 10.1111/j.1476-5381.2009.00111.x. Epub 2009 Mar 9. Br J Pharmacol. 2009. PMID: 19298256 Free PMC article. Review.
Cited by
-
Excitatory and inhibitory hippocampal neurons differ in their homeostatic adaptation to chronic M-channel modulation.Front Mol Neurosci. 2022 Oct 14;15:972023. doi: 10.3389/fnmol.2022.972023. eCollection 2022. Front Mol Neurosci. 2022. PMID: 36311018 Free PMC article.
References
-
- Adams J. P., Sweatt J. D. (2002). Molecular psychology: roles for the ERK MAP kinase cascade in memory. Annu. Rev. Pharmacol. Toxicol. 42 135–163. - PubMed
-
- Aiken S. P., Lampe B. J., Murphy P. A., Brown B. S. (1995). Reduction of spike frequency adaptation and blockade of M-current in rat CA1 pyramidal neurones by linopirdine (DuP 996), a neurotransmitter release enhancer. Br. J. Pharmacol. 115 1163–1168. 10.1111/j.1476-5381.1995.tb15019.x - DOI - PMC - PubMed
-
- Atkins C. M., Selcher J. C., Petraitis J. J., Trzaskos J. M., Sweatt J. D. (1998). The MAPK cascade is required for mammalian associative learning. Nat. Neurosci. 1 602–609. - PubMed
Associated data
Grants and funding
LinkOut - more resources
Full Text Sources
Miscellaneous

