Time to match; when do homologous chromosomes become closer?
- PMID: 35960388
- PMCID: PMC9674740
- DOI: 10.1007/s00412-022-00777-0
Time to match; when do homologous chromosomes become closer?
Abstract
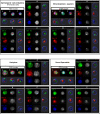
In most eukaryotes, pairing of homologous chromosomes is an essential feature of meiosis that ensures homologous recombination and segregation. However, when the pairing process begins, it is still under investigation. Contrasting data exists in Mus musculus, since both leptotene DSB-dependent and preleptotene DSB-independent mechanisms have been described. To unravel this contention, we examined homologous pairing in pre-meiotic and meiotic Mus musculus cells using a three-dimensional fluorescence in situ hybridization-based protocol, which enables the analysis of the entire karyotype using DNA painting probes. Our data establishes in an unambiguously manner that 73.83% of homologous chromosomes are already paired at premeiotic stages (spermatogonia-early preleptotene spermatocytes). The percentage of paired homologous chromosomes increases to 84.60% at mid-preleptotene-zygotene stage, reaching 100% at pachytene stage. Importantly, our results demonstrate a high percentage of homologous pairing observed before the onset of meiosis; this pairing does not occur randomly, as the percentage was higher than that observed in somatic cells (19.47%) and between nonhomologous chromosomes (41.1%). Finally, we have also observed that premeiotic homologous pairing is asynchronous and independent of the chromosome size, GC content, or presence of NOR regions.
Keywords: Chromosome territories; FISH; Homologous chromosomes; Homologous pairing; Meiosis; Premeiotic cells.
© 2022. The Author(s).
Conflict of interest statement
The authors declare no competing interests.
Figures


Similar articles
-
Aspects of three-dimensional chromosome reorganization during the onset of human male meiotic prophase.J Cell Sci. 1998 Aug;111 ( Pt 16):2337-51. doi: 10.1242/jcs.111.16.2337. J Cell Sci. 1998. PMID: 9683629
-
Chromosome ends initiate homologous chromosome pairing during rice meiosis.Plant Physiol. 2024 Jul 31;195(4):2617-2634. doi: 10.1093/plphys/kiae152. Plant Physiol. 2024. PMID: 38478471
-
Centromere and telomere redistribution precedes homologue pairing and terminal synapsis initiation during prophase I of cattle spermatogenesis.Cytogenet Cell Genet. 2001;93(3-4):304-14. doi: 10.1159/000057002. Cytogenet Cell Genet. 2001. PMID: 11528130
-
Premeiotic events and meiotic chromosome pairing.Symp Soc Exp Biol. 1984;38:87-121. Symp Soc Exp Biol. 1984. PMID: 6400221 Review.
-
Meiosis.WormBook. 2017 May 4;2017:1-43. doi: 10.1895/wormbook.1.178.1. WormBook. 2017. PMID: 26694509 Free PMC article. Review.
Cited by
-
Recent advances in mechanisms ensuring the pairing, synapsis and segregation of XY chromosomes in mice and humans.Cell Mol Life Sci. 2024 Apr 23;81(1):194. doi: 10.1007/s00018-024-05216-0. Cell Mol Life Sci. 2024. PMID: 38653846 Free PMC article. Review.
-
Formation and resolution of meiotic chromosome entanglements and interlocks.J Cell Sci. 2024 Jul 1;137(13):jcs262004. doi: 10.1242/jcs.262004. Epub 2024 Jul 10. J Cell Sci. 2024. PMID: 38985540 Review.
-
Meiotic Recognition of Evolutionarily Diverged Homologs: Chromosomal Hybrid Sterility Revisited.Mol Biol Evol. 2023 Apr 4;40(4):msad083. doi: 10.1093/molbev/msad083. Mol Biol Evol. 2023. PMID: 37030001 Free PMC article.
-
The courtship choreography of homologous chromosomes: timing and mechanisms of DSB-independent pairing.Front Cell Dev Biol. 2023 Jun 12;11:1191156. doi: 10.3389/fcell.2023.1191156. eCollection 2023. Front Cell Dev Biol. 2023. PMID: 37377734 Free PMC article. Review.
-
Modeling homologous chromosome recognition via nonspecific interactions.Proc Natl Acad Sci U S A. 2024 May 14;121(20):e2317373121. doi: 10.1073/pnas.2317373121. Epub 2024 May 9. Proc Natl Acad Sci U S A. 2024. PMID: 38722810 Free PMC article.
References
Publication types
MeSH terms
LinkOut - more resources
Full Text Sources
Miscellaneous

