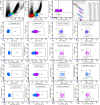
Flow-Cytometry Intracellular Detection and Quantification of HIV1 p24 Antigen and Immunocheckpoint Molecules in T Cells among HIV/AIDS Patients
- PMID: 35958525
- PMCID: PMC9359413
- DOI: 10.2147/HIV.S374369
Flow-Cytometry Intracellular Detection and Quantification of HIV1 p24 Antigen and Immunocheckpoint Molecules in T Cells among HIV/AIDS Patients
Abstract
Introduction: HIV p24 antigen-positive T cells measured by flow cytometry (FCM) correlate directly with HIV viral load, inversely with CD4 + T cells, and decrease with antiretroviral therapy (ART). However, the sensitivity of FCM assays depends on the protocol of intracellular staining. Therefore, this study aimed to evaluate the diagnostic performance of our FCM protocol for detection of HIV p24-positive T cells and measure the level of immunocheckpoint molecules (PD1 and TIM3) in T cells.
Methods: The study was conducted at the University of Leipzig hospital between January 2020 and November 2020. Viremic and ART-suppressed HIV-positive patients and negative controls were included in this study. HIV1 p24 KC57-, p24 28B7-, PD1-, and TIM3-positive CD4 and CD3 T cells were analyzed from whole blood using a BD FACS Canto II flow cytometer equipped with FACSDiva software. HIV1 p24 antigen FCM results were compared with HIV1 RNA viral load results measured by Alinity M assays on the fully automated random-access platform. We analyzed the data using SPSS 20.
Results: The absolute CD4 + and CD4 +:CD8 + T-cells ratio showed a significant inverse correlation with HIV1 viral load. Moreover, the absolute CD4+ T-cells count showed a significant inverse correlation with p24 KC57-positive CD4 T cells. The percentage of p24 KC57, p24 28B7, and double-positive CD4 T cells showed significant correlation with HIV1 viral load. PD1 expressing CD4 T cells were higher in ART-viremic cases than controls, while TIM3-expressing CD4 T cells were lower in ART-viremic cases than controls. Sensitivity, specificity, PPV, and NPV of p24 KC57-positive CD4 T cells were 64%, 82%, 78%, and 69%, respectively, for the diagnosis of HIV infection and 55%, 73%, 40%, and 83%, respectively, for treatment monitoring.
Conclusion: Our protocol showed moderate performance for the diagnosis of HIV infection and treatment monitoring. Therefore, the p24 KC57 but not the p24 28B7 clone could be considered as a simple alternative method for rapid diagnosis of HIV infections and treatment monitoring, particularly in low- and middle-income countries.
Keywords: HIV p24 28B7; HIV p24 KC57; PD1; TIM3; diagnosis; flow cytometry; human immunodeficiency virus; treatment monitoring.
© 2022 Tessema et al.
Conflict of interest statement
The authors declare no conflicts of interest in this work.
Figures


Similar articles
-
[Detection of intracellular HIV-1 p24 antigen in CD4(+);T cells by flow cytometry and its application for auxiliary diagnosis of HIV-1 infection].Xi Bao Yu Fen Zi Mian Yi Xue Za Zhi. 2014 Apr;30(4):426-9. Xi Bao Yu Fen Zi Mian Yi Xue Za Zhi. 2014. PMID: 24721412 Chinese.
-
[Deep lung--cellular reaction to HIV].Rev Port Pneumol. 2007 Mar-Apr;13(2):175-212. Rev Port Pneumol. 2007. PMID: 17492233 Review. Portuguese.
-
Detection of circulating p24 antigen-positive CD4+ cells during HIV infection by flow cytometry.AIDS. 1992 Oct;6(10):1121-5. doi: 10.1097/00002030-199210000-00009. AIDS. 1992. PMID: 1361340
-
Human immunodeficiency virus type 1 (HIV-1)-specific CD4+ T cells that proliferate in vitro detected in samples from most viremic subjects and inversely associated with plasma HIV-1 levels.J Virol. 2004 Nov;78(22):12638-46. doi: 10.1128/JVI.78.22.12638-12646.2004. J Virol. 2004. PMID: 15507650 Free PMC article.
-
Measurement of HIV-1 p24 antigen by signal-amplification-boosted ELISA of heat-denatured plasma is a simple and inexpensive alternative to tests for viral RNA.AIDS Rev. 2002 Apr-Jun;4(2):83-92. AIDS Rev. 2002. PMID: 12152521 Review.
Cited by
-
Design and validation of novel flow cytometry panels to analyze a comprehensive range of peripheral immune cells in mice.Front Immunol. 2024 Aug 13;15:1432816. doi: 10.3389/fimmu.2024.1432816. eCollection 2024. Front Immunol. 2024. PMID: 39206202 Free PMC article.
References
-
- World Health Organisation. Global progress report on HIV, viral hepatitis and sexually transmitted infections, 2021; 2021. Available from: https://www.who.int/publications/i/item/9789240027077. Accessed July 25, 2022.
Grants and funding
LinkOut - more resources
Full Text Sources
Research Materials

