. 2022 Jul 31;23(15):8510.
doi: 10.3390/ijms23158510.

Emodin Sensitizes Cervical Cancer Cells to Vinblastine by Inducing Apoptosis and Mitotic Death

Affiliations

Emodin Sensitizes Cervical Cancer Cells to Vinblastine by Inducing Apoptosis and Mitotic Death

Wojciech Trybus et al. Int J Mol Sci. .

Abstract

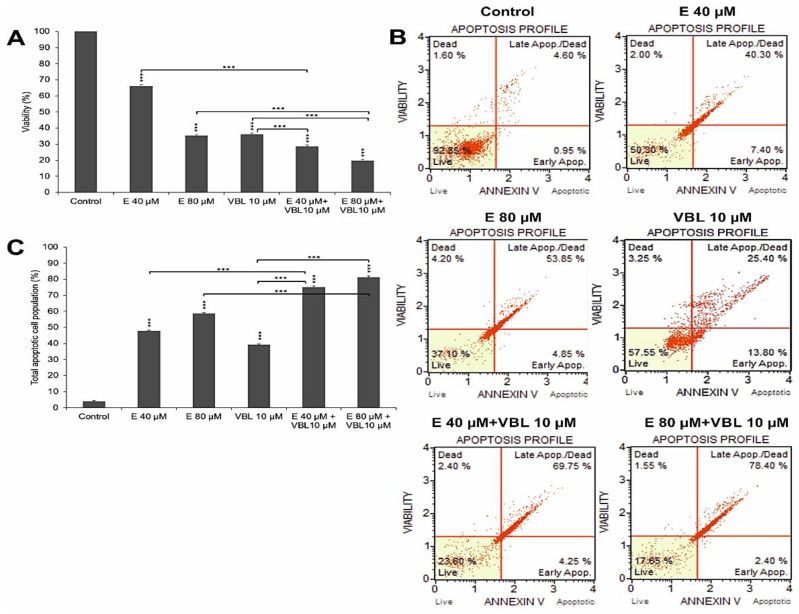
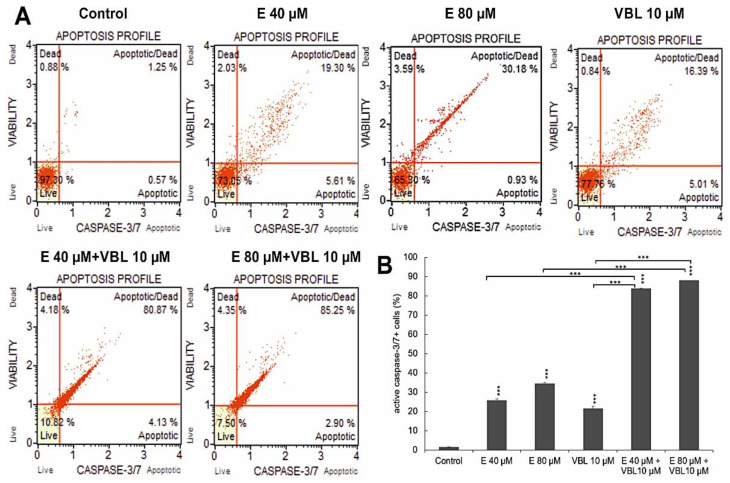
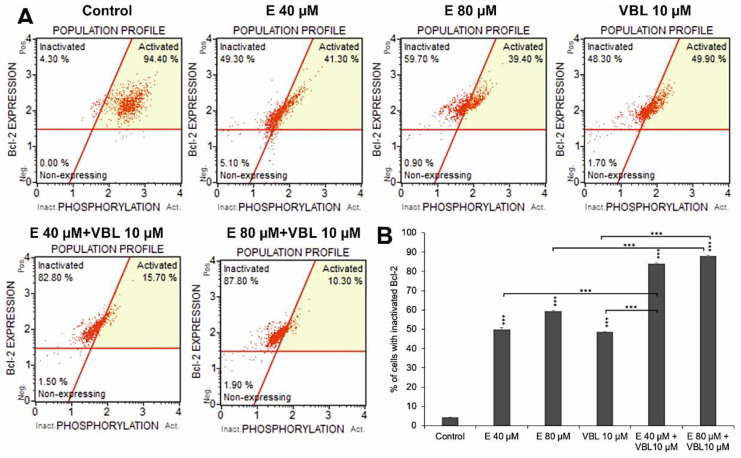
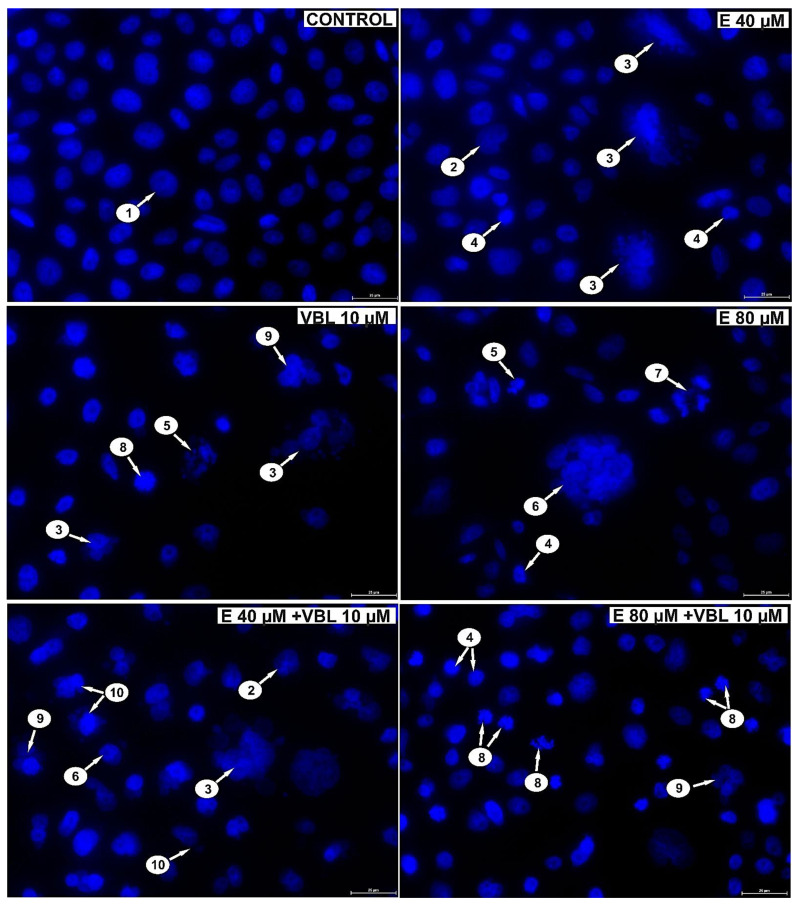
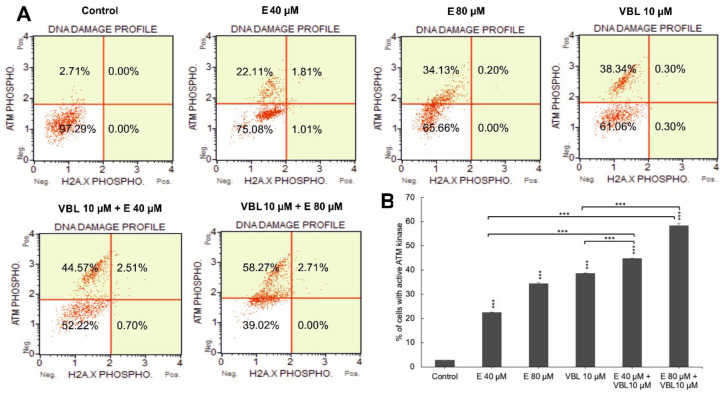
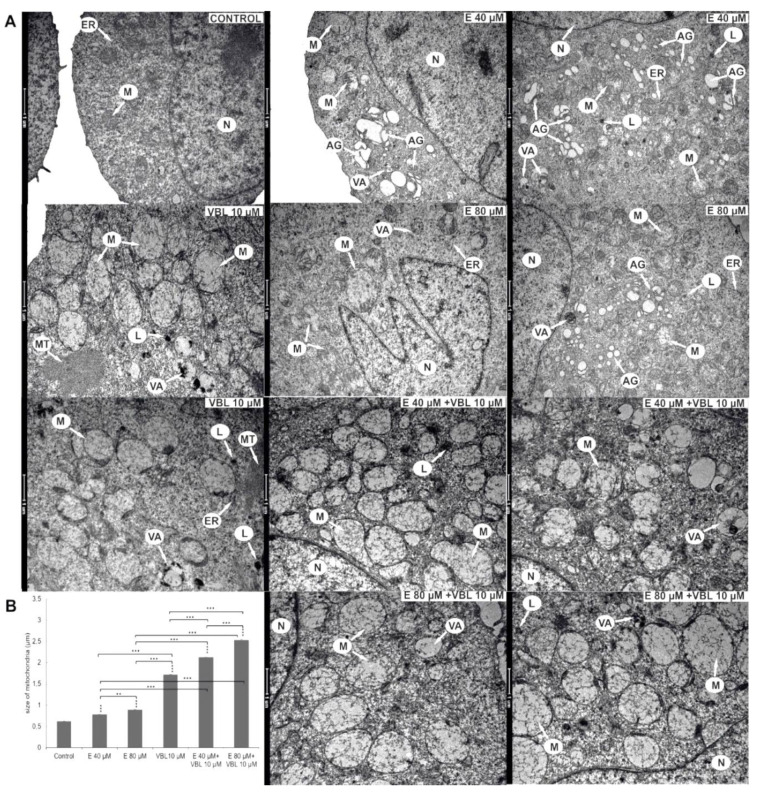
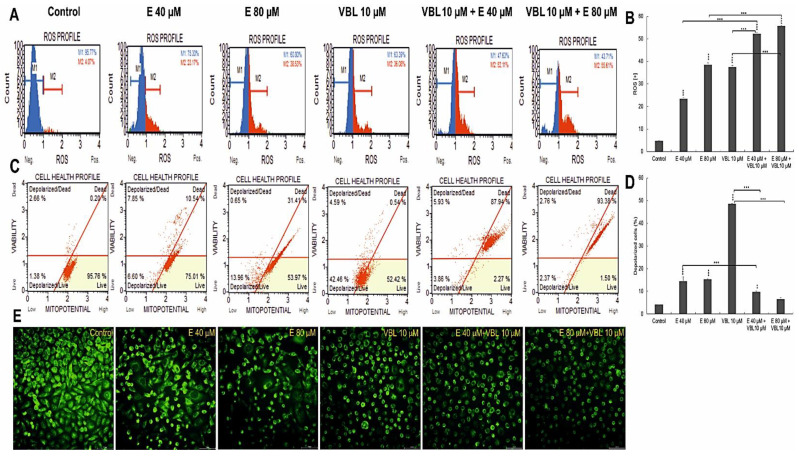
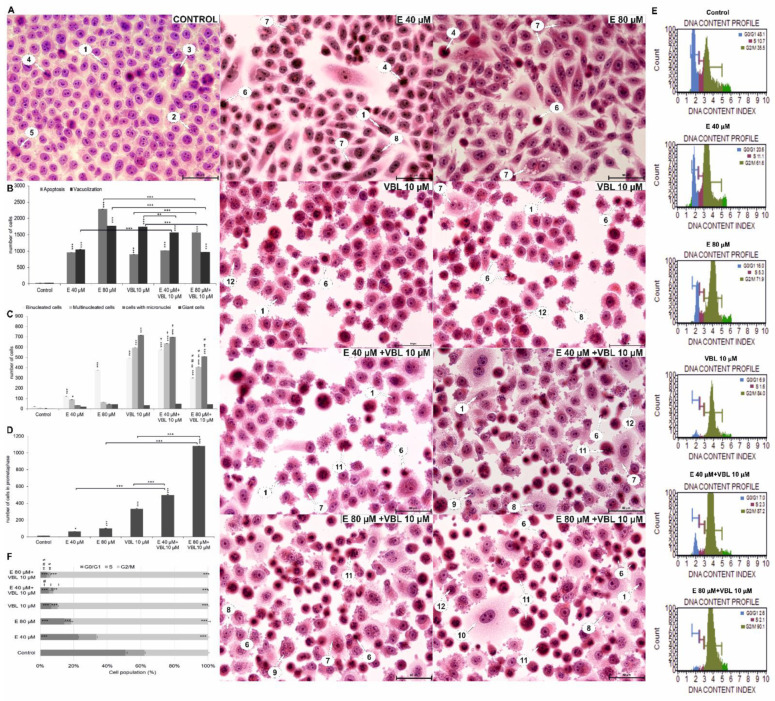
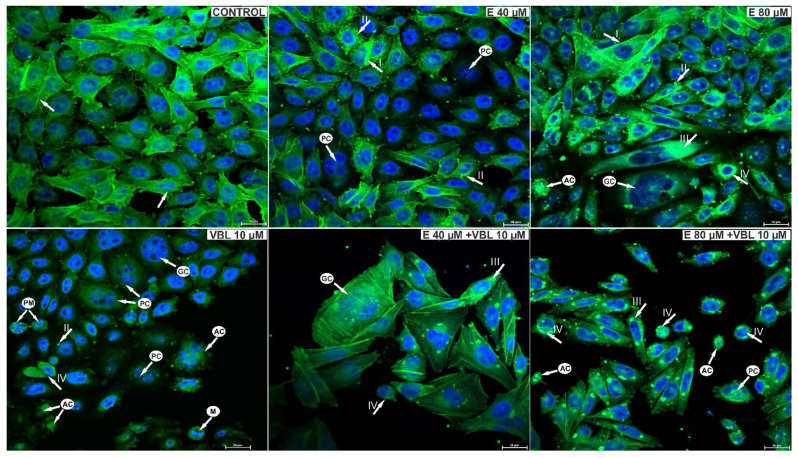
In recent years, studies on the effects of combining novel plant compounds with cytostatics used in cancer therapy have received considerable attention. Since emodin sensitizes tumor cells to chemotherapeutics, we evaluated changes in cervical cancer cells after its combination with the antimitotic drug vinblastine. Cellular changes were demonstrated using optical, fluorescence, confocal and electron microscopy. Cell viability was assessed by MTT assay. The level of apoptosis, caspase 3/7, Bcl-2 protein, ROS, mitochondrial membrane depolarization, cell cycle and degree of DNA damage were analyzed by flow cytometry. The microscopic image showed indicators characteristic for emodin- and vinblastine-induced mitotic catastrophe, i.e., multinucleated cells, giant cells, cells with micronuclei, and abnormal mitotic figures. These compounds also increased blocking of cells in the G2/M phase, and the generated ROS induced swelling and mitochondrial damage. This translated into the growth of apoptotic cells with active caspase 3/7 and inactivation of Bcl-2 protein and active ATM kinase. Emodin potentiated the cytotoxic effect of vinblastine, increasing oxidative stress, mitotic catastrophe and apoptosis. Preliminary studies show that the combined action of both compounds, may constitute an interesting form of anticancer therapy.

Keywords: apoptosis; emodin; mitotic death; oxidative stress; vinblastine.


Conflict of interest statement

The authors declare no conflict of interest.

Figures

Figure 1
Figure 1
Emodin and vinblastine decrease viability and induce apoptosis in HeLa cells. Cells treated for 24 h with 40 and 80 µM concentrations of emodin, vinblastine (10 µM), and the combined action of 10 µM vinblastine with emodin at concentrations of 40 and 80 µM. (A) Effect of emodin and vinblastine on cell viability as assessed by MTT test. (B) Level of apoptosis assessed by annexin V-PE/7-AAD staining. Live cells (annexin V-PE-/7-AAD-), cells in early- (annexin V-PE+/7-AAD-) and late-stage apoptosis (annexin V-PE+/7-AAD+), and dead cells (annexin V-PE-/7-AAD+). (C) Percentage of apoptotic cells induced by tested agents. Differences statistically confirmed at: *** p < 0.001.
Figure 2
Figure 2
Changes in the caspase 3/7 activity induced by emodin and vinblastine. (A) Live cells (caspase 3/7-/7-AAD-), cells in early (caspase 3/7+/7-AAD-) and late apoptosis (caspase 3/7+/7-AAD+), dead cells (caspase 3/7-/7-AAD+). (B) Percentage of cells with active caspase 3/7. Differences statistically confirmed at: *** p < 0.001.
Figure 3
Figure 3
Dependence on the concentration of emodin and vinblastine percent of cells with inactivated Bcl-2 protein (A). Percentage of cells with Bcl-2 protein inactivation (B). The data in the graph show the mean ± SE of three independent experiments. Differences statistically confirmed at: *** p < 0.001.
Figure 4
Figure 4
Emodin and vinblastine induce mitotic death. Evaluation of cell nucleus morphology using DAPI staining. HeLa cells incubated for 24 h with 40 and 80 µM emodin, 10 µM vinblastine and combined action of emodin and vinblastine (E 40 and 80 µM + 10 µM VBL). Explanation of markings: 1—interphase cells with normal nuclear morphology, 2—cells with altered cell nucleus shape, 3—multinucleated giant cells with micronuclei, 4—apoptotic cells with chromatin condensation, 5—apoptotic cells with nuclear fragmentation, 6—multinucleated giant cells, 7—abnormal mitotic figures (tripolar anaphase), 8—cells with abnormal chromosome segregation as an expression of cytoskeletal damage, 9—multinucleated cells, 10—cells with micronuclei. Magnification × 400.
Figure 5
Figure 5
Degree of DNA damage induced by emodin and vinblastine. (A) HeLa cells treated for 24 h with emodin (40 and 80 µM), vinblastine (10 µM), and emodin and vinblastine (E 40 and 80 µM + 10 µM VBL) to induce DNA damage. Cells were stained with anti-phospho-histone H2A.X (Ser139) and anti-phospho-ATM (Ser1981) antibodies. (B) Percentage of cells with active ATM kinase. Data representative of three parallel experiments correspond to mean ± standard error (S.E.) values. Differences were statistically confirmed at: *** p < 0.001.
Figure 6
Figure 6
Ultrastructural changes in HeLa cells after 24 h of treatment with emodin, vinblastine and the combined action of both compounds. (A) Control—a cell with the correct nucleus and organelles with normal structure. Cells after the action of emodin (E 40 µM) with an increased number of Golgi apparatuses with swollen cisterns. Cells treated with emodin (E 80 µM)—extensive Golgi apparatuses with dispersed cisterns, numerous autophagic vacuoles, primary lysosomes and swollen mitochondria. Cells treated with vinblastine (VBL 10 µM)—the presence of swollen mitochondria with damaged cristae, autophagic vacuoles, lysosomes and cytoskeleton elements. Cells after the combined action of the compounds (E 40 µM and 80 µM + VBL 10 µM)—highly swollen and completely electron-transparent mitochondria with cristae drawn into the membrane, numerous lysosomes and autophagic vacuoles. Explanation of abbreviations: N—cell nucleus, M—mitochondria, VA—autophagic vacuoles, AG—Golgi apparatus, L—primary lysosomes, MT—microtubules, ER—rough endoplasmic reticulum. Magnification × 11,500. (B) Change in mitochondrial size as a function of the concentration of the test compounds. Data correspond to mean values ± standard error (S.E.) and are representative of three parallel experiments. The differences were statistically confirmed at: ** p < 0.01, *** p < 0.001.
Figure 7
Figure 7
Assessment of ROS production and changes in mitochondrial potential in cells after treatment with vinblastine and emodin. (A) Generation of reactive oxygen species by 40 and 80 µM emodin, vinblastine (10 µM) and emodin in combination with vinblastine (E 40 µM + 10 µM VBL and E 80 µM+10 µM VBL). M1: negative cells, ROS (−); M2: cells with ROS activity, ROS (+). (B) Percentage of ROS (+) cells induced by test compounds. The degree of ROS production in HeLa cells was determined in comparison with the control. (C) Changes in mitochondrial membrane potential depending on the concentration of vinblastine and emodin. (D) Percentage of cells with mitochondrial membrane depolarization. Each sample was analyzed in triplicate. The differences were statistically confirmed at: ** p < 0.01, *** p < 0.001. (E) Analysis of changes in mitochondrial activity (rhodamine 123 staining). Visible control cells with high mitochondrial membrane potential and cells with reduced emission of fluorescent dye after the incubation with emodin, vinblastine and after combined action of compounds. Magnification × 400.
Figure 8
Figure 8
Morphological changes and changes in the cell cycle in Hela cells treated with emodin, vinblastine and their combined effects. (A) Cells stained with hematoxylin and eosin (H&E method). Control: cells in interphase and during cell division. Emodin 40 and 80 µM: numerous cells with cytoplasmic vacuolization, binuclear cells, multinucleated cells, and apoptotic cells. Vinblastine 10 µM: a large number of cells with micronuclei and cells with a disturbed formation of chromosomes. Combined action of emodin (40 and 80 µM) and vinblastine (10 µM): very numerous polynuclear cells, cells with micronuclei and cells with condensed chromosomes dispersed in the cytoplasm. 1—interphase; 2—prophase; 3—prometaphase; 4—metaphase; 5—telophase; 6—apoptosis; 7—vacuolization; 8—binuclear cells; 9—polynuclear cells; 10—giant cells; 11—cells with abnormal chromosome segregation; 12—cells with micronuclei. Magnification × 400. Comparison of the number of apoptotic cells and cells with cytoplasmic vacuolization (B) and indicators of mitotic catastrophe (C), i.e., the number of binucleated, multinucleated, giant cells and cells with micronuclei of HeLa line after 24 h of exposure to emodin (40 and 80 µM), vinblastine (10 µM), and their combined action (E 40 and 80 µM + 10 µM VBL). The symbol † represents statistically significant change (p < 0.0001) with emodin at a dose of 40 µM compared to cells treated by the combined action of emodin (40 µM) and vinblastine at a dose of 10 µM. The symbol ‡ represents statistically significant change (p ≤ 0.0001) with emodin at a dose of 80 µM compared to cells treated with the combined action of emodin (80 µM) and vinblastine at a dose of 10 µM. The symbol # represents statistically significant change (p < 0.05) with vinblastine in doses of 10 µM compared to cells treated with the combined action of emodin (40 µM) and vinblastine at a dose of 10 µM. The symbol ≠ represents statistically significant change (p < 0.0001) with vinblastine at a dose of 10 µM compared to cells treated with the combined action of emodin (80 µM) and vinblastine at a dose of 10 µM. (D) Number of cells with prometaphase as a function of the concentration of test compounds. (E) Emodin and vinblastine induce cell cycle arrest at the G2/M phase. Histograms showing cell distribution over the cycle after treatment with emodin and vinblastine. (F) Percentage of cells in the cell cycle as analyzed by flow cytometry. The symbol † represents statistically significant change (p < 0.0001) with emodin at a dose of 40 µM compared to cells treated with combined action of emodin (40 µM) and vinblastine at a dose of 10 µM. The symbol ‡ represents statistically significant change (p ≤ 0.0001) with emodin at a dose of 80 µM compared to cells treated with the combined action of emodin (80 µM) and vinblastine at a dose of 10 µM. The symbol # represents statistically significant change (p < 0.05) with vinblastine at a dose of 10 µM compared to cells treated with the combined action of emodin (40 µM) and vinblastine at a dose of 10 µM. The symbol ≠ represents statistically significant change (p < 0.0001) with vinblastine at a dose of 10 µM compared to cells treated with the combined action of emodin (80 µM) and vinblastine at a dose of 10 µM. The data in the graph shows the mean ± SE of three independent experiments. Differences statistically confirmed at: * p < 0.05; ** p < 0.01; *** p < 0.001.
Figure 9
Figure 9
Visualization of cytoskeleton elements in cells labeled with FITC-conjugated phalloidin and cell nuclei using DAPI. Control cells, with regular distribution of actin filaments (arrow) and the correct shape of the cell nuclei. Cells treated with 40 μM emodin, with increased fluorescence of actin filaments, often marginally distributed (arrow I) and small deposits of actin in the cytoplasm (arrow II). Cells treated with 80 µM emodin with reorganization of the cytoskeleton and actin deposited in the cytoplasm (arrow III). Cells in prometaphase (arrow IV), rounded, with damaged cytoskeleton after treatment with vinblastine (10 µM). Cells after the combined action of vinblastine (10 µM) and emodin (40 µM and 80 µM) with visible damage to the cytoskeleton and the presence of actin deposits. Also visible are rounded cells with condensed actin, giant multinucleated cells with reorganization of the cytoskeleton as an expression of a mitotic catastrophe and apoptotic cells. Explanation of abbreviations: PM—prometaphase cells; M—cells in metaphase; PC—multinucleated cells; GC—giant cells; AC—apoptotic cells. Magnification × 400.

Similar articles

Cited by

References

    1. Mitra T., Elangovan S. Cervical cancer development, chemoresistance, and therapy: A snapshot of involvement of microRNA. Mol. Cell. Biochem. 2021;476:4363–4385. doi: 10.1007/s11010-021-04249-4. - DOI - PubMed
    1. Sarenac T., Mikov M. Cervical Cancer, Different Treatments and Importance of Bile Acids as Therapeutic Agents in This Disease. Front. Pharmacol. 2019;10:484. doi: 10.3389/fphar.2019.00484. - DOI - PMC - PubMed
    1. Sathyanarayanan A., Chandrasekaran K.S., Karunagaran D. microRNA-145 modulates epithelial-mesenchymal transition and suppresses proliferation, migration and invasion by targeting SIP1 in human cervical cancer cells. Cell. Oncol. 2017;40:119–131. doi: 10.1007/s13402-016-0307-3. - DOI - PubMed
    1. Asiaf A., Ahmad S.T., Mohammad S.O., Zargar M.A. Review of the current knowledge on the epidemiology, pathogenesis, and prevention of human papillomavirus infection. Eur. J. Cancer Prev. Off. J. Eur. Cancer Prev. Organ. 2014;23:206–224. doi: 10.1097/CEJ.0b013e328364f273. - DOI - PubMed
    1. Bayat Mokhtari R., Homayouni T.S., Baluch N., Morgatskaya E., Kumar S., Das B., Yeger H. Combination therapy in combating cancer. Oncotarget. 2017;8:38022–38043. doi: 10.18632/oncotarget.16723. - DOI - PMC - PubMed