. 2022 Aug 2;11(15):2382.
doi: 10.3390/cells11152382.

Therapeutic Targeting Notch2 Protects Bone Micro-Vasculatures from Methotrexate Chemotherapy-Induced Adverse Effects in Rats

Affiliations

Therapeutic Targeting Notch2 Protects Bone Micro-Vasculatures from Methotrexate Chemotherapy-Induced Adverse Effects in Rats

Yaser Peymanfar et al. Cells. .

Abstract

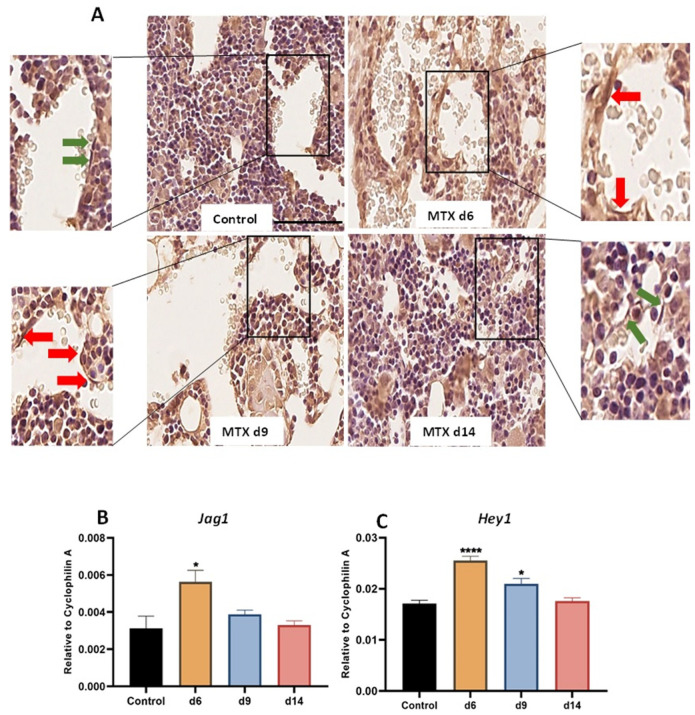
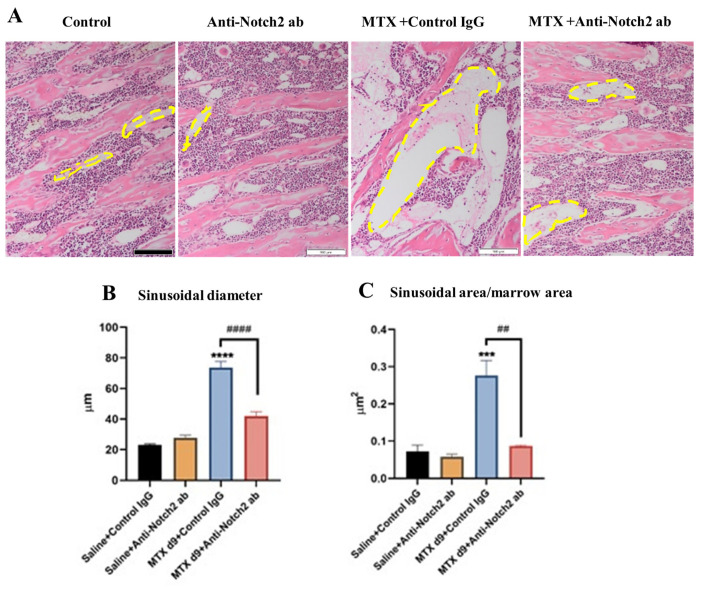
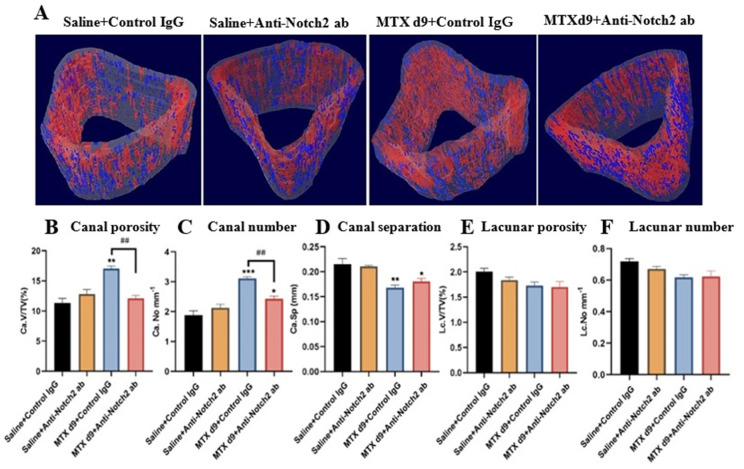
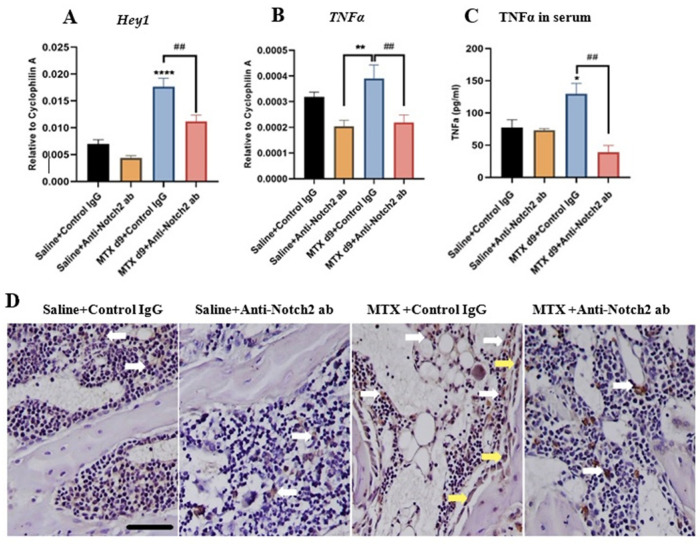
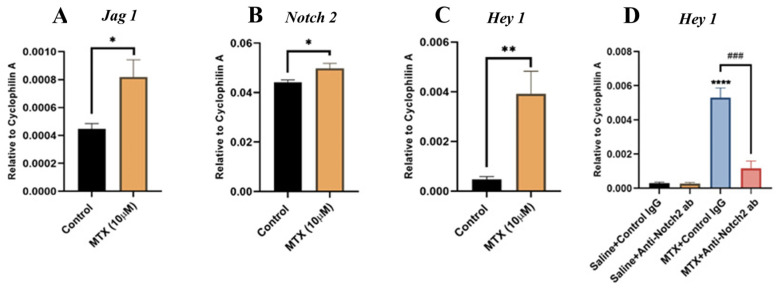
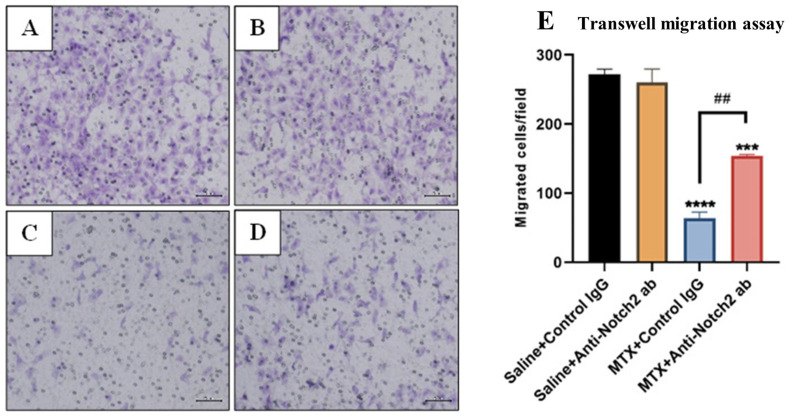
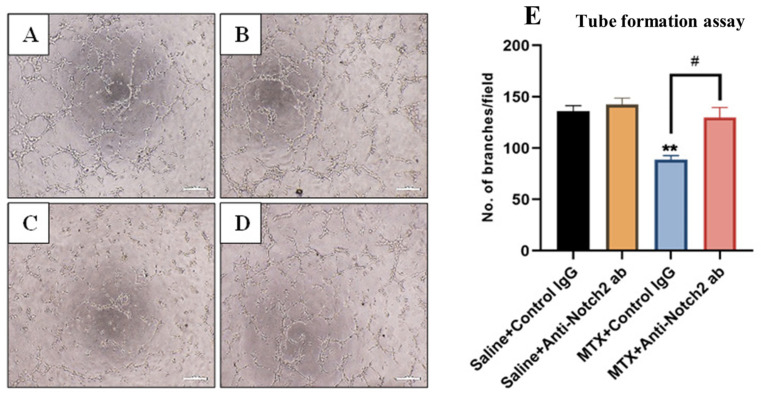
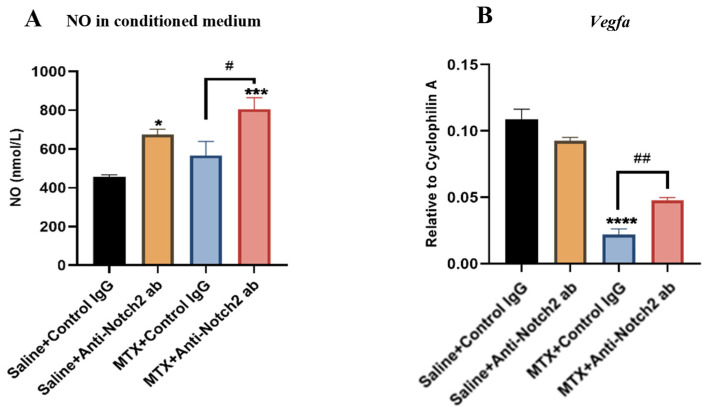
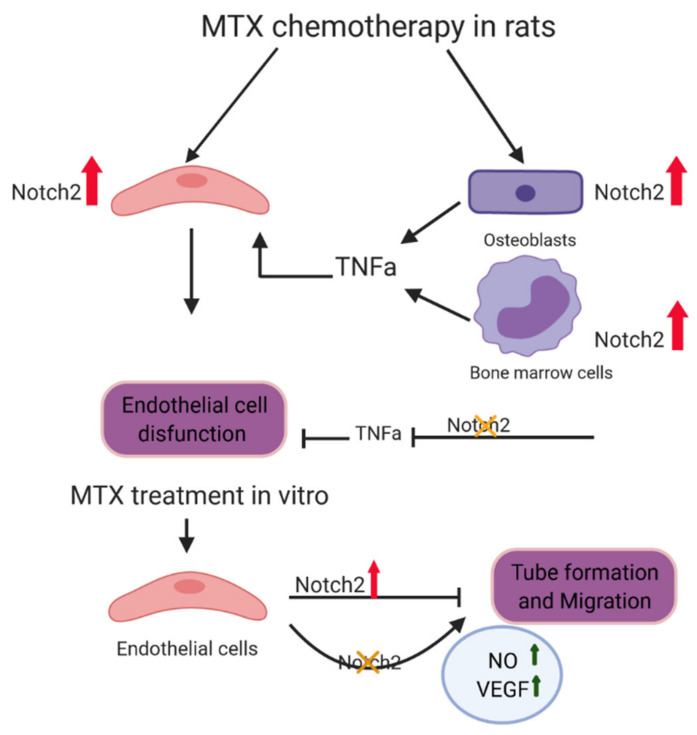
Intensive cancer chemotherapy is well known to cause bone vasculature disfunction and damage, but the mechanism is poorly understood and there is a lack of treatment. Using a rat model of methotrexate (MTX) chemotherapy (five once-daily dosses at 0.75 mg/kg), this study investigated the roles of the Notch2 signalling pathway in MTX chemotherapy-induced bone micro-vasculature impairment. Gene expression, histological and micro-computed tomography (micro-CT) analyses revealed that MTX-induced micro-vasculature dilation and regression is associated with the induction of Notch2 activity in endothelial cells and increased production of inflammatory cytokine tumour necrosis factor alpha (TNFα) from osteoblasts (bone forming cells) and bone marrow cells. Blockade of Notch2 by a neutralising antibody ameliorated MTX adverse effects on bone micro-vasculature, both directly by supressing Notch2 signalling in endothelial cells and indirectly via reducing TNFα production. Furthermore, in vitro studies using rat bone marrow-derived endothelial cell revealed that MTX treatment induces Notch2/Hey1 pathway and negatively affects their ability in migration and tube formation, and Notch2 blockade can partially protect endothelial cell functions from MTX damage.

Keywords: bone vasculature; cancer chemotherapy; methotrexate; notch signalling.


Conflict of interest statement

All authors have no conflict of interest to declare.

Figures

Figure 1
Figure 1
MTX chemotherapy-altered Notch2 intracellular domain (NICD2) protein level, Notch ligand Jag1 and Notch target gene Hey1 mRNA expression levels in tibial metaphysis bones. (A) Immunohistochemistry staining against NICD2 in tibial secondary spongiosa revealed more abundant NICD2-positive bone marrow endothelial cells (BMECs) (pointed by red arrows) at days (d) 6 and 9 (after the first MTX injection) compared to the control, and more NICD2-negative endothelial cells (pointed by green arrows) at day 14. Scale bar is 50 µm. Quantification real time PCR analyses (using RNA isolated from metaphyseal bone specimens) for (B) Notch ligand Jag1 and (C) Notch target gene Hey1. * p < 0.05 and **** p < 0.0001 compared with the control group.
Figure 2
Figure 2
Effect of MTX or MTX+Anti-Notch2 antibody (ab) treatment on bone marrow sinusoid dilation in rats (histological analyses). (A) Representative tibial sections with H&E staining from different treatment groups, showing treatment effects on bone marrow sinusoids (indicated by yellow dash lines). Scale bar is 100 µm. (B) BM sinusoidal diameters at different treatment groups. (C) Treatment effects on sinusoidal area per bone marrow area. *** p < 0.001 and **** p < 0.0001 compared to control group; ## p < 0.01 and #### p < 0.0001 compared with MTX+Control IgG-treated group. All the measurements are expressed as mean ± SEM.
Figure 3
Figure 3
Treatment effects on tibial metaphyseal cortical bone vasculature canals and osteocyte lacuna porosities at day nine after initial MTX dose. (A) Representative micro-CT 3D images form control and different treatment groups illustrating the segmentation of the cortical bone vasculature canals (red) and osteocyte lacuna network (blue). (B) Vascular canal porosity (Ca.V/TV, %). (C) Average vascular canal number (Ca.No, per mm). (D) Vascular canal separation (Ca.Sp, mm). (E) Osteocyte lacunar porosity (Lc.V/TV, %). (F) Osteocyte lacunar number (Lc.No, per mm). All measurements expressed as mean ± SEM. * p < 0.05, ** p < 0.01 and *** p < 0.001 compared to the control; and ## p < 0.01 compared between MTX treatment groups.
Figure 4
Figure 4
Effects of anti-Notch2 antibody (ab) treatment on expression of Notch target gene Hey1 and inflammatory cytokine TNFα in bone and serums of rats on day (d) nine after the first MTX injection. (A) Hey1 mRNA expression levels as evaluated by RT-PCR. (B) TNFα mRNA expression levels in bones. (C) TNFα protein levels in serum (pg/mL) as assessed by ELISA. (D) Representative images (taken from the lower region of secondary spongiosa of metaphysis bone) for TNFα immunostaining of rat bone and bone marrow from various treatment groups, with MTX+Control IgG group illustrating more abundant positivity (bone marrow cells (white arrow heads) and osteoblasts (yellow arrow heads) when compared to the MTX+Anti-Notch2 antibody treatment group. Scale bar is 50 µm. * p < 0.05, ** p < 0.01 and **** p < 0.0001 compared to the control or the anti-Notch2 antibody alone treatment control, and ## p < 0.01 when compared between MTX treatment groups.
Figure 5
Figure 5
MTX treatment effects on the Notch2 ligand Jag1, Notch2, and the Notch target gene Hey1 mRNA expression and the role of Notch2 signalling in MTX-induced Hey1 induction in cultured rat bone marrow-derived endothelial cells (BMECs). Quantitative real-time PCR gene expression analyses of (A) Jag1, (B) Notch2, (C) Hey1, using RNA isolated from control and MTX-treated (10 µM for 24 h) BMECs. (D) Quantitative real time PCR for Hey1 in BMECs treated for 24 h with Saline+Control IgG, Saline+Anti-Notch2 antibody (ab), MTX+Control IgG, or with MTX+Anti-Notch2 antibody. * p < 0.05, ** p < 0.01, and **** p < 0.0001 compared to control IgG; and ### p < 0.001 compared between MTX treated groups. All results are shown as mean ± SEM from three independent experiments.
Figure 6
Figure 6
Treatment effects of MTX with/without anti-Notch2 antibody (ab) on migration ability of rat bone marrow-derived endothelial cells (BMECs) as assessed by a transwell migration assay. Representative microscopic images illustrate migrated cells stained with Crystal Violet in (A) Saline+Control IgG group, (B) Saline+Anti-Notch2 antibody group, (C) MTX+Control IgG group and (D) MTX+Anti-Notch2 antibody group. Scale bar is 200 µm. (E) Average numbers of migrated cells per field (as mean ± SEM) from three independent experiments. *** p < 0.001 and **** p < 0.0001 compared to control IgG, and ## p < 0.01 compared between MTX treatment groups.
Figure 7
Figure 7
Treatment effects of MTX ± anti-Notch2 antibody (ab) on tube formation ability of rat bone marrow-derived endothelial cells (BMECs). Representative microscopic images of tube formation for endothelial cells treated with (A) Saline+Control IgG, (B) Saline+Anti-Notch2 antibody, (C) MTX+Control IgG, and (D) MTX+Anti-Notch2 antibody. Scale bar is 200 µm. (E) Average numbers of branches per field (as mean ± SEM) from three independent experiments. ** p < 0.01 compared to the control IgG group and # p < 0.05 when compared between MTX treatment groups.
Figure 8
Figure 8
Treatments effect on levels of nitric oxide (NO) in conditioned medium and Vegfa mRNA expression in bone marrow-derived endothelial cells. (A) Levels of NO in conditioned medium from different treatment groups as evaluated by Griess assays. (B) Quantitative real time PCR for Vegfa mRNA expression. * p < 0.05, *** p < 0.001 and **** p < 0.0001 compared to the Saline+Control IgG group, and # p < 0.05 and ## p < 0.01 when compared between MTX treatment groups. Results shown are mean ± SEM from three independent experiments.
Figure 9
Figure 9
Schematic representation of function of Notch2 activation in endothelial cell and bone vasculature damages following MTX treatment. Activation of Notch2 in osteoblasts and bone marrow cells after MTX treatment may result in increased production and release of tumour necrosis factor alpha (TNFα), which, together with Notch2 overactivation in endothelial cells, may cause vasculature dysfunction and vasodilation. Notch2 antagonism can significantly attenuate MTX treatment-induced micro-vasculature damage. MTX treatment in vitro also induces Notch2 pathway in cultured rat bone marrow endothelial cells (BMECs), which is linked with decreased tube formation and migration ability; and anti-Notch2 antibody treatment ameliorates MTX-induced adverse effects on BMEC functionality, which is possibly due to increased production of nitric oxide (NO) production and expression of vascular endothelial growth factor (VEGF) in endothelial cells.

Similar articles

Cited by

References

    1. Georgiou K.R., King T.J., Scherer M.A., Zhou H., Foster B.K., Xian C.J. Attenuated Wnt/beta-catenin signalling mediates methotrexate chemotherapy-induced bone loss and marrow adiposity in rats. Bone. 2012;50:1223–1233. doi: 10.1016/j.bone.2012.03.027. - DOI - PubMed
    1. Crews K.R., Liu T., Rodriguez-Galindo C., Tan M., Meyer W.H., Panetta J.C., Link M.P., Daw N.C. High-dose methotrexate pharmacokinetics and outcome of children and young adults with osteosarcoma. Cancer Interdiscip. Int. J. Am. Cancer Soc. 2004;100:1724–1733. doi: 10.1002/cncr.20152. - DOI - PubMed
    1. Papaconstantinou H.T., Xie C., Zhang W., Ansari N.H., Hellmich M.R., Townsend C.M., Jr., Ko T.C. The role of caspases in methotrexate-induced gastrointestinal toxicity. Surgery. 2001;130:859–865. doi: 10.1067/msy.2001.117376. - DOI - PubMed
    1. Haddy T.B., Mosher R.B., Reaman G.H. Osteoporosis in survivors of acute lymphoblastic leukemia. Oncologist. 2001;6:278–285. doi: 10.1634/theoncologist.6-3-278. - DOI - PubMed
    1. Kunstreich M., Kummer S., Laws H.J., Borkhardt A., Kuhlen M. Osteonecrosis in children with acute lymphoblastic leukemia. Haematologica. 2016;101:1295–1305. doi: 10.3324/haematol.2016.147595. - DOI - PMC - PubMed

Publication types

Grants and funding

This work was supported in part by National Health and Medical Research Council Australia (NHMRC) (1127396) and Channel 7 Children’s Research Foundation (19/10630882). Yaser Peymanfar was supported by Research Training Program international (RTPi) scholarship of University of South Australia. The APC was funded by University of South Australia.

LinkOut - more resources