. 2022 Aug;29(8):781-790.
doi: 10.1038/s41594-022-00811-w. Epub 2022 Aug 10.

Conformational buffering underlies functional selection in intrinsically disordered protein regions

Affiliations

Conformational buffering underlies functional selection in intrinsically disordered protein regions

Nicolás S González-Foutel et al. Nat Struct Mol Biol. 2022 Aug.

Abstract

Many disordered proteins conserve essential functions in the face of extensive sequence variation, making it challenging to identify the mechanisms responsible for functional selection. Here we identify the molecular mechanism of functional selection for the disordered adenovirus early gene 1A (E1A) protein. E1A competes with host factors to bind the retinoblastoma (Rb) protein, subverting cell cycle regulation. We show that two binding motifs tethered by a hypervariable disordered linker drive picomolar affinity Rb binding and host factor displacement. Compensatory changes in amino acid sequence composition and sequence length lead to conservation of optimal tethering across a large family of E1A linkers. We refer to this compensatory mechanism as conformational buffering. We also detect coevolution of the motifs and linker, which can preserve or eliminate the tethering mechanism. Conformational buffering and motif-linker coevolution explain robust functional encoding within hypervariable disordered linkers and could underlie functional selection of many disordered protein regions.


Conflict of interest statement

Competing Interests Statement

A.S.H. is a scientific consultant with Dewpoint Therapeutics Inc. and R.V.P. is a member of the scientific advisory board of Dewpoint Therapeutics Inc. This work has not been influenced by the affiliation with Dewpoint. The rest of the authors have no competing interests.

Figures
EXTENDED DATA FIGURE 1:
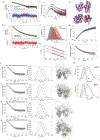
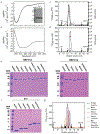
EXTENDED DATA FIGURE 1:. Biophysical characterization of recombinant Rb and E1A proteins.
a) Far UV-CD spectra of E1AWT (solid line), E1AΔΕ (dotted line), E1AΔL (dashed line). Inset: 15% SDS-PAGE gel of purified recombinant E1A proteins (purity > 90%). b) Far UV-CD spectrum of the Rb (RbAB domain). c) SEC-SLS experiments of E1AWT (solid line), E1AΔΕ (dotted line) and E1AΔL (dashed line). d) SEC-SLS experiment of Rb. For b) and c), black bars correspond to the elution volume of globular protein markers: BSA 66 kDa (1), MBP 45 kDa (2) and Lysozyme 14.3 kDa (3). Black line: SEC profile, red line: measurement of the molecular weight. e) 12.5% SDS-PAGE of MBP-E1A fusion protein variants. Gel1: Grafting of selected linkers from Human and Simian E1A proteins into the E1AWT construct containing the HAdV5 motifs. Types are: HAdV52, HAdV40, SAdV3, SAdV22, HAdV5, HAdV5!Hyd, HAdV18, HAdV40–2x. Gel 2: Grafting of linkers from Bovine, Canine and Bat E1A proteins into the E1AWT sequence and endogenous variants carrying the cognate motifs for each species: BAdV2, BAdV2-ED, BAdV1, CAdV1, BtAdV2 and BtAdV2-ED. f) 17% SDS-PAGE of cleaved E1A protein variants: BAdV2, HAdV52, HAdV40, BtAdV2, HAdV5 and HAdV40–2x. g) Size exclusion chromatography experiment performed on a Superdex 200 column to determine Rh of cleaved E1A variants. Black bars correspond to Vo and Vo+Vi, and to the elution volume of globular protein markers: Gamma Globulin 150 kDa (1), Transferrin 80 kDa (2), BSA 66 kDa (3) MBP 45 kDa (4) and Trypsin Inhibitor 21 kDa (5). The E1A types are referenced to the names used in Fig. 4d.
EXTENDED DATA FIGURE 2:
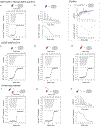
EXTENDED DATA FIGURE 2:. Representative ITC binding isotherms for Rb:peptide/protein complexes.
Measurements were performed loading the cell with Rb solution and the syringe with the different peptides or proteins as titrants. Panels show heat exchanged as a function of time (upper panel), and the enthalpy per mole of injectant plotted as a function of [peptide/protein]/[Rb] molar ratio (lower panel, black circles) and the corresponding fit using a single site binding model (lower panel, black lines). Binding traces here represented correspond to: a) Rb (5 μM) and Human E2F2 (50 μM); b) Rb (30 μM) and E1AE2F (300 μM); c) Rb (15 μM) and E1ALxCxE (150 μM); d) Rb (15 μM) and E1ALxCxE-AC (150 μM); e) Rb (15 μM) and E1ALxCxE-ACP (150 μM); f) Rb (15 μM) and E1AWT (150 μM); g) Rb (15 μM) and E1AΔE (150 μM); h) Rb (30 μM) and E1AΔL (300 μM). Thermodynamic parameters derived from the fitting are shown in Supplementary Data Table 1. Exothermic binding to Rb was observed for the Cellular E2F2 peptide and E1A peptides and protein fragments harboring the LxCxE motif, while E1AE2F and E1AΔL harboring only the E1A E2F motif clearly showed an endothermic behavior. i) ITC curve of a peptide corresponding to the TAZ2 region in the E1A linker (63–80) that showed intensity decreases in the NMR experiments (Fig. 2) binding to Rb. The titration was performed at 30 μM Rb and 300 μM E1A linker peptide at 20 °C. A schematic representation of each interacting pair is shown above the ITC traces: Rb (grey double circle) and each peptide/protein, where binding motifs are represented as follows: Human-E2F2 (green oval), E2F motif (blue oval), LxCxE motif (red oval), LxCxE acidic stretch (orange circle), phosphorylation (letter P).
EXTENDED DATA FIGURE 3:
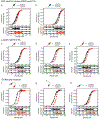
EXTENDED DATA FIGURE 3:. Fluorescence Spectroscopy titration experiments of E1A-Rb and E2F-Rb interactions.
Representative titration binding curves at equilibrium for each FITC-labeled peptide/protein-Rb interaction tested in this work. Normalized anisotropy signals (circles) are shown, along with the global fit to a 1:1 binding model (lines) that yielded the KD value. The residuals for the fit are shown in the lower panels. Binding traces here represented correspond to two probe (FITC-labeled peptide/protein) concentrations: a) Cellular E2F2: 1 nM (black) and 5 nM (red); b) E1AE2F: 100 nM (black) and 500 nM (red); c) E1ALxCxE: 100 nM (black) and 500 nM (red); d) E1ALxCxE-AC: 130 nM (black) and 700 nM (red); e) E1ALxCxEACP: 30 nM (black) and 100 nM (red); f) E1AWT: 0.5 nM (black) and 2 nM (red); g) E1AΔE: 200 nM (black) and 800 nM (red); h) E1AΔL: 200 nM (black) and 800 nM (red). The KD values obtained by global fitting to a 1:1 model (Supplementary Data Table 1) were in excellent agreement with those obtained when fitting individual binding curves using non-normalized anisotropy or fluorescence data (Supplementary Data Table 2). A schematic representation of each interacting pair is shown above the binding traces: Rb (grey double circle); FITC-moiety at the N-terminus of the sequence (light green circle). Binding motifs are represented as follows: Human-E2F2 (green oval), E2F motif (blue oval), LxCxE motif (red oval), acidic stretch (orange circle), phosphorylation (letter P). The linker is represented by a black line.
EXTENDED DATA FIGURE 4:
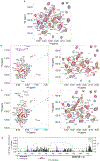
EXTENDED DATA FIGURE 4:. NMR experiments of [Rb:E1A] complexes.
a) Central region of 1H-15N TROSY spectra of free 15N-labeled E1A (black) and a 1:1 molar ratio complex of 15N-labeled E1A and unlabeled Rb (red) at 525 μM, with assigned peaks of the free form indicated. The full spectrum of this complex is shown in Fig. 2 a, b) Left panel: Overlay of the 1H-15N TROSY spectra of free 15N-labeled E1AΔL (black) and a 1:1 molar ratio complex of 15N -labeled E1AΔL and unlabeled Rb (red) at 315 μM. Right panel: central region of the spectra with assigned peaks of the free form indicated c) Left panel: Overlay of the 1H-15N TROSY spectra of free 15N-labeled E1AΔE (black) and a 1:1 molar ratio complex of 15N-labeled E1AΔE and unlabeled Rb (red) at 315 μM. Right panel: central region of the spectra with assigned peaks of the free form indicated. The low chemical shift dispersions in the 1H dimension for E1AΔL and E1AΔE denote their disordered nature, like that seen in E1A. There is no change in peak dispersion upon binding with Rb, indicating that linker regions of the E1AΔL and E1AΔE mutants remain largely disordered in the [E1AΔL :Rb] and [E1AΔE:Rb] complexes. d) Plot of chemical shift changes upon binding as a function of residue number for E1AWT, E1AΔL and E1AΔE. Dashed line at 0.2 ppm corresponds to the digital resolution of the experiment. The small chemical shift changes for almost all of the linker residues suggest very little if no interaction with Rb. I/I0 ratio is overlaid for comparison (colored lines). Dots on the bottom correspond to the residues of each variant whose 1H-15N intensities in the bound state is = 0, so the chemical shift changes could not be measured.
EXTENDED DATA FIGURE 5:
EXTENDED DATA FIGURE 5:. Analysis of allosteric effects in the formation of the Rb-E1A complex.
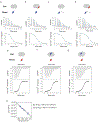
Measurements were performed by loading the cell with Rb or with a pre-assembled complex of Rb with peptide/proteins containing one of the interacting motifs and titrating with peptide/proteins containing the complementary motif loaded into the syringe. Panels show heat exchanged as a function of time, (upper panel) and the enthalpy per mole of injectant plotted as a function of [peptide or protein]/[Rb] molar ratio (Lower panel, black circles) along with the corresponding fit using a single site binding model (Lower panel, black lines). Binding traces correspond to: a) Rb (30 μM, cell) titrated with E1AE2F (300 μM, syringe) at 10 °C; b) [E1ALxCxE:Rb] (30 μM, cell) titrated with E1AE2F (300 μM, syringe) at 10 °C; c) Rb (30 μM, cell) titrated with E1AΔL(300 μM, syringe) at 10 °C; d) [E1ALxCxE:Rb] (30 μM, cell) titrated with E1AΔL (300 μM, syringe) at 10 °C; e) Rb (15 μM, cell) titrated with E1ALxCxE (150 μM, syringe) at 20 °C; f) [E1AE2F:Rb] (15μM, cell) titrated with E1ALxCxE (150 μM, syringe) at 20 °C; g) [E1AΔL:Rb] (15 μM, cell) titrated with E1ALxCxE (150 μM, syringe) at 20 °C. Thermodynamic parameters derived from the fitting are shown in Supplementary Data Table 1. A schematic representation of each titration design is shown above the ITC traces: Rb: grey double circle, E2F motif: blue oval, LxCxE motif: red oval. The E1A linker is depicted as a black line. h) ITC measurements of E1AE2F and E1AΔL at different temperatures. The heat capacity change (ΔCp) was calculated from the slope of the plot of ΔH vs temperature. E1AE2F: filled blue bars; E1AΔL: open blue bars. Thermodynamic parameters are reported in Supplementary Data Table 5.
EXTENDED DATA FIGURE 6:
EXTENDED DATA FIGURE 6:. SAXS analysis of Rb, E1A and the [E1AWT:Rb] complex.
a) I. Experimental SAXS intensity profile (black empty circles) versus theoretical profiles obtained from the crystal structure of the unliganded RbAB domain (PDB ID: 3POM) (red line) or a refined model where flexible loops were added (Allos-Mod-FoXS, blue line). Residuals are shown below the fits. II. Kratky plots of Rb at 4.0 mg/ml (blue line), 2.0 mg/ml (red line) and 1.0 mg/ml (black line). III. Orthogonal views of the RbAB crystal structure (red) and optimized model (blue) (RMSD = 1.7 Å). b) I. SAXS intensity profile of E1AWT (black circles) and the best fit from the EOM method (red line). Below, residual of the fit. II. Rg distribution of the E1AWT ensemble pool (black area) and EOM-selected ensemble (red area). III-IV. Kratky plots (III) or Guinier plots (IV) of E1AWT at 7.0 mg/ml (blue empty circles), 5.6 mg/ml (red empty circles) and 4.2 mg/ml (black empty circles). V. Overlay of SEC-SAXS profile of E1AWT (blue empty circles) and the merged curve from SAXS experiments at three concentrations (pink line). c) Theoretical SAXS profiles computed for a pool of 10250 [E1AWT:Rb] structures compared to experimental SAXS profiles and EOM fitting. Four fitting conditions are shown: I. 1000 generations with ensemble size N = 20, II. 1000 generations with N = 50, III. 500 generations with N = 20 and IV. 500 generations with N = 50. Left: experimental SAXS intensity profiles (grey circles) and EOM fitting (red lines). Middle: Rg distributions of pool ensembles (black line) and EOM-selected sub-ensembles (red line). Right: EOM-selected sub-ensembles. Fitting condition II is presented in Fig. 3. d) Calculated Rh for [E1AWT:Rb] (black) [E1AΔE:Rb] (green) and [E1AΔL:Rb] (blue) pool ensembles and the EOM-selected [E1AWT:Rb] sub-ensemble (red).
EXTENDED DATA FIGURE 7:
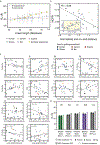
EXTENDED DATA FIGURE 7:. Correlation of E1A linker dimensions with sequence-encoded features.
a) Linker length control titration experiment. End-to-end distance (Re) of natural sequences (colored circles) compared to synthetic sequences of varying length and constant sequence composition matching the HF_HAdV40 linker (yellow squares). Natural sequences: n=15 independent simulations were run for each sequence, points represent the mean Re value and error bars represent the standard deviation over the population obtained from the total ensemble from 15 simulations. Synthetic sequences: n=20 random permutations were generated for each length and simulated under equivalent conditions. The mean Re value (yellow square) is a double average over both conformational space and sequence space. Lines within the yellow squares represent the standard error of the mean across all simulations of a given length, shown to confirm that all random permutations have very similar Re values. b) Net-charge per residue (NCPR) as a function of normalized end-to-end distance for the 27 linkers of Fig. 4a. Inset: NCPR as a function of linker length. Sequences used in the grafting experiment are shown as solid circles and the rest as transparent circles. R = Pearson’s correlation coefficient. c) Correlation between distinct sequence parameters and normalized end-to-end distance (upper panels) or linker length (lower panels) (Supplementary Text 1). R = Pearson’s correlation coefficient. Most R values are < 0.3 with several exceptions. d) Hydrodynamic radius (Rh) for motif-linker-motif constructs of five cleaved E1A variants (shown in Extended Data Fig. 1 f, g). The length of each construct is indicated above each bar. Rh was determined from size exclusion chromatography run on Superdex 75 (n=1, striped colored bars) or Superdex 200 (n=1, cross-hatched colored bars). The height of each bar indicates the estimated Rh value and the error bars represent the standard deviation obtained from interpolation in the −logMW vs Kav calibration curve (see Methods). Rh was also predicted from all-atom simulations (colored bars). The height of each bar represents the mean Rh value from ten independent simulations of each construct (n=10), while each individual marker is the mean of each independent simulation.
EXTENDED DATA FIGURE 8:
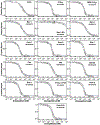
EXTENDED DATA FIGURE 8:. E2F displacement ability and Rb-binding affinity of E1A variants.
Competition displacement curves were performed by competing a preassembled equimolar [FITC-E2F2:Rb] complex at 10nM concentration with increasing concentrations of each variant. One representative example is shown for each variant reported on Supplementary Data Table 7. The displacement reaction was followed by recording the fluorescence anisotropy of the FITC moiety, with excitation at 490nm and emission at 520nm. In every case except for Bov-1-ED, the E1A variants were able to displace FITC-E2F2 from binding to Rb. The anisotropy value of free FITC-E2F2 was 0.042 ± 0.002 and the anisotropy value of the [FITC-E2F2:Rb] complex was 0.14 ± 0.01. In every case, the anisotropy value obtained at the end of the titration was equal to the anisotropy value of the free FITC-E2F2 peptide, confirming the complete displacement of FITC-E2F2. The anisotropy values were normalized to calculate the fraction of Rb-bound FITC-E2F2 and fitted to estimate the KD value for the [Variant:Rb] complex.
EXTENDED DATA FIGURE 9.
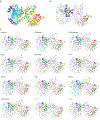
EXTENDED DATA FIGURE 9.. Conservation of pocket domain structure and linear motif binding sites across mammalian pocket proteins.
a) Structural conservation of the pocket domain across mammalian pocket proteins. The human Rb pocket domain (PDB:1GUX) is shown aligned with 9 structural models of Rb pocket domains from representative mammalian species plus the human paralogs p107 (PDB:4YOZ) and p130. The models of the Rb pocket domains and p130 were obtained by using Alphafold2 implemented in ColabFold (See Methods). Secondary structure is depicted in rainbow colors. The E2F (left) and LxCxE (right) motifs are depicted as green ribbons (PDB 2R7G and 1GUX respectively). b) Structural conservation of the E2F and LxCxE clefts in pocket proteins. Structural alignment shown in panel A with the residues that mediate binding to the E2F and LxCxE motifs (marked as asterisks in Supplementary Fig. 1) depicted as blue and red sticks respectively. c) The distance between the E2F and LxCxE binding sites is highly conserved across mammalian pocket proteins. The spacing was measured between the C-terminal anchor site of the E2F cleft (blue sphere) and the N-terminal anchor site of the LxCxE cleft (red sphere). Distances are: 46.0 Å (human, macaque and chicken), 46.1 Å (chimpanzee, dog, microbat, cow, sheep, pig, horse and tree shrew), 47.3 Å (p107) and 46.5 Å (p130). These distances are slightly shorter than the distance between binding sites used in the Ceff calculations (r0 = 49Å), which was measured between the C-terminal residue of the E2F motif and the N-terminal residue of the LxCxE motif using the structures of the motifs bound to Rb (PDB: 2R7G and 1GUX).
EXTENDED DATA FIGURE 10:
EXTENDED DATA FIGURE 10:. Global prediction of E1A-Rb binding affinity.
a-b) Lp and Ceff values for E1A linkers. Boxplots: center line represents the median, lower and upper bounds represent the first and third quartiles and upper and lower whiskers extend from the top and bottom of the box by 1.4 the interquartile range. Black dots: outliers. P-values were calculated using a two-sided permutation test (10000 permutations) and the Benjamini-Hochberg correction for multiple comparisons to control the false discovery rate. ***p-value < 0.001 (detection limit of the test). N=110: All E1A linkers, N=24: Simulated linkers. c) Ceff as a function of linker length for 24 linkers calculated using the WLC model (Lp=3Å) (green dots), or Lp values from all atom simulations (Lp Sim, orange dots). Dark green/red dots: E1AWT. d) Upper panel: E2F (blue) and LxCxE (red) motifs From E1A bound to Rb. Green sticks: core residues, blue/red sticks: variable residues. Lower panel: FoldX energy matrices with energy normalized in the range 0–2 kcal/mol. e) Fold-change in affinity (KD,E1A(Lp=3Å)/KD,E1A(LpSim)) using naïve versus simulated Lp. Red dot: E1AWT. f) Predicted KD for the E1AE2F and E1ALXCXE SLiMs and for the motiflinker-motif construct for 110 sequences (E1A WLC) and for 24 simulated sequences using Lp=3Å (KD WLC) or sequence-specific Lp from the simulations (E1A Sim). Boxplot elements and p-values are defined as in panel a. Cyan dots: experimental value for E1AWT. Red line: E2F2 motif affinity. g) Global Rb binding affinity (KD,E1A) as a function of linker length for 24 sequences using the LpSim values. KD,E1A = KD,E2F KD,LxCxE Ceff−1. The low R2 value indicates that KD,E1A is uncorrelated to linker length. Upper panel: density plot of linker length for 107 E1A linkers (three short linkers were excluded). Right panel: density plot of KD,E1A. Red dot/line: Predicted KD,E1A for HAdV5 (E1AWT). Grey cross line: experimental KD,E1A for E1AWT.
FIGURE 1.
FIGURE 1.. Tethering is required for high affinity Rb binding and E2F displacement by E1A.
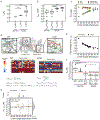
a) Model for disruption of the repressive Rb-E2F complex by E1A. b) Schematic representation of E1A and E2F2 constructs used in this study. Color coding for the E2F, LxCxE, TAZ2 and MYND SLiMs, the acidic stretch and S132 phosphorylation are maintained throughout figures. c) Representative interactions tested using fluorescence spectroscopy (Extended Data Fig. 3 and Supplementary Data Tables 1 and 3). d) E2F competition titrations. Color code is as in panel c. e) Comparison of the fold-change in binding affinity from direct titrations versus competition assays. The height of the bar is obtained by dividing the KD of E2F2 by each KD (n=1), and values higher than unity indicate an increase in binding affinity with respect to E2F2. For direct titrations, each KD value was obtained by averaging (global fitting) over several independent binding isotherms (E2F2: n=5, E1AE2F: n=3, E1AΔL: n=3, E1AWT: n=3) containing 16–22 points each (see Source Data). For competition experiments, each KD was obtained by fitting of a single binding isotherm (n=1). Error bars correspond to the propagated standard deviation of the averaged KD values. f) Three models that account for affinity enhancement in the Motif-Linker-Motif E1A arrangement (See main text for details).
FIGURE 2.
FIGURE 2.. NMR and ITC analysis of the [E1AWT:Rb] complex.
a) 1H-15N TROSY spectra of free 15N-E1AWT (black) and 15N-E1AWT bound to unlabeled Rb (red). 15N-E1AWT peak assignments for the inset are shown in Extended Data Fig. 4. b) Ι. 13Cα secondary chemical shift (ΔδCα) of 15N-E1AWT. II. NHNOE/NONOE ratio for 15N-E1AWT. Dashed line: reference value for rigid backbone. IIΙ. Intensity ratio plots of bound state (I) with respect to the free state (I0) for E1AWT, E1AΔL and E1AΔE. Dark gray: E2F/LxCxE SLiMs and flanking regions; Light gray: N-terminal linker region. ΙV-V. Disorder propensity and residue conservation (information content: IC) were predicted from an alignment of E1A sequences (n=110) (Supplementary Data File 1). For disorder prediction, data points represent the mean IUPred value at each position and error bars represent the standard deviation of the mean. The number of residues averaged at each position is variable depending on the number of gaps in the alignment. For the conservation plot, the height of each bar represents the IC value at each position. c) Far-UV CD spectra for E1AWT (green line), Rb (violet line), the [E1AWT:Rb] complex (black line) and the arithmetic sum of the Rb and E1AWT spectra (red dashed line). The latter CD spectra largely overlap. While it is possible the low salt concentration of the CD experiments might mask hydrophobic interactions occurring at the higher salt concentration used for NMR and other binding experiments, such effects are unlikely to prevail for the types of monovalent salts used in our binding experiments. d) Left: Plot of the change in free energy of binding (ΔΔG) for E1A fragments containing or lacking the linker region, measured by ITC. The bar height results from the subtraction between mean ΔG values obtained by averaging several independent binding experiments: ΔG E1AΔL (n=3), ΔG E1AE2F (n=1), ΔG E1AΔE (n=3) and ΔG E1ALxCxE-AC (n=3) (Supplementary Data Table 1). Right: Plot of the change in ΔASA for E1A fragments containing or lacking the linker region. The height of the bar represents the ΔASA value from PDB structure 2R7G (n=1, black bar) or that derived from ITC experiments using parameters from Murphy & Freire for [E1AE2F:Rb] (n=1, blue bar) and [E1AΔL:Rb] (n=1, empty blue bar) (Supplementary Data Table 6). ΔASA was calculated by ITC measurements at several temperatures (n=4 [E1AE2F:Rb], n=3 [E1AΔL:Rb]). Error bars correspond to the propagated mean standard errors of the ΔASA value.
FIGURE 3:
FIGURE 3:. The E1A linker behaves as an entropic tether.
a) Schematic representation of how Ceff depends on linker length. b) Ceff curve from the WLC model. The scenarios depicted in a) are shown as regions (I, II, III). c) SAXS intensity profile of: Rb (gray squares) with best fit to the theoretical profile derived from the Rb crystal structure (RbAB domain, black line); and the [E1AWT:Rb] complex (black circles) with best fit from the EOM method (red line). Inset: Guinier plots for Rb and [E1AWT:Rb]. d) SAXS-selected [E1AWT:Rb] EOM ensemble (both motifs bound) and simulated ensembles for [E1AΔE:Rb] and [E1AΔL:Rb] (one motif bound). e) Rg distribution of the ensemble pool for [E1AWT:Rb] (black) and the EOM ensemble (red). The linker samples conformations more extended than the random-coil model of the pool. f) SEC-SLS of [E1AWT:Rb] (solid line), [E1AΔE:Rb] (dotted line) and [E1AΔL:Rb] (dashed line). Black bars: BSA 66 kDa (1), MBP 45 kDa (2) and Lysozyme 14.3 kDa (3). Black line: SEC profile, Red line: MW value (g/mol). g) Comparison between the hydrodynamic radius (Rh) of modeled (MP = pool, ME= EOM) and experimental (E) ensembles for [E1AWT:Rb] (black bars), [E1AΔE:Rb] (red bars) and [E1AΔL:Rb] (blue bars). The height of each bar represents the Rh value. Modeled Rh values (n=1) have no associated error. For Experimental Rh values (n=1) error bars represent the propagated error obtained from estimation of the Rh parameter (see Methods).
FIGURE 4.
FIGURE 4.. Conformational buffering leads to conserved functionality of E1A proteins.
a) Global alignment of 27 selected E1A linker sequences. Mastadenovirus types are indicated on the left and the color coding (bottom panel) indicates the host range. The variants used for the design of chimeras are shown to the right, with three letter codes indicating the host range. Amino acids color code: acidic (red), basic (blue), polar (green), hydrophobic (black), aromatic (orange) and proline (pink). b) End-to-end distance calculated from all-atom simulations using the set of E1A linkers from panel a. Violin plots are colored by host range as in panel a. For each sequence, n=15 independent simulations were run (see Methods). The horizontal line within each violin plot represents the median end-to-end distance (Re) value and the ends of the whiskers indicate the maximal and minimal values. Horizontal dotted line: mean Re value (53.39 Å) obtained by averaging the median Re values of all sequences excluding Bov-1, Bov-2 and Porcine. c) Motif-Linker-Motif constructs used in the E1A linker grafting experiment. Filled circles: grafting of linkers into the HAdV5 E1AE2F and E1ALxCxE motifs. Diamonds: Mutant where the hydrophobic MLAVQEGID region was replaced by a GS stretch (E1AWTΔHyd) or where the HAdV40 linker sequence was duplicated (Hum2–2x). Empty circles: Variants harboring endogenous linker and motifs (ED). d) Global KD as a function of linker length for the Motif-Linker-Motif constructs. KD for each variant was measured using an E2F displacement experiment (symbols as in c) or predicted using the WLC model. The KD values ± errors for all measurements are reported in Supplementary Data Table 4. The predicted value of the KD for the grafted linkers was calculated as KD=(KD,E2F*KD,LxCxE)/Ceff (see Methods) using the known affinity of the E1AE2F and E1ALxCxE motifs from E1AWT (Supplementary Data Table 1) and Ceff values obtained using a sequence independent (Straight line: WLC-Lp=3) or sequence-dependent (Empty triangles: WLC-LpSim) persistence length (Lp) parameter (see Extended Data Fig. 10 and Methods). Dotted line: Experimental KD value of the E1AWT construct (75 ± 17 pM). Under the sequence-independent WLC model the KD is expected to increase gradually with decreasing linker length, while LpSim predicts the KD to remain constant in the 41–75 linker length range. Experimental KD values are in good agreement with both models for longer linker lengths, but are closer to LpSim for shorter linker lengths (41, 48 and 52).
FIGURE 5.
FIGURE 5.. Evolutionary conservation of tethering by E1A proteins.
a) Phylogenetic tree of mastadenovirus E1A proteins with species denoted by two letter codes. The affinity of the E2F/LxCxE SLiMs and E1AWT, and linker length are indicated by color scales. E1A (WLC): Global KD for E1A proteins predicted by the WLC model with standard Lp values (Lp=3); E1A (LpSim): KD for E1A proteins predicted by the WLC model with sequence-dependent Lp values; E1A (Graft): Experimental KD measured for the grafted linkers of Fig. 4d; E1A (ED): Experimental KD measured for the variants harboring endogenous linker and motifs of Fig. 4d. Gray box: absent motif/linker. Light/blue box: present TAZ2/MYND SLiMs. The E1AWT protein is marked as a red asterisk and as a red terminal branch in the tree and all other sequences used in the experiments are marked as green terminal branches in the tree. b) Upper: E1A sequences evolved a multiplicity of solutions in the sequence length-composition space to achieve conserved SERs through conformational buffering. Lower: The model represents one pose of the conformational [E1AWT:Rb] ensemble with E2F/LxCxE SLiMs bound to Rb. The evolvable E1A interaction platform performs highly conserved functions (E2F activation) while allowing adaptive changes in functionality (TAZ2, MYND and other protein binding).

Similar articles

Cited by

References

    1. Wright PE & Dyson HJ Intrinsically unstructured proteins: re-assessing the protein structure-function paradigm. J Mol Biol 293, 321–331 (1999). - PubMed
    1. van der Lee R et al. Classification of intrinsically disordered regions and proteins. Chem Rev 114, 6589–6631 (2014). - PMC - PubMed
    1. Tompa P, Davey NE, Gibson TJ & Babu MM A million peptide motifs for the molecular biologist. Mol Cell 55, 161–169 (2014). - PubMed
    1. Brown CJ, Johnson AK, Dunker AK & Daughdrill GW Evolution and disorder. Curr Opin Struct Biol 21, 441–446 (2011). - PMC - PubMed
    1. Das RK, Ruff KM & Pappu RV Relating sequence encoded information to form and function of intrinsically disordered proteins. Curr Opin Struct Biol 32, 102–112 (2015). - PMC - PubMed

Publication types

MeSH terms

Substances