Estimating the environmental impacts of 57,000 food products
- PMID: 35939701
- PMCID: PMC9388151
- DOI: 10.1073/pnas.2120584119
Estimating the environmental impacts of 57,000 food products
Abstract
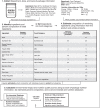
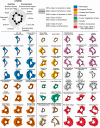
Understanding and communicating the environmental impacts of food products is key to enabling transitions to environmentally sustainable food systems [El Bilali and Allahyari, Inf. Process. Agric. 5, 456-464 (2018)]. While previous analyses compared the impacts of food commodities such as fruits, wheat, and beef [Poore and Nemecek, Science 360, 987-992 (2018)], most food products contain numerous ingredients. However, because the amount of each ingredient in a product is often known only by the manufacturer, it has been difficult to assess their environmental impacts. Here, we develop an approach to overcome this limitation. It uses prior knowledge from ingredient lists to infer the composition of each ingredient, and then pairs this with environmental databases [Poore and Nemecek Science 360, 987-992 (2018); Gephart et al., Nature 597, 360-365 (2021)] to derive estimates of a food product's environmental impact across four indicators: greenhouse gas emissions, land use, water stress, and eutrophication potential. Using the approach on 57,000 products in the United Kingdom and Ireland shows food types have low (e.g., sugary beverages, fruits, breads), to intermediate (e.g., many desserts, pastries), to high environmental impacts (e.g., meat, fish, cheese). Incorporating NutriScore reveals more nutritious products are often more environmentally sustainable but there are exceptions to this trend, and foods consumers may view as substitutable can have markedly different impacts. Sensitivity analyses indicate the approach is robust to uncertainty in ingredient composition and in most cases sourcing. This approach provides a step toward enabling consumers, retailers, and policy makers to make informed decisions on the environmental impacts of food products.
Keywords: ecolabelling; environmental impact of food; food system sustainability.
Conflict of interest statement
The authors declare no competing interest.
Figures


Comment in
-
Reply to Muzzioli et al.: Communicating nutrition and environmental information to food system stakeholders.Proc Natl Acad Sci U S A. 2023 Apr 25;120(17):e2302165120. doi: 10.1073/pnas.2302165120. Epub 2023 Apr 17. Proc Natl Acad Sci U S A. 2023. PMID: 37068226 Free PMC article. No abstract available.
-
How to communicate the healthiness and sustainability of foods to consumers?Proc Natl Acad Sci U S A. 2023 Apr 25;120(17):e2301875120. doi: 10.1073/pnas.2301875120. Epub 2023 Apr 17. Proc Natl Acad Sci U S A. 2023. PMID: 37068233 Free PMC article. No abstract available.
Similar articles
-
Vegans, vegetarians, fish-eaters and meat-eaters in the UK show discrepant environmental impacts.Nat Food. 2023 Jul;4(7):565-574. doi: 10.1038/s43016-023-00795-w. Epub 2023 Jul 20. Nat Food. 2023. PMID: 37474804 Free PMC article. Review.
-
Integrating health, nutrition, and environmental impacts of foods: a life cycle impact assessment and modelling analysis of foods in Canada.Lancet Planet Health. 2024 Apr;8 Suppl 1:S18. doi: 10.1016/S2542-5196(24)00083-4. Lancet Planet Health. 2024. PMID: 38632913
-
The Minderoo-Monaco Commission on Plastics and Human Health.Ann Glob Health. 2023 Mar 21;89(1):23. doi: 10.5334/aogh.4056. eCollection 2023. Ann Glob Health. 2023. PMID: 36969097 Free PMC article. Review.
-
Galyean appreciation club review: a holistic perspective of the societal relevance of beef production and its impacts on climate change.J Anim Sci. 2023 Jan 3;101:skad024. doi: 10.1093/jas/skad024. J Anim Sci. 2023. PMID: 36645233 Free PMC article.
-
Achieving Healthy and Sustainable Diets: A Review of the Results of Recent Mathematical Optimization Studies.Adv Nutr. 2019 Nov 1;10(Suppl_4):S389-S403. doi: 10.1093/advances/nmz037. Adv Nutr. 2019. PMID: 31728498 Free PMC article. Review.
Cited by
-
New Perspectives on the Old Uses of Traditional Medicinal and Edible Herbs: Extract and Spent Material of Persicaria hydropiper (L.) Delarbre.Nutrients. 2024 Oct 3;16(19):3368. doi: 10.3390/nu16193368. Nutrients. 2024. PMID: 39408335 Free PMC article.
-
Crop diversity used in branded products with focus on legume species worldwide.NPJ Sci Food. 2024 Sep 28;8(1):68. doi: 10.1038/s41538-024-00305-7. NPJ Sci Food. 2024. PMID: 39341796 Free PMC article.
-
Vegetarians' and vegans' experiences with and attitudes towards ultra-processed foods (UPF): a qualitative study.BMC Nutr. 2024 Sep 12;10(1):121. doi: 10.1186/s40795-024-00925-y. BMC Nutr. 2024. PMID: 39267198 Free PMC article.
-
Effects of environmental impact labels on the sustainability of food purchases: A randomised controlled trial in an experimental online supermarket.PLoS One. 2024 Sep 3;19(9):e0309386. doi: 10.1371/journal.pone.0309386. eCollection 2024. PLoS One. 2024. PMID: 39226274 Free PMC article. Clinical Trial.
-
An ecological reorientation of the Codex Alimentarius Commission could help transform food systems.Nat Food. 2024 Jul;5(7):557-562. doi: 10.1038/s43016-024-01009-7. Epub 2024 Jul 8. Nat Food. 2024. PMID: 38977923 Review.
References
-
- Willett W., et al. , Food in the Anthropocene: The EAT-Lancet Commission on healthy diets from sustainable food systems. Lancet 393, 447–492 (2019). - PubMed
-
- Springmann M., et al. , Options for keeping the food system within environmental limits. Nature 562, 519–525 (2018). - PubMed
-
- Williams D. R., et al. , Proactive conservation to prevent habitat losses to agricultural expansion. Nat. Sustain. 4, 314–321 (2021).
-
- Clark M. A., et al. , Global food system emissions could preclude achieving the 1.5° and 2°C climate change targets. Science 708, 705–708 (2020). - PubMed
-
- Springmann M., et al. , Mitigation potential and global health impacts from emissions pricing of food commodities. Nat. Clim. Chang. 7, 69–74 (2016).
Publication types
MeSH terms
Substances
Grants and funding
LinkOut - more resources
Full Text Sources
Other Literature Sources

