. 2022 Sep 5;219(9):e20220038.
doi: 10.1084/jem.20220038. Epub 2022 Aug 8.

Single-cell analyses reveal early thymic progenitors and pre-B cells in zebrafish

Affiliations

Single-cell analyses reveal early thymic progenitors and pre-B cells in zebrafish

Sara A Rubin et al. J Exp Med. .

Abstract

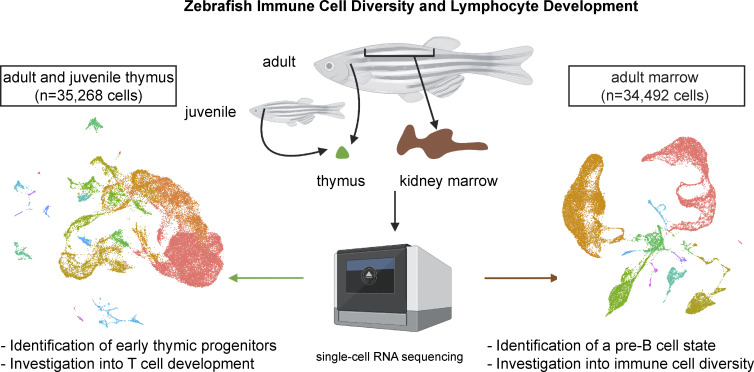
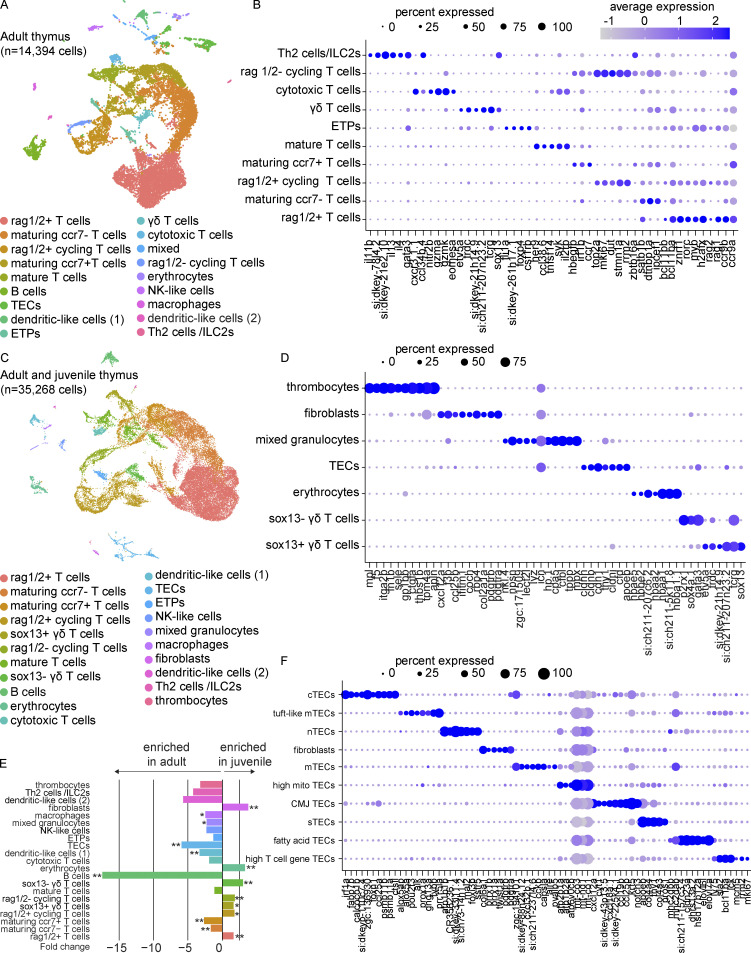
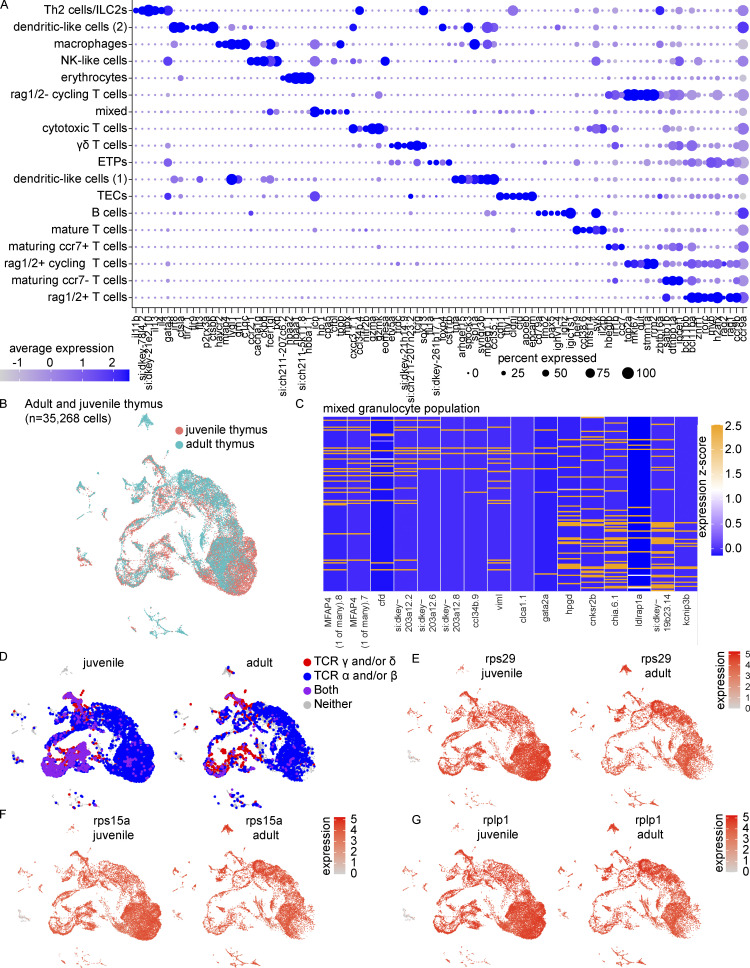
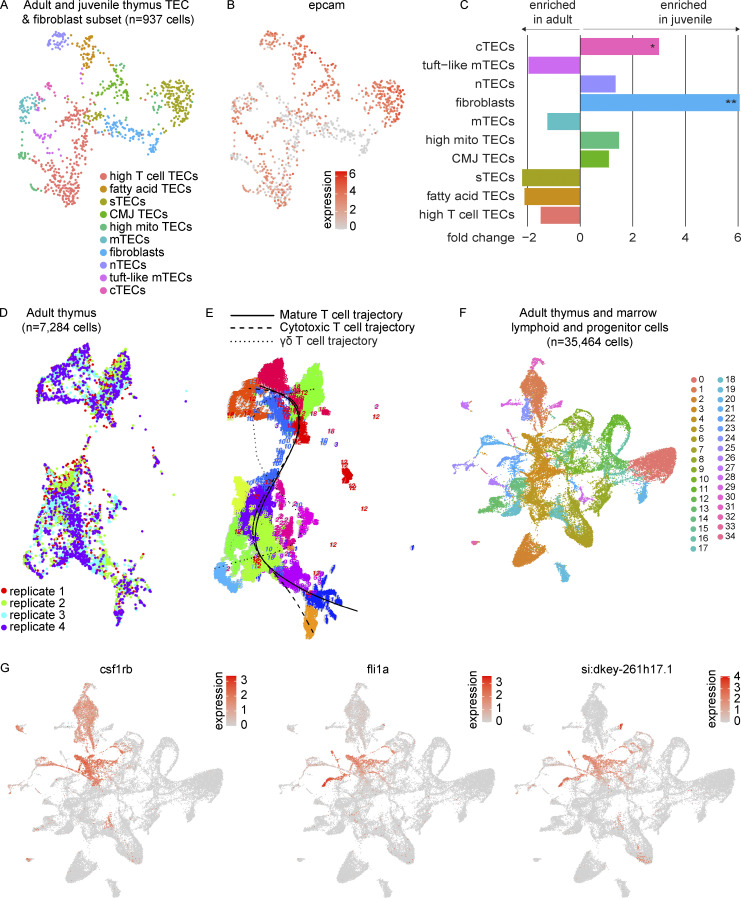
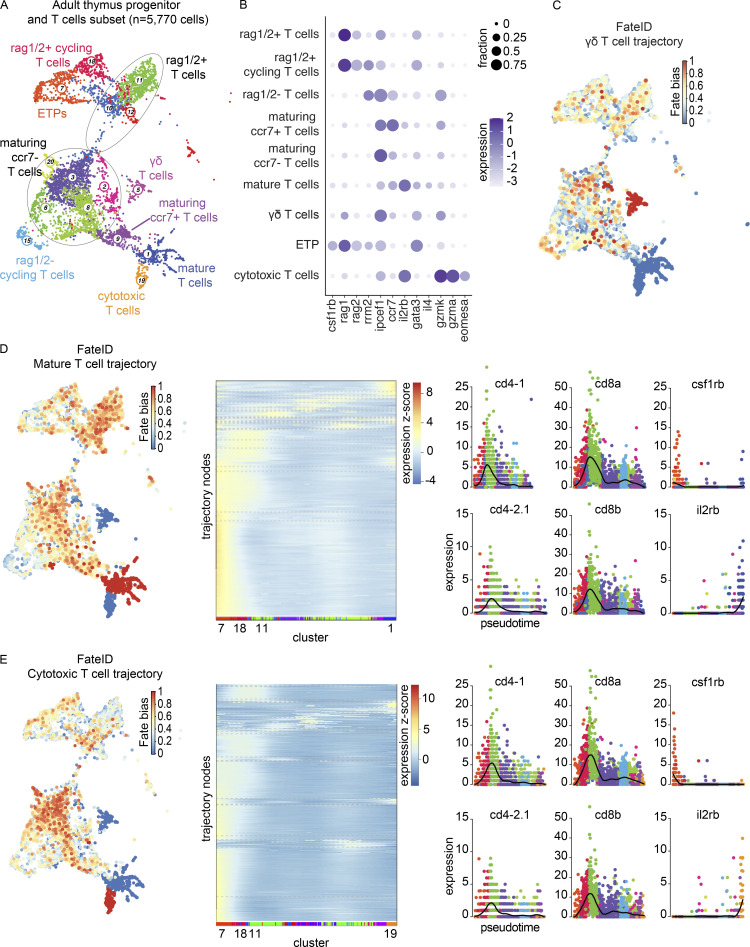
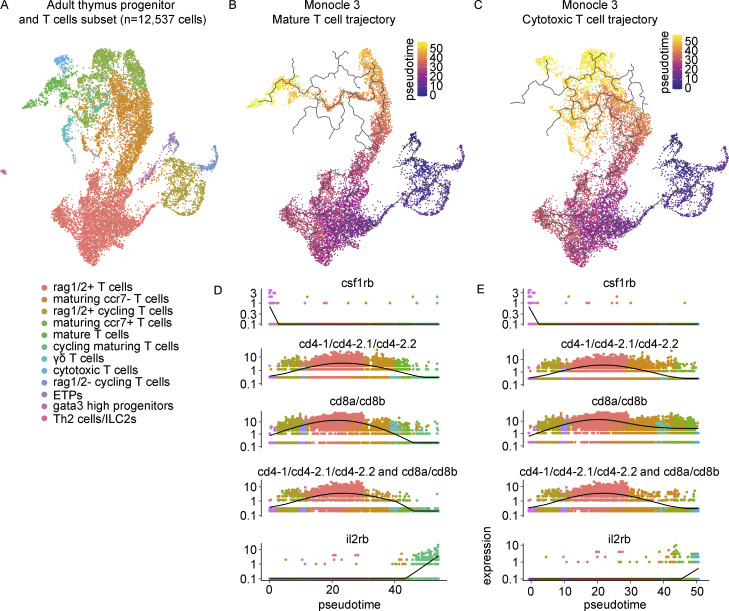
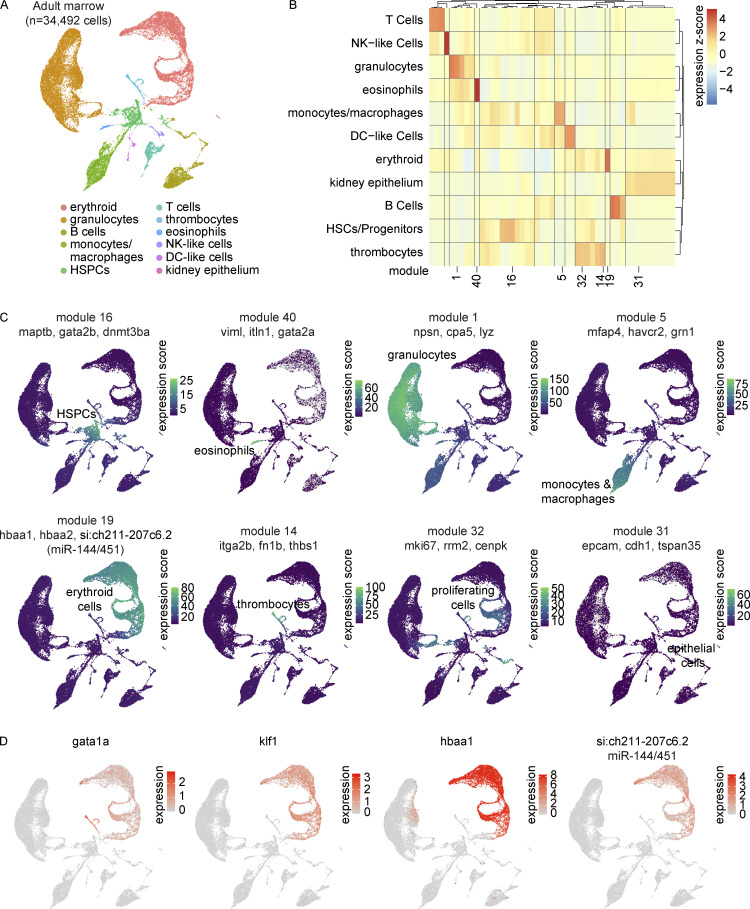
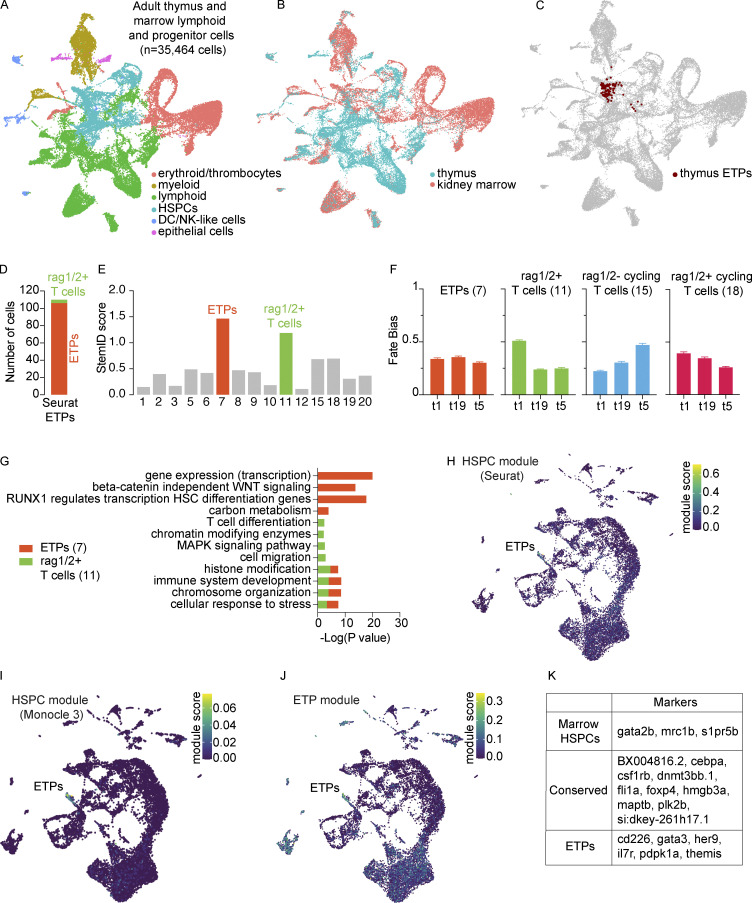
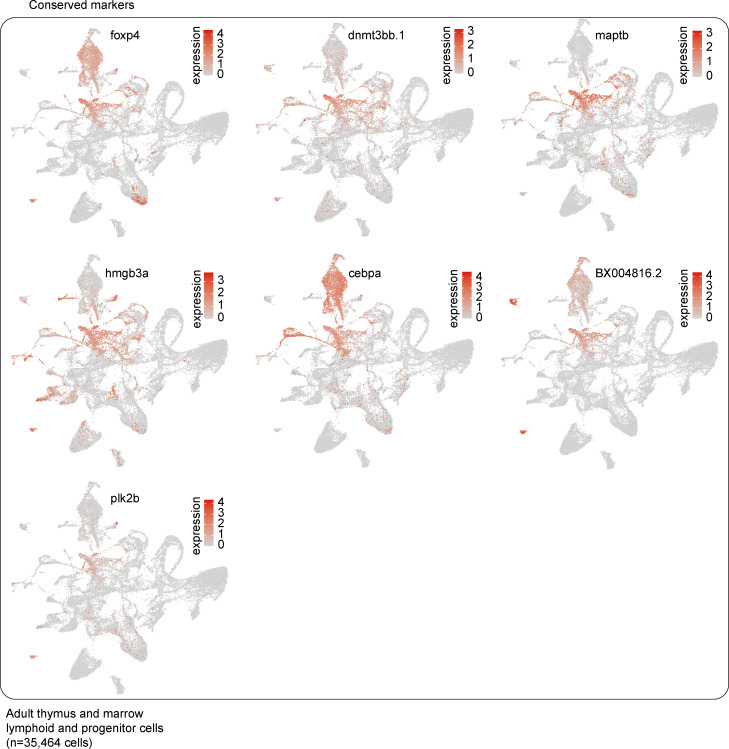
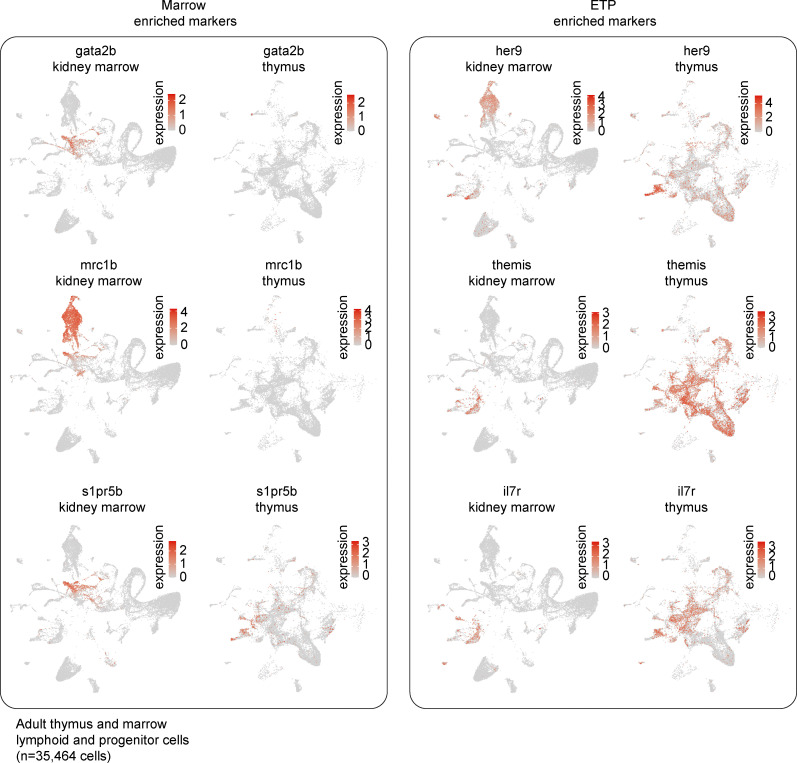
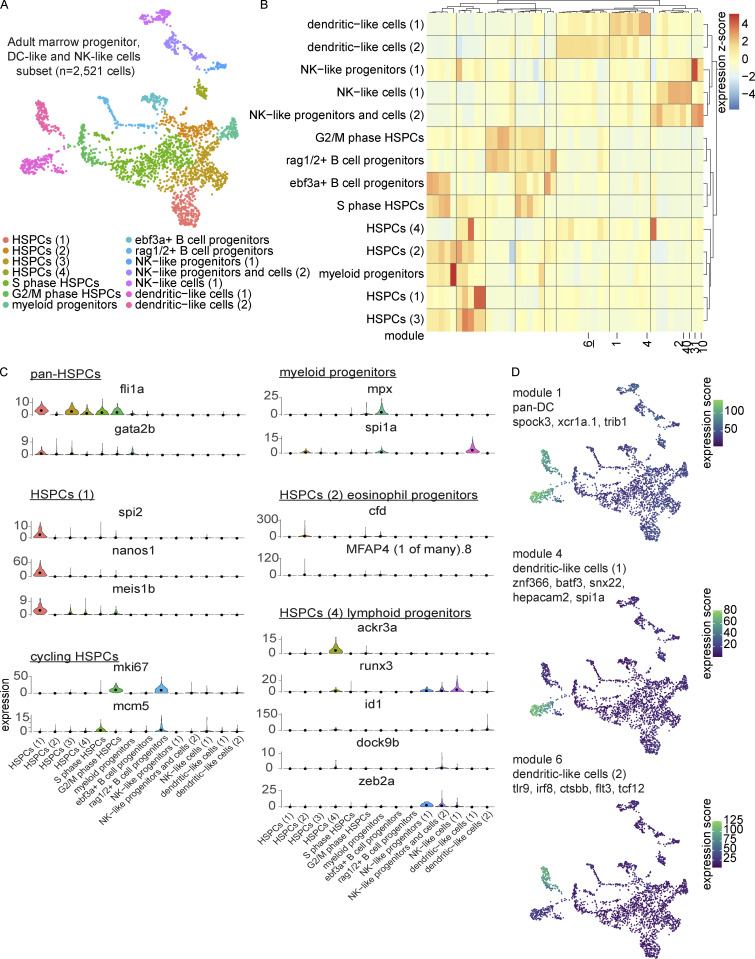
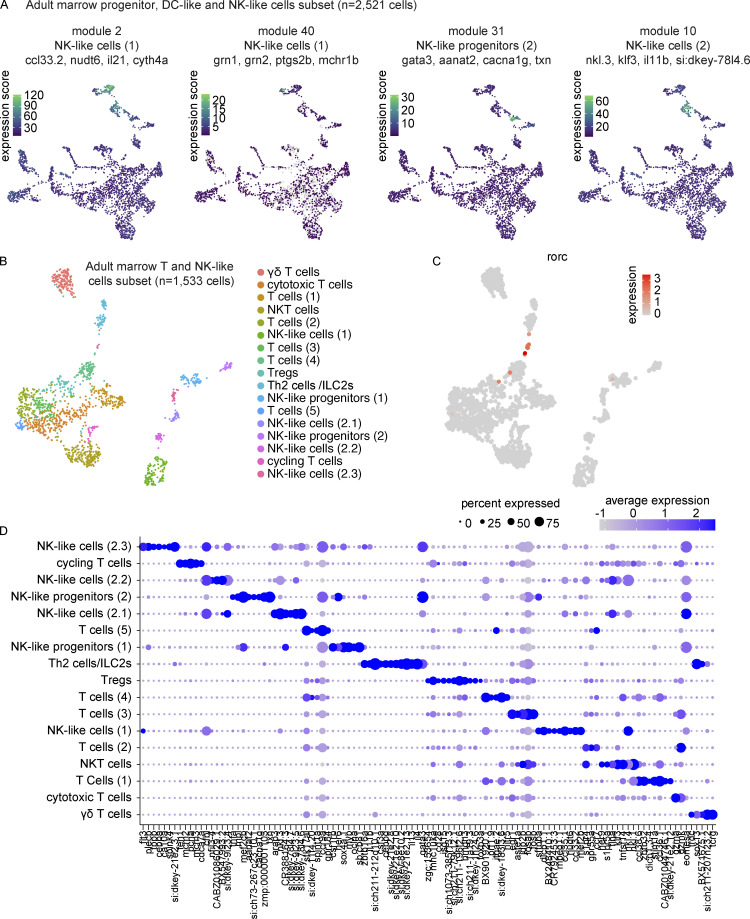
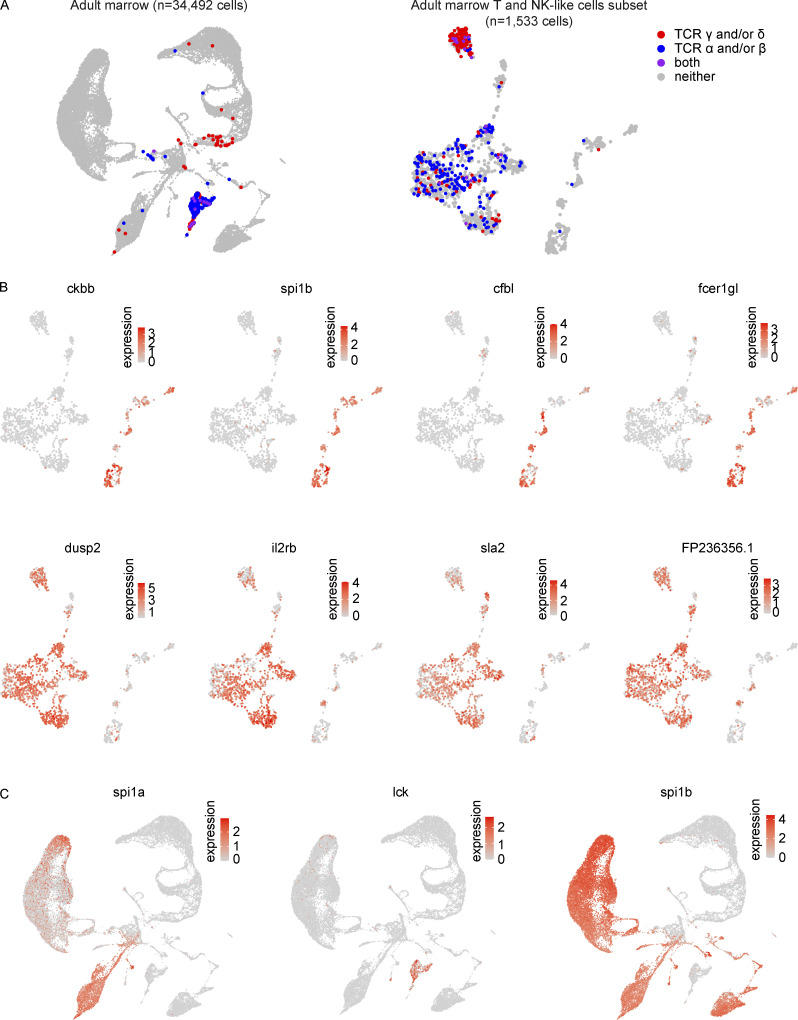
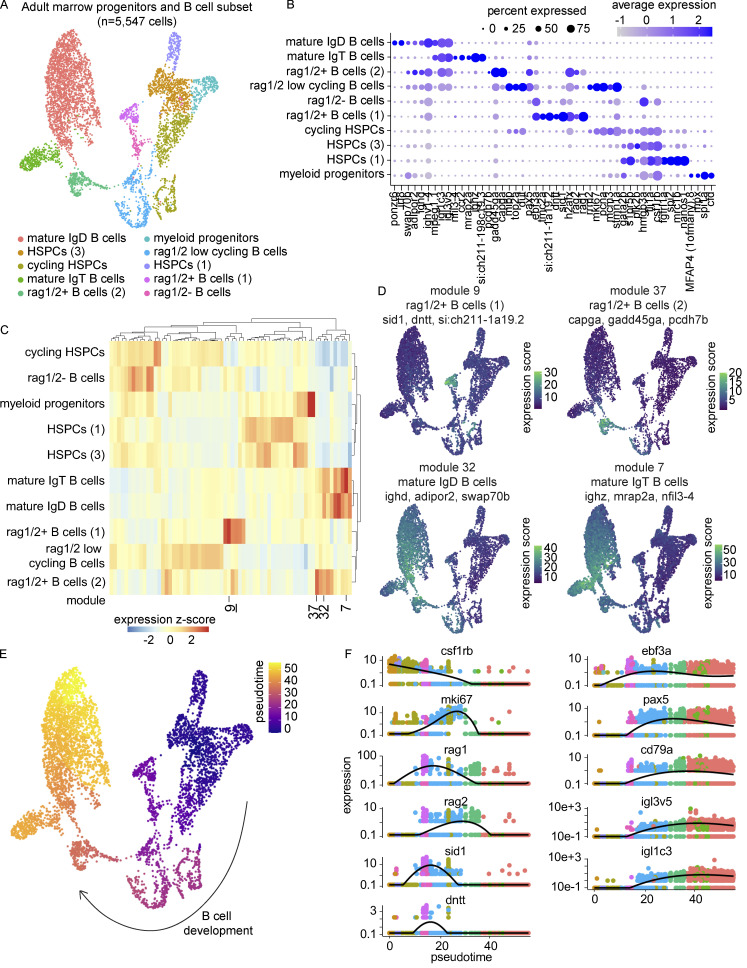
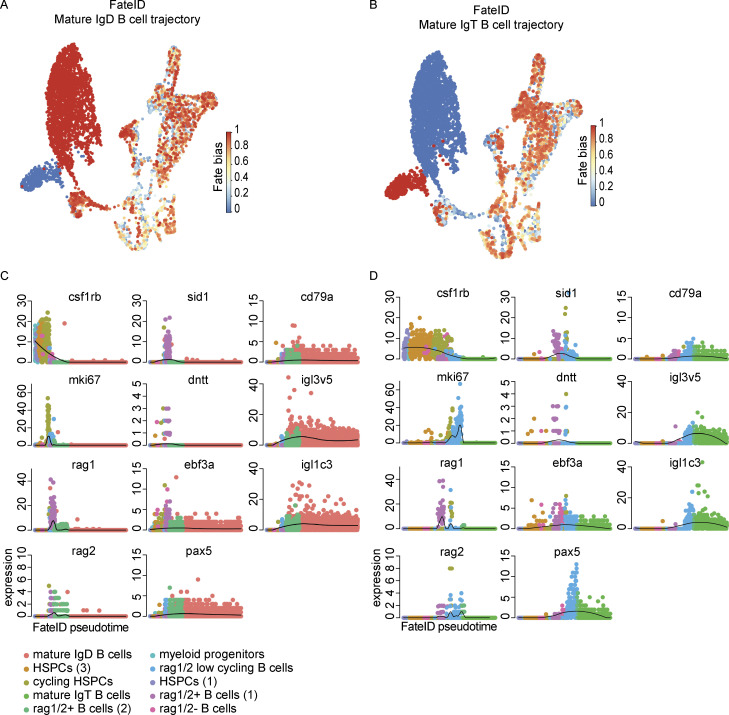
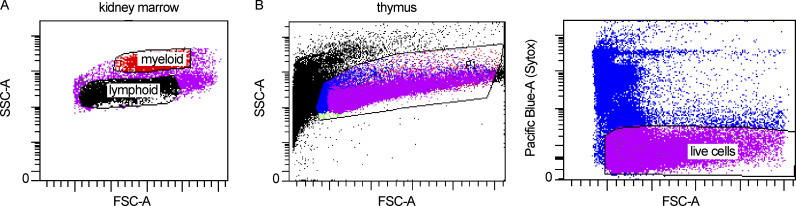
The zebrafish has proven to be a valuable model organism for studying hematopoiesis, but relatively little is known about zebrafish immune cell development and functional diversity. Elucidating key aspects of zebrafish lymphocyte development and exploring the breadth of effector functions would provide valuable insight into the evolution of adaptive immunity. We performed single-cell RNA sequencing on ∼70,000 cells from the zebrafish marrow and thymus to establish a gene expression map of zebrafish immune cell development. We uncovered rich cellular diversity in the juvenile and adult zebrafish thymus, elucidated B- and T-cell developmental trajectories, and transcriptionally characterized subsets of hematopoietic stem and progenitor cells and early thymic progenitors. Our analysis permitted the identification of two dendritic-like cell populations and provided evidence in support of the existence of a pre-B cell state. Our results provide critical insights into the landscape of zebrafish immunology and offer a foundation for cellular and genetic studies.


Conflict of interest statement

Disclosures: L.I. Zon reported personal fees from Fate Therapeutics, CAMP4 Therapeutics, Amagma Therapeutics, Scholar Rock, Branch Biosciences, Celularity, and Cellarity outside the submitted work. No other disclosures were reported.

Figures

None
Graphical abstract
Figure 1.
Figure 1.
Transcriptional characterization of the zebrafish thymus. (A) UMAP visualization of 14,394 cells obtained from the thymi of four adult zebrafish (3–4 mpf). All thymi were dissected and processed within the same experiment. Cell type annotations were based on enriched markers (Table S1) that were identified by Wilcoxon rank sum test. (B) Dot plot of selected markers of the adult thymus showing expression across T cell populations. See Fig. S1 A for full dot plot. Dot size reflects the percentage of cells within a population expressing a given marker and dot color shows the average expression within that population. (C) UMAP visualization of 35,268 cells obtained from the thymi of four adult zebrafish and four technical replicates of juvenile zebrafish (4 wpf; pool of cells from 21 zebrafish). Cell type annotations were based on enriched markers (Table S2) that were identified by Wilcoxon rank sum test and nomenclature consistent with (A) was used when appropriate. The adult and juvenile thymi were dissected and processed in independent experiments. (D) Dot plot of selected markers of the adult and juvenile thymi highlighting the expression of newly/better-resolved clusters following integration. (E) Bar plot of the beta-binomial test comparing cell type composition of the juvenile and adult thymi (Table S3). The average fold change for each cell type is depicted by bar length and direction, with negative values enriched in the adult thymus and positive values enriched in the juvenile thymus. Statistical significance is shown for Benjamini-Hochberg adjusted P values: *, P < 0.05; **, P < 0.01. (F) Dot plot of selected markers distinguishing the epithelial and fibroblast-like populations from the subset analysis visualized by UMAP in Fig. S2 A and identified by the Wilcoxon rank sum test (Table S5). nTEC, neural TEC; mito, mitochondrial-gene expressing; CMJ, corticomedullary junction; sTEC, structural TEC.
Figure S1.
Figure S1.
Extended cell type characterizations of the zebrafish thymus. (A) Dot plot of selected markers of the adult thymus showing expression across all cell populations, an expanded version of Fig. 1 B (see also Table S1). Dot size reflects the percentage of cells within a population expressing a given marker and dot color shows the average expression within that population. Similarly to Fig. 1, A and B, thymi were derived from four adult zebrafish (3–4 mpf) processed within the same experiment. (B) UMAP visualization by timepoint of the 35,268 adult and juvenile thymus cells integrated in Seurat. These cells were derived from the thymi of four adult zebrafish and four technical replicates of juvenile zebrafish (4 wpf; pool of cells from 21 zebrafish) processed in two independent experiments as in Fig. 1 C. (C) Heatmap visualization of selected genes to demonstrate heterogeneity within the mixed granulocyte population as determined by analysis of the integrated adult and juvenile thymus cells. (D) UMAP visualization of detection of TCR γ and/or δ (red), α and/or β (blue), or a combination of both sets of receptors (purple) in the integrated adult and juvenile thymi. (E–G) UMAP visualizations of the expression of ribosomal genes (E) rps29, (F) rps15a, and (G) rplp1 that demonstrated differential expression in erythrocytes derived from juvenile vs. adult thymi as determined by Wilcoxon rank sum test in Seurat (Table S4).
Figure S2.
Figure S2.
Zebrafish TECs and T cell developmental trajectories. (A) UMAP visualization of the 937 cells within the TEC and fibroblast populations of the combined adult and juvenile thymi as subsetted and re-analyzed to improve resolution of cell populations. Cell type annotations were based on differential expression analysis as determined by Wilcoxon rank sum test in Seurat (Table S5). (B) UMAP visualization of the expression of the epithelial marker, epcam, within the TEC and fibroblast subset. (C) Bar plot of beta-binomial test comparing composition of epithelial and fibroblast subset between juvenile and adult thymi (Table S6). Average fold change for each subpopulation is depicted by bar length and direction, with negative values enriched in the adult thymus and positive values enriched in the juvenile thymus. Statistical significance is shown for Benjamini-Hochberg adjusted P values: *, P < 0.05; **, P < 0.01. (D) UMAP visualization of RaceID3 clustering of cells derived from four adult thymi (n = 7,284 cells, independent analysis from Seurat) by replicate. (E) FateID principal curves fitted to mature T cell, cytotoxic T cell, and γδ T cell trajectories. (F) UMAP visualization of adult thymus and lymphoid and progenitor marrow fraction integrated together in Seurat (n = 35,464 cells) colored by cluster. These cells were derived from seven adult zebrafish dissected and processed in three independent experiments; paired marrow and thymi were obtained from two zebrafish as in Fig. 5, A–C. Cluster 4 is where the majority of thymus ETPs were highlighted in Fig. 5 C. (G) UMAP visualizations of marker genes used to identify the HSPC cluster (cluster 4). nTEC, neural TEC; mito, mitochondrial-gene expressing; CMJ, corticomedullary junction; sTEC, structural TEC.
Figure 2.
Figure 2.
Trajectory analysis of the adult thymus using FateID. (A) RaceID3 UMAP visualization of the adult thymus progenitor and T cell subset. This subset of cells was derived from four adult zebrafish (3–4 mpf) dissected and processed within the same experiment. Cell type annotations were based on enriched markers and nomenclature consistent with Seurat clustering was used when appropriate. Circle outlines group multiple RaceID3 clusters falling within one Seurat-assigned cell type. (B) Dot plot of selected markers of the adult thymus progenitor and T cell subset showing expression across T cell populations. Dot size reflects the percentage of cells within a population expressing a given marker and dot color shows the log2 transformation of expression within that population. (C) Fate bias visualization depicts in color (red = high, blue = low) the probability that a cell will be assigned to the γδ T cell trajectory. Fate bias is 1 for the γδ T cell lineage-defining cluster, cluster 5, whereas clusters 1 and 19, lineage-defining clusters for the mature T cell and cytotoxic T cell trajectories, respectively, have a fate bias of 0. (D) Left: Fate bias visualization depicts in color (red = high, blue = low) the probability that a cell will be assigned to the mature T cell trajectory. Fate bias is 1 for the mature T cell lineage-defining cluster, cluster 1, whereas clusters 5 and 19, lineage-defining clusters for the γδ T cell and cytotoxic T cell trajectories, respectively, have a fate bias of 0. Middle: SOM for the mature T cell trajectory demonstrating pseudotime expression, grouping genes into nodes with RaceID3 cluster labeling along the x axis. Expression z-score is reflected by the color bar, with red being the highest and blue being the lowest. See also Table S7. Right: Pseudotime plots of the expression of cd4-1, cd4-2.1, cd8a, cd8b, csf1rb, and il2rb in the mature T cell trajectory. (E) Left: Fate bias visualization depicting in color (red = high, blue = low) the probability that a cell will be assigned to the cytotoxic T cell trajectory. Fate bias is 1 for the cytotoxic T cell lineage-defining cluster, cluster 19, whereas clusters 1 and 5, lineage-defining clusters for the mature T cell and γδ T cell trajectories, respectively, have a fate bias of 0. Middle: SOM for the cytotoxic T cell trajectory demonstrating pseudotime expression, grouping genes into nodes with RaceID3 cluster labeling along the x axis. Expression z-score is reflected by the color bar, with red being the highest and blue being the lowest. See also Table S7. Right: Pseudotime plots of the expression of csf1rb, cd4-1, cd4-2.1, cd8a, cd8b, csf1rb, and il2rb in the cytotoxic T cell trajectory.
Figure 3.
Figure 3.
Trajectory analysis of the adult thymus using Monocle 3. (A) Monocle 3 UMAP visualization of the adult thymus progenitor and T cell subset. This subset of cells was derived from four adult zebrafish (3–4 mpf) dissected and processed within the same experiment. (B and C) UMAP visualization of the (B) mature T cell trajectory and (C) cytotoxic T cell trajectory colored by pseudotime as computed in Monocle 3. (D and E) Pseudotime plots of (top) CD4 orthologs (sum of cd4-1, cd4-2.1, cd4-2.2 expression), (middle) CD8 orthologs (sum of cd8a and cd8b expression), and (bottom) dual CD4 and CD8 ortholog expression (minimum value of top and middle plots) in the (D) mature T cell trajectory and (E) cytotoxic T cell trajectory.
Figure 4.
Figure 4.
Transcriptional characterization of the adult zebrafish marrow. (A) UMAP visualization of 34,492 cells obtained from five zebrafish marrows. Marrows were dissected and processed in three independent experiments. Distinct cell lineages are denoted in different colors. Lineages were determined by differential gene expression (Wilcoxon rank sum test in Seurat) and gene module analysis in Monocle 3 (Table S8). (B) Gene module clustered heatmap of zebrafish marrow grouped by cell lineage. Color scale shows relative module enrichment (red) or depletion (blue). (C) UMAP visualizations of highlighted gene modules in panel B. (D) UMAP visualizations of canonical erythrocyte lineage genes gata1a, klf1, and hbaa1 in addition to the newly appreciated si:ch211-207c6.2. This gene is one of the most specific erythrocyte genes identified at the transcriptional level in this dataset and was later determined to be a transcript containing the sequences of both miR-144 and miR-451.
Figure 5.
Figure 5.
Identification and characterization of ETPs. (A and B) UMAP visualizations of the adult thymus and lymphoid and progenitor marrow fraction integrated together in Seurat (n = 35,464 cells) annotated by (A) cell lineage and (B) tissue of origin. These cells were derived from seven adult zebrafish dissected and processed in three independent experiments; paired marrow and thymi were obtained from two zebrafish. (C) UMAP visualization of Seurat ETPs (cluster 38, resolution = 3; Table S1) on the integrated adult thymus and lymphoid and progenitor marrow fraction UMAP. Highlighted cells fall predominately in the integrated HSPC cluster. (D) Assessment of the Seurat ETPs (cluster 38, resolution = 3) in RaceID3 analysis; the majority of Seurat ETPs were in RaceID3 cluster 7. (E) StemID score, the product of transcription entropy and number of inter-cluster links, displayed across all clusters; clusters 7 (ETPs) and 11 (rag1/2+ T cells) are highlighted in their respective cluster colors for having the highest StemID scores. (F) Fate bias probabilities within early clusters (highest StemID scores) across the three trajectories. Error bars depict SEM. (G) Enriched pathways determined using Metascape for the two earliest clusters (7 and 11) as predicted by FateID and StemID2. Negative log base 10 P values are plotted for a relevant subset of enriched pathways. (H–J) UMAP visualizations of gene modules in the adult thymus: (H) Seurat HSPC module (top 20 HSPC-enriched genes by specificity from Wilcoxon rank sum test), (I) Monocle 3 HSPC module, and (J) literature-based ETP gene module. See Materials and methods and Table S9 for module determination and the specific genes comprising each module, respectively. (K) Conserved and differentially expressed gene markers between thymic ETPs and marrow HSPCs as determined by Wilcoxon rank sum test (Tables S10 and S11). For the identification of conserved markers, P values were combined using Tippett’s method (minimum P value).
Figure S3.
Figure S3.
Conserved genes between marrow HSPCs and ETPs. UMAP visualizations of subset of genes identified as being conserved across thymic marrow HSPCs and ETPs; 7 of 10 conserved genes listed in Fig. 5 K are shown here as the other three conserved genes were visualized in Fig. S2 G (see also Table S10). Marker conservation was determined by Wilcoxon rank sum test; P values for the ETPs and HSPCs were combined using Tippett’s method (minimum P value).
Figure S4.
Figure S4.
Differentially expressed genes between marrow HSPCs and ETPs. UMAP visualizations of subset of genes identified as being differentially expressed between marrow HSPCs and ETPs by Wilcoxon rank sum test (three shown for each; see also Table S11).
Figure 6.
Figure 6.
Transcriptional characterization of marrow subset of HSPCs, DC-like cells, and NK-like cells. (A) UMAP visualization of 2,521 DC-like cells, NK-like cells, and progenitors subsetted from the larger marrow UMAP. Cell type annotations were based on differential expression, as determined by Wilcoxon rank sum test in Seurat and gene module analysis in Monocle 3 (Table S12). (B) Gene module clustered heatmap of DC-like cells, NK-like cells, and progenitors grouped by cell type. Color scale shows relative module enrichment (red) or depletion (blue). (C) Violin plots of differentially expressed genes as determined by Wilcoxon rank sum test among HSPC clusters. (D) UMAP visualizations of gene modules enriched across all DC-like cell populations (module 1) and specific to either the cDC population (DC-like cells [1]; module 4) or the plasmacytoid-like DC population (DC-like cells [2]; module 6).
Figure 7.
Figure 7.
Transcriptional characterization of marrow NK-like and T cell subpopulations. (A) UMAP visualizations of gene modules enriched across NK-like populations in the progenitor, DC-like cell, and NK-like cell marrow subset. (B) UMAP visualization of 1,533 T and NK-like cells as subsetted, re-integrated, and clustered from the larger marrow UMAP in Fig. 4 A. Cell type annotations were based on differential expression analysis as determined by Wilcoxon rank sum test in Seurat (Table S13). (C) UMAP visualization highlighting rorc+ T cells, too small a population to be resolved as an independent cluster, but nevertheless demonstrating clear heterogeneity. (D) Dot plot of selected markers differentially expressed across T and NK-like cell populations. Dot size reflects the percentage of cells within a population expressing a given marker and dot color shows the average expression within that population.
Figure 8.
Figure 8.
Distinguishing markers of NK-like cells and T cells. (A) UMAP visualization of detection of TCR γ and/or δ (red), α and/or β (blue), or a combination of both sets of receptors (purple) in the (left) larger marrow object and (right) T and NK-like cell populations. (B) Top: UMAP visualizations of subset of genes identified in both Monocle 3 top markers analysis (limited to top 25 most specific genes as ranked by Jensen-Shannon divergence) and Seurat differential expression analysis (Wilcoxon rank sum test) as being significantly enriched in NK-like cells vs. T cells (Table S14). Bottom: UMAP visualizations of subset of genes identified in both Monocle 3 top markers analysis and Seurat differential expression analysis as being significantly enriched in T cells vs. NK-like cells. FP236356.1 is a 109,805 bp region that includes TCR β constant 1 (trbc1; Table S14). (C) UMAP visualizations of expression of spi1a, spi1b, and lck in the marrow. Expression of spi1a is observed in a subset of spi1b-expressing cells and may distinguish myeloid and lymphoid cells. NK-like cells here are spi1b+ while T cells are spi1b negative. DC-like cells (2) are spi1alck+ whereas DC-like cells (1) are spi1a+lck, further consistent with the hypothesis that DC-like cells (2) are plasmacytoid DCs and DC-like cells (1) are myeloid DCs and specifically akin to cDC1s.
Figure 9.
Figure 9.
Transcriptional characterization and trajectory analysis of B cell development using Monocle 3. (A) UMAP visualization of 5,547 B cells and progenitors from the marrow. Cell type annotations were based on differential expression as determined by the Wilcoxon rank sum test in Seurat and gene module analysis in Monocle 3 (Tables S15 and S16). Nomenclature consistent with Fig. 6 A was used for the HSPC populations when appropriate. (B) Dot plot of selected markers differentially expressed across B and progenitor cell populations. Dot size reflects the percentage of cells within a population expressing a given marker and dot color shows the average expression within that population. (C) Gene module clustered heatmap of zebrafish B cells and progenitors grouped by cell type demonstrating cell type enrichments. Color scale shows relative module enrichment (red) or depletion (blue). (D) UMAP visualizations of gene modules enriched in different stages of B cell development. (E) UMAP visualization of B cells and progenitors colored by pseudotime as computed in Monocle 3. (F) Gene expression dynamics over pseudotime computed in Monocle 3 colored by cluster assignment for 11 genes related to B cell development.
Figure 10.
Figure 10.
Trajectory analysis of B cell development using FateID. (A and B) UMAP visualizations where fate bias is depicted in color (red = high, blue = low) and represents the probability that a cell will be assigned to a given lineage. The lineage-defining clusters (A) mature IgD B cells and (B) mature IgT B cells have a fate bias of 1 in their respective trajectory maps and a fate bias of 0 in the other. (C and D) Pseudotime plots of the expression of csf1rb, mki67, rag1, rag2, sid1, dntt, ebf3a, pax5, cd79a, igl3v5, and igl1c3 in the (C) mature IgD B cell trajectory and (D) mature IgT B cell trajectory.
Figure S5.
Figure S5.
Fluorescence-activated cell sorting gates for marrow and thymus. (A and B) Representative fluorescence-activated cell sorting gating for (A) kidney marrow and (B) thymus sorts. The lymphoid gate of the marrow encompasses both lymphoid and progenitor cells whereas the myeloid gate contains mostly granulocytes. All live, single cells were sorted from the thymi. SSC-A, side scatter area; FSC-A, forward scatter area.

Similar articles

Cited by

References

    1. Agulleiro, M.J., Roy S., Sanchez E., Puchol S., Gallo-Payet N., and Cerda-Reverter J.M.. 2010. Role of melanocortin receptor accessory proteins in the function of zebrafish melanocortin receptor type 2. Mol. Cell. Endocrinol. 320:145–152. 10.1016/j.mce.2010.01.032 - DOI - PubMed
    1. Alt, F.W., and Baltimore D.. 1982. Joining of immunoglobulin heavy chain gene segments: Implications from a chromosome with evidence of three D-JH fusions. Proc. Natl. Acad. Sci. USA. 79:4118–4122. 10.1073/pnas.79.13.4118 - DOI - PMC - PubMed
    1. Athanasiadis, E.I., Botthof J.G., Andres H., Ferreira L., Lio P., and Cvejic A.. 2017. Single-cell RNA-sequencing uncovers transcriptional states and fate decisions in haematopoiesis. Nat. Commun. 8:2045. 10.1038/s41467-017-02305-6 - DOI - PMC - PubMed
    1. Avagyan, S., Weber M.C., Ma S., Prasad M., Mannherz W.P., Yang S., Buenrostro J.D., and Zon L.I.. 2021. Single-cell ATAC-seq reveals GATA2-dependent priming defect in myeloid and a maturation bottleneck in lymphoid lineages. Blood Adv. 5:2673–2686. 10.1182/bloodadvances.2020002992 - DOI - PMC - PubMed
    1. Bachem, A., Hartung E., Guttler S., Mora A., Zhou X., Hegemann A., Plantinga M., Mazzini E., Stoitzner P., Gurka S., et al. . 2012. Expression of XCR1 characterizes the batf3-dependent lineage of dendritic cells capable of antigen cross-presentation. Front. Immunol. 3:214. 10.3389/fimmu.2012.00214 - DOI - PMC - PubMed

Publication types