. 2022 Sep 5;221(9):e202112068.
doi: 10.1083/jcb.202112068. Epub 2022 Aug 8.

Seipin concentrates distinct neutral lipids via interactions with their acyl chain carboxyl esters

Affiliations

Seipin concentrates distinct neutral lipids via interactions with their acyl chain carboxyl esters

Mike F Renne et al. J Cell Biol. .

Abstract

Lipid droplets (LDs) are essential for cellular lipid homeostasis by storing diverse neutral lipids (NLs), such as triacylglycerol (TAG), steryl esters (SE), and retinyl esters (RE). A proper assembly of TAG-containing LDs at the ER requires Seipin, a conserved protein often mutated in lipodystrophies. Here, we show that the yeast Seipin Sei1 and its partner Ldb16 also promote the storage of other NL in LDs. Importantly, this role of Sei1/Ldb16 is evolutionarily conserved as expression of human-Seipin restored normal SE-containing LDs in yeast Seipin mutants. As in the case of TAG, the formation of SE-containing LDs requires interactions between hydroxyl-residues in human Seipin or yeast Ldb16 with NL carboxyl esters. These findings provide a universal mechanism for Seipin-mediated LD formation and suggest a model for how Seipin distinguishes NLs from aliphatic phospholipid acyl chains in the center of the membrane bilayer.


Figures

Figure S1.
Figure S1.
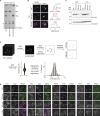
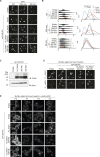
Characterization of lipid droplets in WT, TAG-only, SE-only cells. Related to Fig. 1. (A) Neutral lipid analysis by thin layer chromatography for WT, dga1Δlro1Δ (SE-only) and are1Δare2Δ (TAG-only) cells. Spots corresponding to phospholipids (PL), triacylglycerol (TAG), sterol esters (SE) and squalene (SQL) were identified based on Rf-values of previously run standards. (B) Left: Fluorescence micrographs of LDs in WT, are1Δare2Δ (TAG-only), dga1Δlro1Δ (SE-only) cells cultured to late stationary phase in SC-ino media as in Fig. 1 A. Merge of BODIPY (NL stain) and Erg6 (LD marker protein) is shown. Boxes (5 × 5 μm) indicate location of zoom blow-up images (middle). Line in the zoom images indicates location of line intensity plots (right). (C) Schematic overview of LD size quantification. LDs were stained with BODIPY and imaged by super resolution fluorescence microscopy (35 z-planes, total depth 8.4 μm). Z-planes were projected for maximum intensity, and LDs were segmented by thresholding yielding binary images. Overlapping LDs were separated using the binary watershed function and analyzed using the particle analysis function with ellipses being fitted on all particles (circularity cut off 0.8–1.0). The major axis of the fitted ellipses was used to determine LD diameter. The yielded LD diameter distribution was converted to histograms using distribution analysis, and non-linear regression analysis compared the fit of gaussian (normal) or Log-normal distribution. (D) Localization of Scs3, Yft2, Pex30, and Nem1 in WT, TAG-only, SE-only and no LDs cells. Proteins of interest were expressed from their endogenous loci as C-terminal fusions to mNeonGreen and Erg6-mCherry was used as LD marker. Scale bars correspond to 5 μm. (E) Expression levels of Pln1 in indicated mutants cultured to late stationary phase at 30 or 37°C. Whole cell lysates were separated by SDS-PAGE and analyzed by immunoblot with anti-Pln1 antibody. Dpm1 was used as a loading control and detected with an anti-Dpm1 antibody. Source data are available for this figure: SourceData FS1.
Figure 1.
Figure 1.
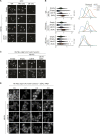
Characterization of lipid droplets in WT, TAG-only, SE-only cells. (A) Fluorescence micrographs of LDs in WT, are1Δare2Δ (TAG-only), dga1Δlro1Δ (SE-only), and dga1Δlro1Δare1Δare2Δ (no NLs). Cells were cultured to late stationary phase, and LDs were visualized by BODIPY-staining and the LD marker protein Erg6-mCherry. Scale bars correspond to 5 μm. (B) Quantification of LD size and LD per cell in cells with the indicated genotype (labeled according to A). LD size was quantified for a minimum of 150 LDs/genotype and at least 100 cells/genotype were quantified to determine the number of LD per cell. Difference in LD size and LD/cell was analyzed by non-parametric testing (Kruskal–Wallis test) followed by Dunn’s multiple comparison analysis (*, P < 0.05; ****, P < 0.0001). (C–E) Localization of Sei1 (C), Ldb16 (D) and Pln1 (E) in WT, TAG-only, SE-only, or no LDs cells. Proteins of interest were expressed from their endogenous loci as C-terminal fusions to mNeonGreen and Erg6-mCherry was used as LD marker. Scale bars correspond to 5 μm.
Figure S2.
Figure S2.
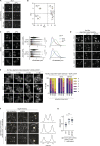
Sei1/Ldb16 Seipin complex is required for normal morphology and biogenesis of TAG-only and SE-only LDs. Related to Figs. 2 and 3. (A) Fluorescence micrographs of LDs in WT, TAG-only and SE-only cells cultured in inositol free media to late stationary phase at indicated temperature. Erg6 serves as LD marker protein, scale bars correspond to 5 μm. (B) Principal Component Analysis (PCA) of lipid molecular species composition (in mol%) of indicated mutants. Proportion of variance is 58.25% (PC1) and 13.17% (PC2). (C) Analysis of LD morphology in nem1Δ background strains with indicated genotypes. Cells were cultured in inositol free media at 30 or 37°C to late stationary phase, and LDs were stained with BODIPY. Scale bars correspond to 5 μm. (D) Analysis of LD morphology in no NL cells upon plasmid borne overexpression of the indicated NL synthesizing enzyme. Micrographs were taken after 24 h addition of galactose to induce the expression of the NL synthesizing enzymes. LDs were visualized using the NL dye BODIPY 493/503. Scale bars correspond to 5 μm. (E) Analysis of LD biogenesis upon induction of TAG synthesis by expression of the DAG acyltransferase Dga1. Plasmid-borne expression of Dga1 was induced by addition of galactose (final concentration 2%) to cells with the indicated genotype grown in raffinose-containing medium. LDs were stained with BODIPY at indicated timepoints (in minutes after galactose induction). Scale bars correspond to 5 μm. The number of LDs per cell was quantified for a minimum of 50 cells per timepoint. (F) Analysis of LD morphology in cells with indicated genotypes, expressing plasmid-borne human LRAT from the GAL1 promotor. Left: Fluorescence micrographs of Erg6-mCherry (z-max projections and single z-planes) are shown. Dashed boxes indicate location of blow-up images (8 × 8 µm), location of intensity profile is indicated by yellow lines. Right: Line intensity plot of Erg6-mCherry signal. Distance between peak maxima is indicative of LD size. LRAT expression was induced by the addition of galactose (final concentration 2%) and retinol was supplemented at 1 mM (in 1% Tergitol NP-40). LDs were visualized using Erg6-mCherry as a LD marker protein after 8 h of LRAT induction and retinol supplementation. Clustered and supersized LDs typical of sei1∆ and ldb16∆ mutants are indicated by red and yellow arrowheads, respectively. (G) Distance distribution of LD size as determined by Erg6-mCherry line intensity analysis (as in F). Circles show individual measurements, line indicates median (± 95% confidence interval). Difference in distributions were analyzed by non-parametric testing (Kruskal–Wallis test; P < 0.0001), followed by Dunn’s multiple comparison testing (****, P < 0.0001).
Figure 2.
Figure 2.
Cultivation at elevated temperature increases LD number and size in SE-only cells. (A) Fluorescence micrographs of LDs in WT, TAG-only, and SE-only cells cultured in inositol-free media to late stationary phase at the indicated temperature. LDs were stained with BODIPY, scale bars correspond to 5 μm. (B) Quantification of LD size in WT, TAG-only, and SE-only cells cultured at indicated temperatures as in A. Left: plot of individual LD diameter measurements. Bars and whiskers indicate mean with interquartile range. LDs were quantified in n = 3 biological independent experiments, with a minimum of 1,100 total LDs counted per genotype. Difference in distribution of LD size was analyzed by non-parametric testing (Kruskal–Wallis test) followed by Dunn’s multiple comparison analysis (**, P < 0.01; ****, P < 0.0001). Right: Non-linear regression fitted Gaussian-curves of histograms of LD diameter frequency distribution (bin-width 0.05 μm). Difference in mean of the Gaussian fits was compared by extra sum-of-squares F-test (****, P < 0.0001; n.s., non significant). (C) Lipid class composition in mol% of total lipids analyzed. Lipids classes detected <2% are shown (phosphatidylcholine, PC; phosphatidylethanolamine, PE; phosphatidylinositol, PI; phosphatidic acid, PA; diacylglycerol, DAG; ergosteryl ester, EE; triacylglyercol, TAG). Bars indicate mean with individual datapoints (n = 3) shown. Indicated mutants cultured to stationary phase at T = 30°C (light bars) or T = 37°C (dark bars). EE was not detected in the TAG-only mutant. Differences were tested using two-way ANOVA followed by multiple comparisons with Tukey correction (**, P < 0.01; ***, P < 0.001; ****, P < 0.0001). (D) Glycerophospholipid (GPL) total acyl chain unsaturation (left) and length (right) in mol% of total GPL. Bars indicate mean with individual datapoints (n = 3) shown.
Figure 3.
Figure 3.
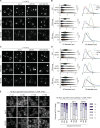
Sei1/Ldb16 Seipin complex is required for normal morphology and biogenesis of TAG-only and SE-only LDs. (A) Fluorescence micrographs of LDs in cells with indicated genotypes. Cells were cultured in inositol-free media at 30°C to late stationary phase, and LDs were stained with BODIPY. Scale bars correspond to 5 μm. (B) Quantification of LD size in cells with indicated genotype grown as in A. Left: of individual LD diameter measurements. Bars and whiskers indicate mean with interquartile range. LDs were quantified in n = 4 biological independent experiments (n = 3 for sei1Δldb16Δ; ΔΔ), with a minimum of 1,500 total LDs counted per genotype. The difference in distribution of LD size was analyzed by non-parametric testing (Kruskal–Wallis test) followed by Dunn’s multiple comparison analysis (****, P < 0.0001). Right: non-linear regression fitted curves of histograms of LD diameter frequency distribution (bins 0.05 μm). Non-linear regression tested fits of normal (Gaussian) or log-normal curves and the most probable fit (>99.99% certainty) is shown. (C) As in A, but cells were grown at 37°C. (D) As in B, but cells were grown at 37°C. (E) Analysis of LD biogenesis upon induction of SE synthesis by expression of the SE acyltransferase Are1. Plasmid-borne expression of Are1 was induced by the addition of galactose (final concentration 2%) to cells with the indicated genotype grown in raffinose media. LDs were stained with BODIPY at indicated time points (in minutes after galactose induction). Scale bars correspond to 5 μm. The number of LDs per cell was counted in a minimum of 50 cells per genotype per timepoint.
Figure 4.
Figure 4.
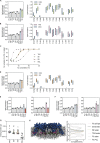
Seipin enriches TAG and SE via interactions with its hydrophobic helix. (A) Initial (0 µs) and final (5 µs) top-view snapshots of coarse-grained MD simulations showing enrichment of TAG (pink, left panels) and SE (green, right panels) by human Seipin (blue). (B) Analysis of lipid enrichment by human Seipin shown as a fraction of total lipids inside the Seipin ring. The dashed line indicates the fraction of the membrane surface occupied by the Seipin ring. Bars represent the average of three independent simulations (circles). (C) Snapshot of MD simulations highlighting human Seipin interaction with TAG (left, pink) and SE (right, green). Human Seipin is shown in dark blue, with S165/166 in the HH depicted as light blue spheres. NL beads are colored as shown in panel E/F, with the carboxyl esters in dark pink (TAG) or dark green (SE). Poses were generated using PyLipID (Song et al., 2022). (D) Analysis of human Seipin HH residues occupancy by TAG (pink) and SE (green). Bars indicate minimum to maximum values with a line at the median.
Figure S3.
Figure S3.
Seipin enriches TAG and SE via interactions with its hydrophobic helix. Related to Figs. 4 and 5. (A and B) Analysis of lipid enrichment by human Seipin (left), shown as fraction of total lipids inside the Seipin ring, and analysis of human Seipin HH residues occupancy (right) by SE (A) or TAG (B) as a single NL present. For lipid enrichment (left), bars represent the mean of three independent simulations (circles). For HH occupancy, (right) bars min to max values with a line at the median. (C) Analysis of NL clustering dependency on NL concentration. Individual datapoints are shown, a five-point sigmoidal curve is fitted to guide the eye. (D) As (A and B) but analysis of RE enrichment by human Seipin (left), shown as fraction of total lipids inside the Seipin ring, and analysis of human Seipin HH residues occupancy (right). (E and F) Analysis of lipid enrichment by human Seipin in simulations containing FFA (E) or SQL (F) in the absence (left) or presence (right) of TAG. Dashed line indicates the fraction of the membrane surface occupied by the Seipin ring. Bars represent the mean of three independent simulations (circles). (G) Analysis of the NL-binding time to residues S165/166 of human Seipin. Binding time was measured using PyLipid package using a double cut off of 0.55 and 1.0 µm. Individual measurements are shown, bar and whiskers indicate median ± interquartile values. (H) Snapshot of TAG/SE enrichment by Seipin (left) and density analysis of selected groups along the bilayer perpendicular (z-axis; right). Density was normalized with maximum density set at 1. Bilayer normal (z = 0 nm) was defined as the z-coordinates with the maximum density for the PL acyl chain tips.
Figure 5.
Figure 5.
Seipin Serine165/166 interacts with NL carboxyl esters. Analysis of NL chemical group occupancy by Seipin S165 (top) and S166 (bottom). (A and B) Coarse-grained representations of the lipid beads of trioleoylglycerol (TAG, A) and cholesteryl oleate (SE, B) are shown on the respective molecular structures. Bars indicate minimum to maximum values with a line at the median.
Figure 6.
Figure 6.
Hydroxyl-containing residues in human Seipin are required for correct LD morphology in TAG-only and SE-only cells. (A) Analysis of LD morphology in cells with the indicated genotype by fluorescence microscopy. Human Seipin (Hs_Seipin) or indicated mutants were expressed in sei1Δldb16Δ (ΔΔ) mutants in indicated background strains. Cells were cultured in inositol-free media at 37°C to late stationary phase, and LDs were stained with BODIPY. Scale bars correspond to 5 μm. (B) Quantification of LD size in cells with indicated genotype grown as in A. Left: of individual LD diameter measurements. Difference in distribution of LD size was analyzed by non-parametric testing (Kruskal–Wallis test) followed by Dunn’s multiple comparison analysis (**, P < 0.01, ****, P < 0.0001). Right: non-linear regression fitted curves of histograms of LD diameter frequency distribution (bins 0.05 μm). Non-linear regression tested fits of normal (Gaussian) or Log-normal curves and most probable fit (>99.99% certainty) is shown.
Figure S4.
Figure S4.
Hydroxyl-containing residues in human Seipin are required for correct LD morphology in TAG-only and SE-only cells. Related to Fig. 6. (A) Analysis of LD morphology in cells with indicated genotype by super resolution fluorescence microscopy. Cells were cultured in inositol free media at 30°C to late stationary phase, and LDs were stained with BODIPY. Scale bars correspond to 5 μm. (B) Quantification of LD size in cells shown in A. A minimum of 100 LDs per genotype and two independent biological replicates were quantified. Bars and whiskers indicate mean with interquartile range. (C) Levels of FLAG-tagged WT human Seipin and its derivatives with mutations in S165/166, SS-AA and SS-DD, expressed in sei1∆ldb16∆ cells. Whole cell lysates were separated by SDS-PAGE and analyzed by immunoblot with anti-FLAG antibody. Dpm1 was used as a loding control and detected with an anti-Dpm1 antibody. (D) Analysis of LD biogenesis upon induction of SE synthesis by expression of the SE acyltransferase Are1. Plasmid-borne expression of Are1 was induced by addition of galactose (final concentration 2%) to cells with the indicated genotype grown in raffinose-containing medium. LDs were stained with BODIPY at indicated timepoints (in hours after galactose induction). Scale bars correspond to 5 μm. (E) Analysis of LD morphology in cells with indicated genotype upon plasmid borne overexpression of the NL enzymes Dga1 or Are1 which synthesize TAG or SE, respectively. Micrographs were take after 24 h addition of galactose to induce the expression of the NL synthesizing enzymes. LDs were visualized using the NL dye BODIPY 493/503. Scale bars correspond to 5 μm. Source data are available for this figure: SourceData FS4.
Figure 7.
Figure 7.
Hydroxyl-containing residues in yeast Ldb16 are required for correct LD morphology in TAG-only and SE-only cells. (A) Analysis of LD morphology in cells with the indicated genotype by fluorescence microscopy. Cells were cultured in inositol-free media at 37°C to late stationary phase, and LDs were stained with BODIPY. Scale bars correspond to 5 μm. (B) Quantification of LD size in cells with indicated genotype grown as in A. Left: Individual LD diameter measurements. The difference in distribution of LD size was analyzed by non-parametric testing (Kruskal–Wallis test) followed by Dunn’s multiple comparison analysis (**, P < 0.01, ****, P < 0.0001). Right: Non-linear regression fitted curves of histograms of LD diameter frequency distribution (bins 0.05 μm). Non-linear regression tested fits of normal (Gaussian) or log-normal curves and the most probable fit (>99.99% certainty) is shown.
Figure S5.
Figure S5.
Hydroxyl-containing residues in yeast Ldb16 are required for correct LD morphology in TAG-only and SE-only cells. Related to Fig. 7. (A) Analysis of LD morphology in cells with the indicated genotype by fluorescence microscopy. Cells were cultured in inositol free media at 30°C to late stationary phase, and LDs were stained with BODIPY. Scale bars correspond to 5 μm. (B) Quantification of LD size in cells shown in A. A minimum of 100 LDs per genotype and two independent biological replicates were quantified. Bars and whiskers indicate mean with interquartile range. (C) Analysis of LD morphology in cells with indicated genotype upon plasmid borne overexpression of the NL enzymes Dga1 or Are1 which synthesize TAG or SE, respectively. Micrographs were take after 24 h addition of galactose to induce the expression of the NL synthesizing enzymes. LDs were visualized using the NL dye BODIPY 493/503. Scale bars correspond to 5 μm. (D) Analysis of LD biogenesis upon induction of SE synthesis by expression of the SE acyltransferase Are1. Plasmid-borne expression of Are1 was induced by addition of galactose (final concentration 2%) to cells with the indicated genotype grown in raffinose-containing medium. LDs were stained with BODIPY at indicated timepoints (in hours after galactose induction). Scale bars correspond to 5 μm.
Figure 8.
Figure 8.
Model of Seipin enriching NLs via interactions between the hydrophobic helix and NL carboxyl esters. A model for Seipin-mediated packaging of structurally distinct NLs (TAG, pink; SE, green; RE, orange) into LDs. Seipin luminal domain (PDB accession no. 6DS5, visualized using Illustrate [Goodsell et al., 2019]) protrudes deeply into the ER membrane, positioning its hydroxyl-containing residues far away from PLs carboxyl esters (black circles) and proximal to the bilayer normal, a position that favors its interaction with NLs carboxyl esters (pink, green, and orange circles on TAG, SE, and RE, respectively). This interaction results in NL enrichment and nucleation within the Seipin ring. Arrows indicate the positions of TMs of the outer Seipin protomers.

Similar articles

Cited by

References

    1. Abraham, M.J., Murtola T., Schulz R., Páll S., Smith J.C., Hess B., and Lindahl E.. 2015. GROMACS: High performance molecular simulations through multi-level parallelism from laptops to supercomputers. SoftwareX. 1–2:19–25. 10.1016/j.softx.2015.06.001 - DOI
    1. Adeyo, O., Horn P.J., Lee S., Binns D.D., Chandrahas A., Chapman K.D., and Goodman J.M.. 2011. The yeast lipin orthologue Pah1p is important for biogenesis of lipid droplets. J. Cell Biol. 192:1043–1055. 10.1083/jcb.201010111 - DOI - PMC - PubMed
    1. Alessandri, R., Souza P.C.T., Thallmair S., Melo M.N., de Vries A.H., and Marrink S.J.. 2019. Pitfalls of the martini model. J. Chem. Theory Comput. 15:5448–5460. 10.1021/acs.jctc.9b00473 - DOI - PMC - PubMed
    1. Arlt, H., Sui X., Folger B., Adams C., Chen X., Remme R., Hamprecht F.A., DiMaio F., Liao M., Goodman J.M., et al. . 2022. Seipin forms a flexible cage at lipid droplet formation sites. Nat. Struct. Mol. Biol. 29:194–202. 10.1038/s41594-021-00718-y - DOI - PMC - PubMed
    1. Ben M’barek, K., Ajjaji D., Chorlay A., Vanni S., Forêt L., and Thiam A.R.. 2017. ER membrane phospholipids and surface tension control cellular lipid droplet formation. Dev. Cell. 41:591–604.e7. 10.1016/j.devcel.2017.05.012 - DOI - PubMed

Publication types

MeSH terms