. 2022 Jul 22:16:926794.
doi: 10.3389/fncel.2022.926794. eCollection 2022.

Inositol hexakisphosphate kinases differentially regulate trafficking of vesicular glutamate transporters 1 and 2

Affiliations

Inositol hexakisphosphate kinases differentially regulate trafficking of vesicular glutamate transporters 1 and 2

Haiyan Li et al. Front Cell Neurosci. .

Abstract

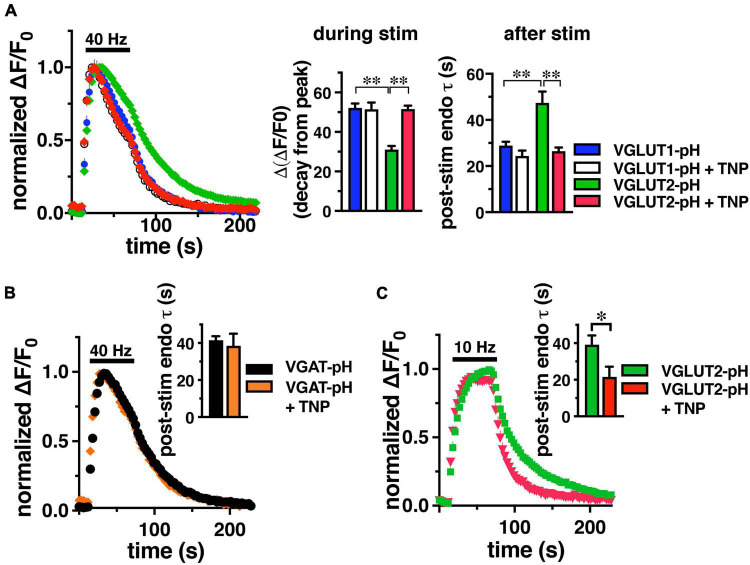
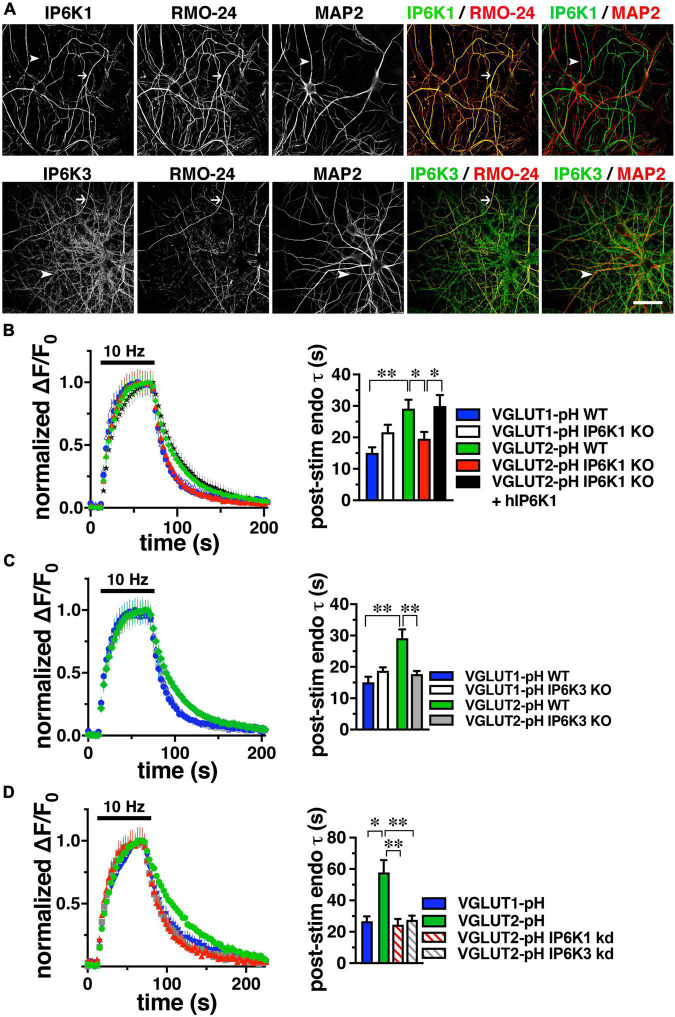
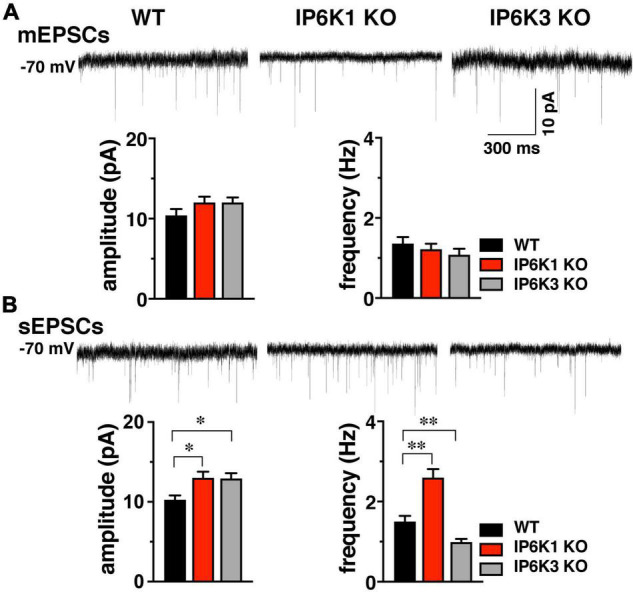
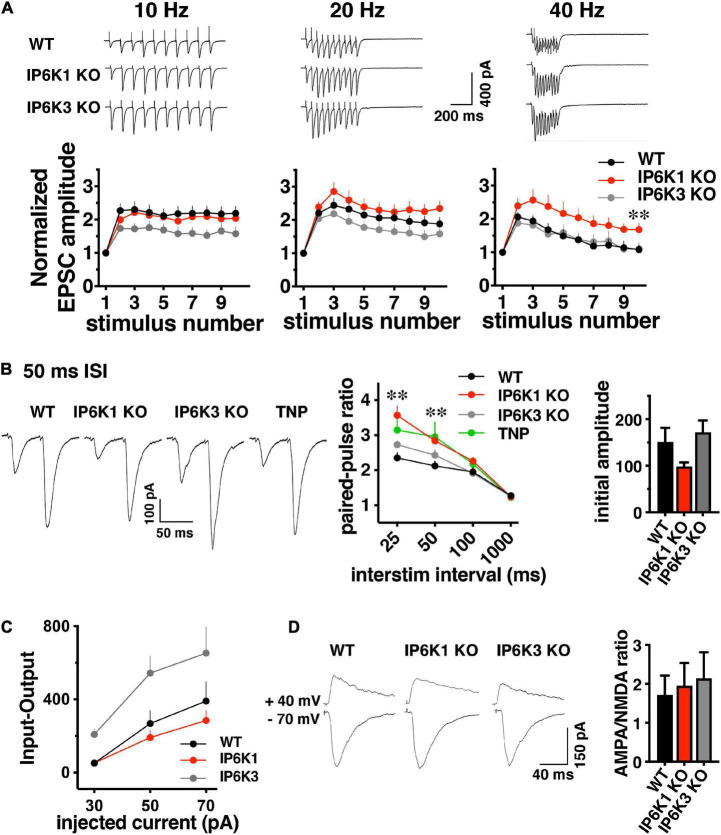
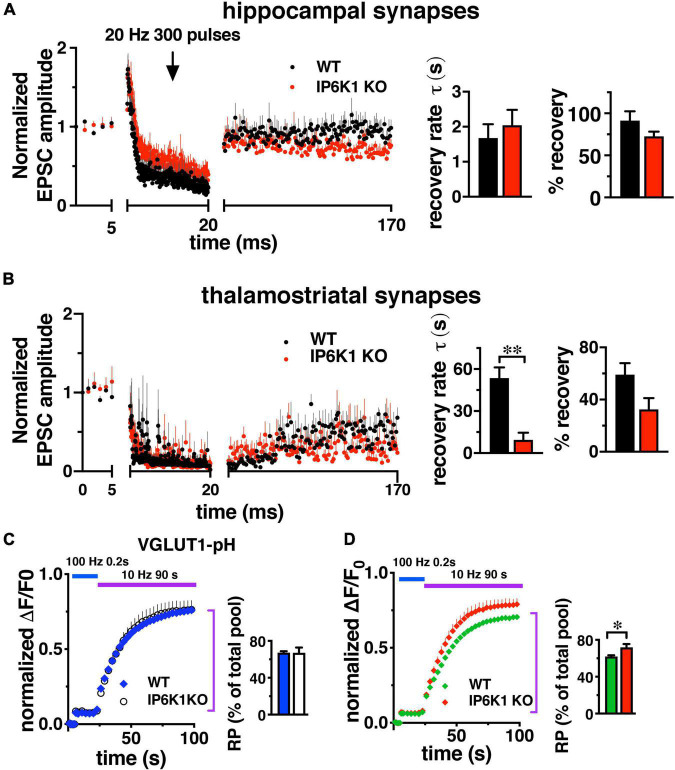
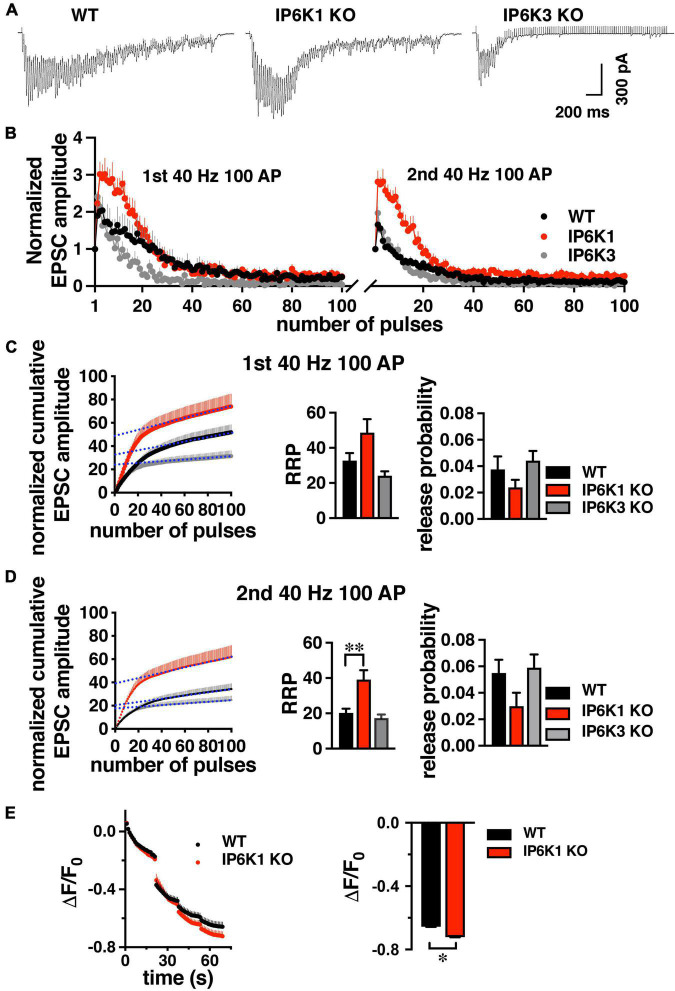
Inositol pyrophosphates have been implicated in cellular signaling and membrane trafficking, including synaptic vesicle (SV) recycling. Inositol hexakisphosphate kinases (IP6Ks) and their product, diphosphoinositol pentakisphosphate (PP-IP5 or IP7), directly and indirectly regulate proteins important in vesicle recycling by the activity-dependent bulk endocytosis pathway (ADBE). In the present study, we show that two isoforms, IP6K1 and IP6K3, are expressed in axons. The role of the kinases in SV recycling are investigated using pharmacologic inhibition, shRNA knockdown, and IP6K1 and IP6K3 knockout mice. Live-cell imaging experiments use optical reporters of SV recycling based on vesicular glutamate transporter isoforms, VGLUT1- and VGLUT2-pHluorins (pH), which recycle differently. VGLUT1-pH recycles by classical AP-2 dependent endocytosis under moderate stimulation conditions, while VGLUT2-pH recycles using AP-1 and AP-3 adaptor proteins as well. Using a short stimulus to release the readily releasable pool (RRP), we show that IP6K1 KO increases exocytosis of both VGLUT1-and VGLUT2-pH, while IP6K3 KO decreases the amount of both transporters in the RRP. In electrophysiological experiments we measure glutamate signaling with short stimuli and under the intense stimulation conditions that trigger bulk endocytosis. IP6K1 KO increases synaptic facilitation and IP6K3 KO decreases facilitation compared to wild type in CA1 hippocampal Schaffer collateral synapses. After intense stimulation, the rate of endocytosis of VGLUT2-pH, but not VGLUT1-pH, is increased by knockout, knockdown, and pharmacologic inhibition of IP6Ks. Thus IP6Ks differentially affect the endocytosis of two SV protein cargos that use different endocytic pathways. However, while IP6K1 KO and IP6K3 KO exert similar effects on endocytosis after stimulation, the isoforms exert different effects on exocytosis earlier in the stimulus and on the early phase of glutamate release. Taken together, the data indicate a role for IP6Ks both in exocytosis early in the stimulation period and in endocytosis, particularly under conditions that may utilize AP-1/3 adaptors.

Keywords: endocytosis; exocytosis; inositol hexakisphosphate kinase (IP6K); synaptic vesicle; vesicular glutamate transporter.


Conflict of interest statement

The authors declare that the research was conducted in the absence of any commercial or financial relationships that could be construed as a potential conflict of interest.

Figures

FIGURE 1
FIGURE 1
IP6K inhibition accelerates the rate of VGLUT2-pH endocytosis. (A) The time course of fluorescence changes (ΔF/F0) at synaptic boutons of cultured rat hippocampal neurons expressing VGLUT1-pH or VGLUT2-pH stimulated at 40 Hz for 60 s, normalized to peak fluorescence, exhibit increases and decrease in fluorescence intensity consistent with exocytosis followed by endocytosis. Treatment with 10 μM TNP for 2 h increases the rate of endocytosis of VGLUT2-pH (red) compared to vehicle (green). VGLUT1-pH recycling (blue) is not affected by TNP (white). Middle panel: the extent of fluorescence decay from peak fluorescence [Δ(ΔF/F0)] during stimulation is smaller for VGLUT2 (green) than VGLUT1 (blue) (**p < 0.01). Treatment with TNP has no effect on the Δ(ΔF/F0) of VGLUT1 (white), but significantly increases Δ(ΔF/F0) for VGLUT2 (red, **p < 0.01). Right panel: the rate of post-stimulus endocytosis of VGLUT2-pH in vehicle-treated neurons (green) is significantly slower than VGLUT1-pH. TNP treatment speeds VGLUT2-pH endocytosis to a rate comparable to VGLUT1-pH (**p < 0.01, t-test). (B) TNP treatment has no effect on endocytosis of the AP-2 cargo VGAT-pH. (C) TNP accelerates VGLUT2-pH endocytosis after a more moderate 10 Hz 60 s stimulus (*p < 0.05, t-test). Data are means ± SEM of ΔF/F0 normalized to total fluorescence, n = 5–18 coverslips (cs) from at least two independent cultures with at least 35 synapses analyzed per cs.
FIGURE 2
FIGURE 2
IP6K1 or IP6K3 deletion accelerates VGLUT2-pH endocytosis. (A) Co-localization of endogenous IP6K1 and IP6K3 (green) in DIV14 mouse hippocampal neurons with the axonal neurofilament marker RMO-24, and the dendritic marker MAP2 (red). Arrows indicate IP6K1 and 3 colocalization with RMO-24 (yellow in merge panels). Arrowheads indicate colocalization of IP6K3, but not IP6K1, with MAP2. (B) Time course and quantification (τ) of normalized fluorescence changes (ΔF/F0) of VGLUT-pHs in response to 10Hz 60 s stimulation in WT and IP6K1 KO neurons. (C) Fluorescence changes of VGLUT-pHs in WT and IP6K3 KO neurons. (D) Fluorescence changes in neurons transfected with VGLUT2-pH and infected with lentivirus containing empty vector or shRNA to IP6K1 or IP6K3. Data are means ± SEM from at least 35 synapses from 5 to 8 cs from at least three independent cultures, *p < 0.05, **p < 0.01, ANOVA.
FIGURE 3
FIGURE 3
IP6K inhibition increases VGLUT-pHs in the RRP. (A) The fraction of VGLUT1 and 2-pH that undergoes exocytosis in response to a 100 Hz 20 AP stimulus to release the RRP is larger in the presence of BfA (left) and TNP (right). There is no additive effect of TNP and BfA. BfA increases the amount of VGLUT1- and 2-pH in the RRP to a lesser extent than TNP. Data are means ± SEM of ΔF/F0 normalized to total fluorescence over at least 35 boutons per coverslip from 9 to 12 coverslips per construct and at least three independent cultures for both experiments. (B) IP6K1 KO does not significantly increase VGLUT2-pH in the RRP, while IP6K3 KO decreases VGLUT1- and 2-pH in the RRP. Data are means ± SEM of ΔF/F0 normalized to total fluorescence over at least 40 boutons per coverslip from 6 to 12 coverslips per construct and at least three independent cultures. *p < 0.05, **p < 0.01, ANOVA.
FIGURE 4
FIGURE 4
Effect of IP6K KOs on EPSCs in striatum, which contains both VGLUT1 and 2 synapses. (A) Top: representative mEPSC traces from WT (n = 10) and IP6K1 (n = 12) and IP6K3 (n = 8) KO mice under voltage clamp at –70 mV in the presence of 1 μM TTX. Bottom: averaged amplitudes and frequencies indicate no differences between genotypes. (B) Top: representative traces of spontaneous EPSCs. Bottom: average sEPSC amplitudes are larger in both IP6K1 (n = 9) and IP6K3 (n = 10) KO mice, compared to WT (n = 8). Frequency of sEPSCs is increased in IP6K1 KO and decreased in IP6K3 KO, compared to WT. *p < 0.05, **p < 0.01, ANOVA.
FIGURE 5
FIGURE 5
Short-term facilitation in predominantly VGLUT1 expressing Schaffer collateral synapses. (A) Top: representative traces of EPSC trains evoked at 10, 20, and 40 Hz stimulation recorded at –70 mV in whole cell configuration. Bottom: normalized EPSC amplitudes show activity dependent facilitation of IP6K1 KO compared to WT at 40 Hz (*p < 0.05 and **p < 0.01). Data are means ± SEM from n = 9–11 cells. (B) Left: representative examples of postsynaptic responses induced by pairs of depolarization-evoked action potentials (50 ms apart) in the presynaptic cell. Stimulus artifacts are blanked. Middle: summary plot of paired pulse ratio (PPR) calculated at 25, 50, 100, and 1000 ms ISI in the same cells, showing higher facilitation at shorter ISIs. Deletion of IP6K1 (red) increases paired pulse facilitation, compared to WT (black, *p < 0.05 and **p < 0.01). Treatment with the IP6K inhibitor TNP is similar to IP6K1 KO (n = 8–11, p > 0.05). Right: initial EPSC amplitudes in paired-pulse. (C) Input-output curve demonstrating EPSC amplitudes at different current intensities (n = 4–8). (D) Left: representative traces of AMPA and NMDA receptor mediated EPSCs. Right: quantitation indicates no significant differences in AMPA/NMDA ratio between WT and IP6K KO mice (n = 5–6).
FIGURE 6
FIGURE 6
Response of VGLUT1 expressing hippocampal synapses and VGLUT2 expressing thalamostriatal synapses to prolonged stimulation. (A) CA1: baseline EPSCs evoked at 1 Hz and followed by a 20 Hz 300 pulse train in WT (n = 6) and IP6K1 KO (n = 5). Recovery from short-term depression was measured at 1 Hz for 150 s. Currents were normalized to the average amplitudes of baseline EPSCs. Recovery rate time constant was approximated with a single exponential fit. Percentage recovery was calculated based on the recovered EPSC amplitudes. (B) Thalamostriatal: same as in A for WT (n = 5) and IP6K (n = 6). **p < 0.01, t-test. All data are presented as means ± SEM unless otherwise noted. (C,D) Fluorescence changes representing the amount of VGLUT2-pH, but not VGLUT1-pH, released from the SV recycling pool (RP, purple bar) after release of the RRP (blue bar) is increased in IP6K1 KO mice, compared to control (*p < 0.05). Data are means ± SEM of ΔF/F0 normalized to total fluorescence over at least 30 boutons per coverslip from 6 to 9 coverslips and three independent cultures.
FIGURE 7
FIGURE 7
Response of WT and IP6K1 KO in hippocampal VGLUT1 synapses to high frequency repeated stimulation. (A) Representative traces of CA1 EPSCs evoked by 100 stimuli at 40 Hz in WT (n = 7) and IP6K1 (n = 6) and IP6K3 (n = 5) KO slices. (B) Summary plot of EPSC amplitude, normalized to the first EPSC amplitude, in response to two 40 Hz 100 pulse stimuli with a 7 min recovery between stimulus trains. (C) Cumulative EPSC amplitude during the first 40 Hz stimulus train in WT and IP6K1 KO. EPSC amplitudes are normalized to the first stimulus. The last 20 data points are fitted to a linear regression and extrapolated to time zero to estimate RRP size. Release probability is estimated by dividing the first EPSC amplitude by the RRP size. (D) Cumulative EPSC amplitude as in C for the second 40 Hz stimulus train. **p < 0.01, ANOVA. (E) Cultured hippocampal WT and IP6K1 KO neurons were loaded with FM1-43 using an 80 Hz 10 s stimulus. After washing, the extent of dye release is measured upon unloading from the RRP with a 30 Hz 2 s stimulus, then the remaining recycling pool with three 40 Hz 10 s stimuli. All data are presented as means ± SEM, unless otherwise noted. *p < 0.05, t-test.

Similar articles

Cited by

References

    1. Ariel P., Ryan T. A. (2010). Optical mapping of release properties in synapses. Front. Neural Circuits 4:18. 10.3389/fncir.2010.00018 - DOI - PMC - PubMed
    1. Ashrafi G., Wu Z., Farrell R. J., Ryan T. A. (2017). GLUT4 mobilization supports energetic demands of active synapses. Neuron 93 606–615.e3. 10.1016/j.neuron.2016.12.020 - DOI - PMC - PubMed
    1. Azevedo C., Burton A., Ruiz-Mateos E., Marsh M., Saiardi A. (2009). Inositol pyrophosphate mediated pyrophosphorylation of AP3B1 regulates HIV-1 Gag release. Proc. Natl. Acad. Sci. U.S.A. 106 21161–21166. 10.1073/pnas.0909176106 - DOI - PMC - PubMed
    1. Balaji J., Armbruster M., Ryan T. A. (2008). Calcium control of endocytic capacity at a CNS synapse. J. Neurosci. 28 6742–6749. 10.1523/JNEUROSCI.1082-08.2008 - DOI - PMC - PubMed
    1. Barker C. J., Illies C., Fiume R., Gaboardi G. C., Yu J., Berggren P. O. (2009). Diphosphoinositol pentakisphosphate as a novel mediator of insulin exocytosis. Adv. Enzyme Regul. 49 168–173. 10.1016/j.advenzreg.2009.01.001 - DOI - PubMed