. 2022 Aug 5;8(31):eabm5500.
doi: 10.1126/sciadv.abm5500. Epub 2022 Aug 5.

G9a dictates neuronal vulnerability to inflammatory stress via transcriptional control of ferroptosis

Affiliations

G9a dictates neuronal vulnerability to inflammatory stress via transcriptional control of ferroptosis

Nicola Rothammer et al. Sci Adv. .

Abstract

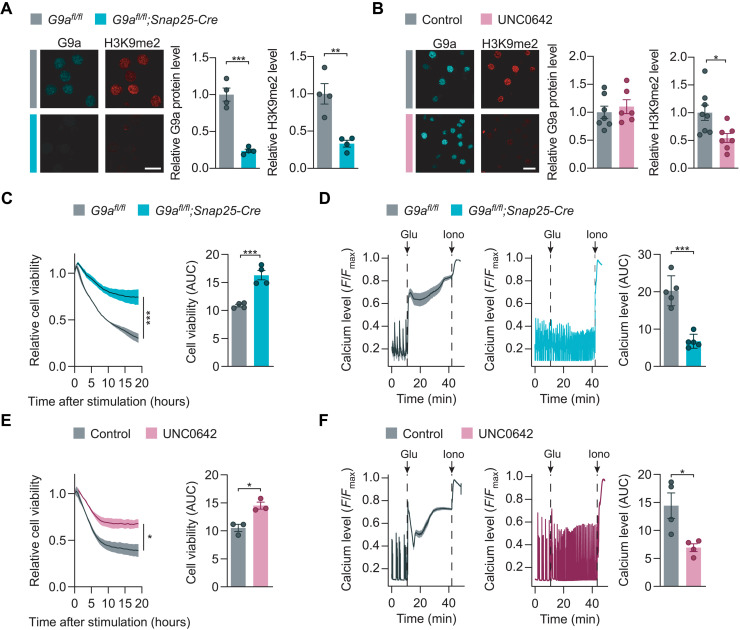
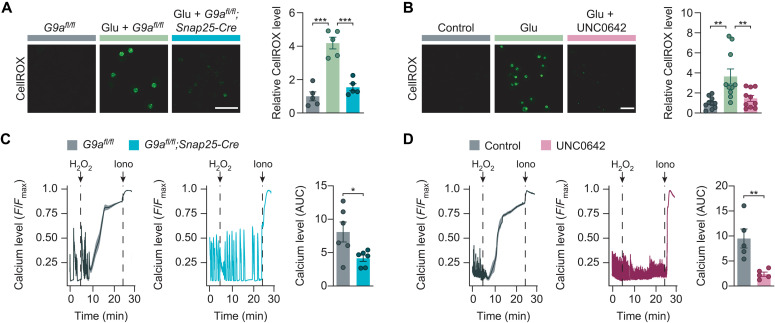
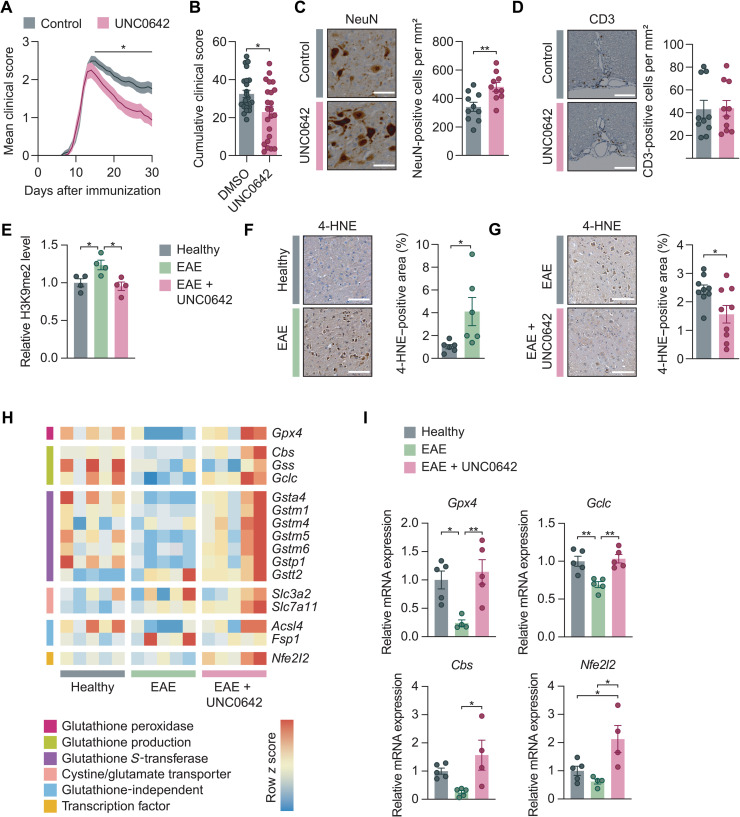
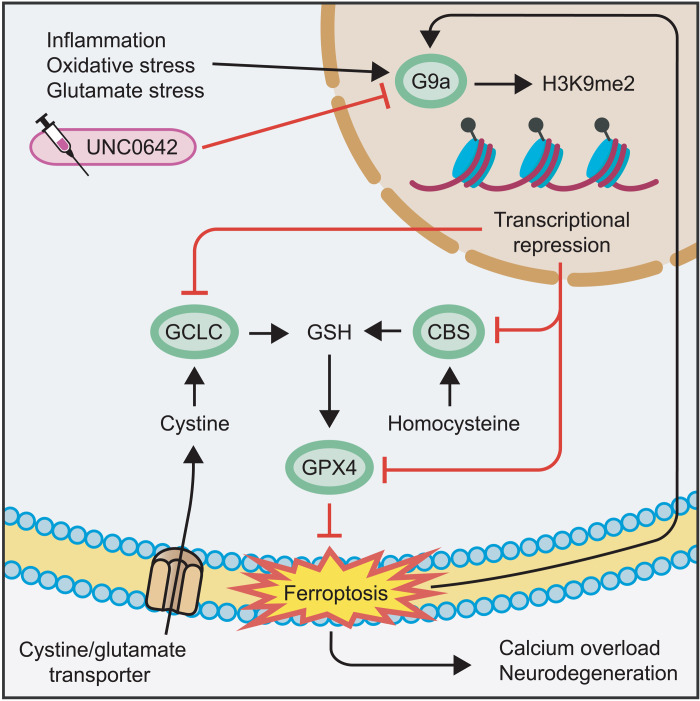
Neuroinflammation leads to neuronal stress responses that contribute to neuronal dysfunction and loss. However, treatments that stabilize neurons and prevent their destruction are still lacking. Here, we identify the histone methyltransferase G9a as a druggable epigenetic regulator of neuronal vulnerability to inflammation. In murine experimental autoimmune encephalomyelitis (EAE) and human multiple sclerosis (MS), we found that the G9a-catalyzed repressive epigenetic mark H3K9me2 was robustly induced by neuroinflammation. G9a activity repressed anti-ferroptotic genes, diminished intracellular glutathione levels, and triggered the iron-dependent programmed cell death pathway ferroptosis. Conversely, pharmacological treatment of EAE mice with a G9a inhibitor restored anti-ferroptotic gene expression, reduced inflammation-induced neuronal loss, and improved clinical outcome. Similarly, neuronal anti-ferroptotic gene expression was reduced in MS brain tissue and was boosted by G9a inhibition in human neuronal cultures. This study identifies G9a as a critical transcriptional enhancer of neuronal ferroptosis and potential therapeutic target to counteract inflammation-induced neurodegeneration.


Figures

Fig. 1.
Fig. 1.. G9a-depedent H3K9me2 is induced by inflammation and excitotoxicity.
(A) Gene expression heatmap of up- and down-regulated epigenetic modifiers in inflamed motor neurons during acute EAE on day 15 (n = 5 per group each pooled from three mice). (B) Normalized RNA sequencing expression of Ehmt2 in healthy and inflamed motor neurons (DESeq2 false discovery rate; n = 5 per group). (C) Flow cytometry of H3K9me2 levels in spinal cord neuronal nuclei from healthy and EAE mice at indicated days after immunization [one-way analysis of variance (ANOVA) with Dunnett’s post hoc test; n = 6 per group]. (D) Relative neuronal loss in spinal cords from healthy and EAE mice at indicated days after immunization (one-way ANOVA with Dunnett’s post hoc test; n = 6 per group). (E) H3K9me2 staining of brain sections from MS NAGM, cortical MS lesions and control individuals with quantification in HuC/D cells (one-way ANOVA with Tukey’s post hoc test; controls: n = 10, MS NAGM: n = 4, MS lesion: n = 5). Scale bar, 80 μm. (F) H3K9me2 staining of primary neurons 8 hours after 20 μM glutamate stimulation with quantification (two-tailed Student’s t test; n = 8 control versus n = 7 Glu). Scale bar, 50 μm. (G) Cell viability time course of primary neurons stimulated with 20 μM glutamate with quantification of area under the curve (AUC) 19 hours after glutamate application (left, two-way ANOVA; right, two-tailed Student’s t test; n = 4 independent experiments). Data are shown as mean values ± SEM. *P < 0.05, **P < 0.01, and ***P < 0.001.
Fig. 2.
Fig. 2.. G9a promotes neuronal damage during glutamate-induced excitotoxicity.
(A and B) G9a and H3K9me2 stainings of G9afl/fl;Snap25-Cre [(A); two-tailed Student’s t test, n = 4 independent experiments] and UNC0642 pretreated primary neurons compared to respective controls with quantification [(B); two-tailed Student’s t test, G9a: dimethyl sulfoxide (DMSO) n = 7, UNC0642 n = 6, H3K9me2: DMSO n = 8, UNC0642 n = 7]. Scale bars, 20 μm. (C) Cell viability of G9afl/fl versus G9afl/fl;Snap25-Cre primary neurons with time course (left; two-way ANOVA; n = 4 independent experiments) and quantification of AUC (right; two-tailed Student’s t test, n = 4 independent experiments). (D) Cytosolic calcium levels of glutamate-exposed G9afl/fl and G9afl/fl;Snap25-Cre primary neurons with quantification of AUC (two-tailed Student’s t test, n = 5 independent experiments). (E) Cell viability of DMSO- versus UNC0642-treated primary neurons with time course (left; two-way ANOVA; n = 3 independent experiments) and quantification of AUC (right; two-tailed Student’s t test, n = 3 independent experiments). (F) Cytosolic calcium levels of glutamate-exposed primary neurons treated with DMSO or UNC0642 with quantification of AUC (two-tailed Student’s t test, n = 4 independent experiments). Data are shown as mean values ± SEM. *P < 0.05, **P < 0.01, and ***P < 0.001.
Fig. 3.
Fig. 3.. G9a potentiates oxidative stress in neurons.
(A) Oxidative stress levels (CellROX green reagent) in G9afl/fl versus G9afl/fl;Snap25-Cre primary neurons with quantification (one-way ANOVA with Tukey’s post hoc test; n = 5 independent experiments). Scale bar, 40 μm. (B) Oxidative stress levels (CellROX green reagent) in DMSO- versus UNC0642-treated primary neurons with quantification (one-way ANOVA with Tukey’s post hoc test; n = 10 independent experiments). Scale bar, 40 μm. (C) Cytosolic calcium levels of H2O2-exposed G9afl/fl and G9afl/fl;Snap25-Cre primary neurons with quantification of AUC (two-tailed Student’s t test, n = 6 independent experiments). (D) Cytosolic calcium levels of H2O2-exposed primary neurons treated with DMSO or UNC0642 with quantification of AUC (two-tailed Student’s t test, n = 5 independent experiments). Data are shown as mean values ± SEM. *P < 0.05, **P < 0.01, and ***P < 0.001.
Fig. 4.
Fig. 4.. G9a induces neuronal cell death via ferroptosis.
(A and B) Quantification of dead primary neurons with CellTox green reagent in response to induction of different cell death pathways in G9afl/fl versus G9afl/fl;Snap25-Cre cultures [(A); two-tailed paired Student’s t test, n = 5 independent experiments] and cultures ± UNC0642 [(B); two-tailed paired Student’s t test, n = 6 independent experiments]. (C) H3K9me2 immunostaining of primary neurons after treatment with indicated compounds (repeated-measures one-way ANOVA with Dunnett’s post hoc test; n = 8 independent experiments). (D) COX-2 immunostaining after glutamate stimulation of primary neurons ± UNC0642 with quantification (one-way ANOVA with Tukey’s post hoc test: n = 7 independent experiments). Scale bar, 40 μm. (E) Cytosolic calcium levels after glutamate treatment ± UNC0642 with quantification. Primary neurons were stimulated 10 min before glutamate treatment with ferrostatin-1 (two-way ANOVA with Bonferroni’s post hoc test, n = 6 per group). (F and G) Glutathione (GSH) levels in G9afl/fl versus G9afl/fl;Snap25-Cre [(F); two-tailed Student’s t test, n = 3 independent experiments] or UNC0642-treated primary neurons [(G); two-tailed Student’s t test, n = 4 independent experiments] in response to glutamate. Data are normalized to untreated controls. Data are shown as mean values ± SEM. *P < 0.05, **P < 0.01, and ***P < 0.001. STS, staurosporine; TSZ, TNF-α + LCL-161 + Z-VAD-FMK.
Fig. 5.
Fig. 5.. G9a amplifies neurodegeneration and represses anti-ferroptotic genes in CNS inflammation.
(A) Disease course of EAE mice treated with DMSO or UNC0642 (5 mg kg−1 body weight). Data are pooled from two independent experiments. DMSO, n = 24; UNC0642, n = 23. (B) Cumulative EAE score from days 15 to 30 (two-tailed Mann-Whitney U test; DMSO, n = 24; UNC0642, n = 23). (C and D) Loss of NeuN+ neurons [(C); two-tailed Mann-Whitney U test; n = 10 per group] and infiltration of CD3+ T cells [(D); two-tailed Mann-Whitney U test; n = 10 per group] in the spinal cord of EAE mice ± UNC0642 at day 30. Scale bars, 100 μm. (E) Flow cytometry of H3K9me2 levels of spinal cord neuronal nuclei from healthy, EAE, and UNC0642-treated EAE mice (one-way ANOVA with Tukey’s post hoc test; n = 4 mice each group). (F and G) 4-HNE immunostaining of cervical spinal cords from healthy versus acute EAE (day 15) [(F); two-tailed Mann-Whitney U test; n = 6 animals per group] and from chronic EAE (day 30) after treatment with vehicle or UNC0642 (5 mg kg−1 body weight) [(G); two-tailed Mann-Whitney U test; n = 12 animals per group]. Scale bars, 100 μm. (H and I) Gene expression data from sorted spinal cord neuronal nuclei of healthy, EAE, and UNC0642-treated EAE mice. n = 5 mice per group (one-way ANOVA with Tukey’s post hoc test; n = 4 to 5 per group). Data are shown as mean values ± SEM. *P < 0.05 and **P < 0.01.
Fig. 6.
Fig. 6.. Anti-ferroptotic GPX4 is suppressed in MS and induced by G9a inhibition.
(A) RNAscope fluorescence in situ hybridization of GPX4 transcripts in brain sections of control individuals and MS NAGM and cortical MS lesions (one-way ANOVA with Dunnett’s post hoc test; control, n = 99,202 neurons; MS NAGM, n = 229,718 neurons; MS lesion, n = 131,294 neurons). Scale bar, 100 μm. (B) H3K9me2 immunostaining in response to ferroptosis induction with erastin in hiPSC-neurons with quantification (repeated-measures one-way ANOVA with Tukey’s post hoc test; n = 3 independent experiments). Scale bar, 40 μm. (C) mRNA expression levels of indicated genes from hiPSC-neurons treated with erastin ± UNC0642 versus control (one-way ANOVA with Tukey’s post hoc test; n = 3 to 4 per group). Data are shown as mean values ± SEM. *P < 0.05, **P < 0.01, and ***P < 0.001.
Fig. 7.
Fig. 7.. G9a propagates neurodegeneration by enhancing ferroptosis.
CNS inflammation enhances oxidative stress and increases extracellular glutamate levels, together inducing G9a activity in neurons. G9a catalyzes the repressive mark H3K9me2 that suppresses the expression of Gclc, Cbs, and Gpx4. Thereby, G9a limits the availability of GSH, induces lipid peroxidation, and finally leads to ferroptosis, calcium overload, and neuronal loss. Moreover, ferroptosis itself enhances G9a activity in a self-reinforcing feedback loop. Pharmacological inhibition of G9a by UNC0642 counteracts these effects and results in neuroprotection.

Similar articles

Cited by

References

    1. Prinz M., Masuda T., Wheeler M. A., Quintana F. J., Microglia and central nervous system-associated macrophages—From origin to disease modulation. Annu. Rev. Immunol. 39, 251–277 (2021). - PMC - PubMed
    1. Friese M. A., Schattling B., Fugger L., Mechanisms of neurodegeneration and axonal dysfunction in multiple sclerosis. Nat. Rev. Neurol. 10, 225–238 (2014). - PubMed
    1. Dendrou C. A., Fugger L., Friese M. A., Immunopathology of multiple sclerosis. Nat. Rev. Immunol. 15, 545–558 (2015). - PubMed
    1. Luchetti S., Fransen N. L., van Eden C. G., Ramaglia V., Mason M., Huitinga I., Progressive multiple sclerosis patients show substantial lesion activity that correlates with clinical disease severity and sex: A retrospective autopsy cohort analysis. Acta Neuropathol. 135, 511–528 (2018). - PMC - PubMed
    1. Ransohoff R. M., How neuroinflammation contributes to neurodegeneration. Science 353, 777–783 (2016). - PubMed

Substances