Pyroptotic Patterns in Blood Leukocytes Predict Disease Severity and Outcome in COVID-19 Patients
- PMID: 35928821
- PMCID: PMC9343985
- DOI: 10.3389/fimmu.2022.888661
Pyroptotic Patterns in Blood Leukocytes Predict Disease Severity and Outcome in COVID-19 Patients
Abstract
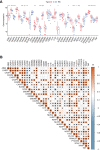
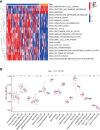
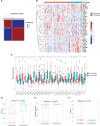
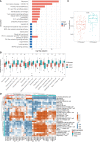
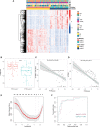
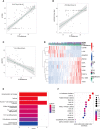
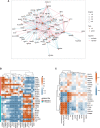
The global coronavirus disease 2019 (COVID-19) pandemic has lasted for over 2 years now and has already caused millions of deaths. In COVID-19, leukocyte pyroptosis has been previously associated with both beneficial and detrimental effects, so its role in the development of this disease remains controversial. Using transcriptomic data (GSE157103) of blood leukocytes from 126 acute respiratory distress syndrome patients (ARDS) with or without COVID-19, we found that COVID-19 patients present with enhanced leukocyte pyroptosis. Based on unsupervised clustering, we divided 100 COVID-19 patients into two clusters (PYRcluster1 and PYRcluster2) according to the expression of 35 pyroptosis-related genes. The results revealed distinct pyroptotic patterns associated with different leukocytes in these PYRclusters. PYRcluster1 patients were in a hyperinflammatory state and had a worse prognosis than PYRcluster2 patients. The hyperinflammation of PYRcluster1 was validated by the results of gene set enrichment analysis (GSEA) of proteomic data (MSV000085703). These differences in pyroptosis between the two PYRclusters were confirmed by the PYRscore. To improve the clinical treatment of COVID-19 patients, we used least absolute shrinkage and selection operator (LASSO) regression to construct a prognostic model based on differentially expressed genes between PYRclusters (PYRsafescore), which can be applied as an effective prognosis tool. Lastly, we explored the upstream transcription factors of different pyroptotic patterns, thereby identifying 112 compounds with potential therapeutic value in public databases.
Keywords: COVID-19; leukocytes; prognosis model; pyroptosis; transcription factors.
Copyright © 2022 Tang, Zhang, Liu, Cao and Xu.
Conflict of interest statement
The authors declare that the research was conducted in the absence of any commercial or financial relationships that could be construed as a potential conflict of interest.
Figures

Similar articles
-
Identification of a pyroptosis-related prognostic signature in breast cancer.BMC Cancer. 2022 Apr 20;22(1):429. doi: 10.1186/s12885-022-09526-z. BMC Cancer. 2022. PMID: 35443644 Free PMC article.
-
Single-Cell Transcriptomic Profiling of MAIT Cells in Patients With COVID-19.Front Immunol. 2021 Jul 30;12:700152. doi: 10.3389/fimmu.2021.700152. eCollection 2021. Front Immunol. 2021. PMID: 34394094 Free PMC article.
-
Pyroptosis-Related Gene Signature Predicts Prognosis and Indicates Immune Microenvironment Infiltration in Glioma.Front Cell Dev Biol. 2022 Apr 25;10:862493. doi: 10.3389/fcell.2022.862493. eCollection 2022. Front Cell Dev Biol. 2022. PMID: 35547808 Free PMC article.
-
A pyroptosis-related gene signature predicts prognosis and immune microenvironment in hepatocellular carcinoma.World J Surg Oncol. 2022 Jun 3;20(1):179. doi: 10.1186/s12957-022-02617-y. World J Surg Oncol. 2022. PMID: 35659304 Free PMC article.
-
Analysis of Pyroptosis-Related Immune Signatures and Identification of Pyroptosis-Related LncRNA Prognostic Signature in Clear Cell Renal Cell Carcinoma.Front Genet. 2022 Jun 29;13:905051. doi: 10.3389/fgene.2022.905051. eCollection 2022. Front Genet. 2022. PMID: 35846134 Free PMC article.
Cited by
-
Knockdown of USF2 inhibits pyroptosis of podocytes and attenuates kidney injury in lupus nephritis.J Mol Histol. 2023 Aug;54(4):313-327. doi: 10.1007/s10735-023-10135-8. Epub 2023 Jun 21. J Mol Histol. 2023. PMID: 37341818
-
Cellular and Molecular Mechanisms of Pathogenic and Protective Immune Responses to SARS-CoV-2 and Implications of COVID-19 Vaccines.Vaccines (Basel). 2023 Mar 8;11(3):615. doi: 10.3390/vaccines11030615. Vaccines (Basel). 2023. PMID: 36992199 Free PMC article. Review.
References
-
- WHO . Covid-19 Dashboard. (2020) Geneva: World Health Organization, 2020. Available online: https://covid19.who.int/ (last cited: [20 May, 2022]).
Publication types
MeSH terms
LinkOut - more resources
Full Text Sources
Medical

