. 2022 Jul 23;4(4):fcac192.
doi: 10.1093/braincomms/fcac192. eCollection 2022.

Cysteine string protein alpha accumulates with early pre-synaptic dysfunction in Alzheimer's disease

Affiliations

Cysteine string protein alpha accumulates with early pre-synaptic dysfunction in Alzheimer's disease

Huzefa Rupawala et al. Brain Commun. .

Abstract

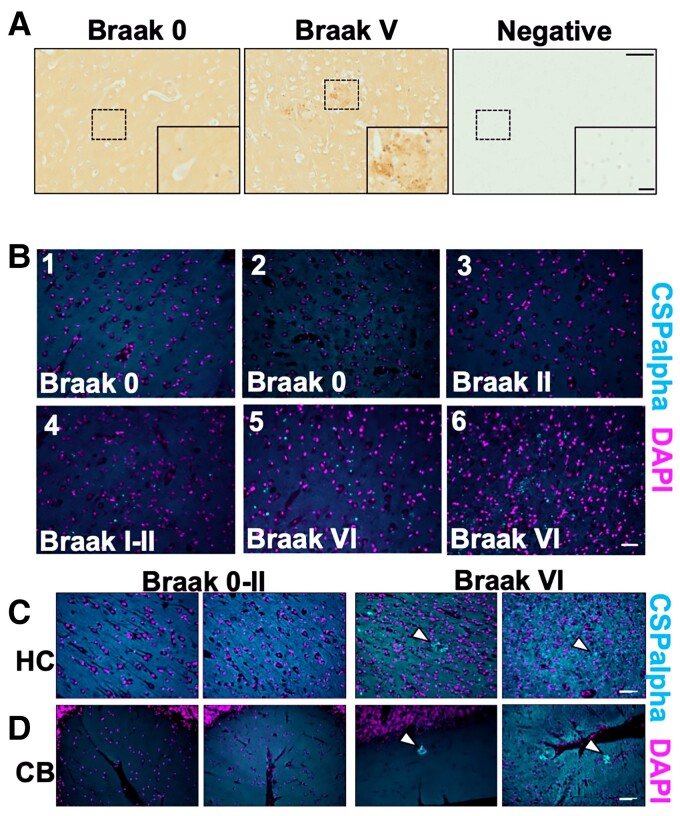
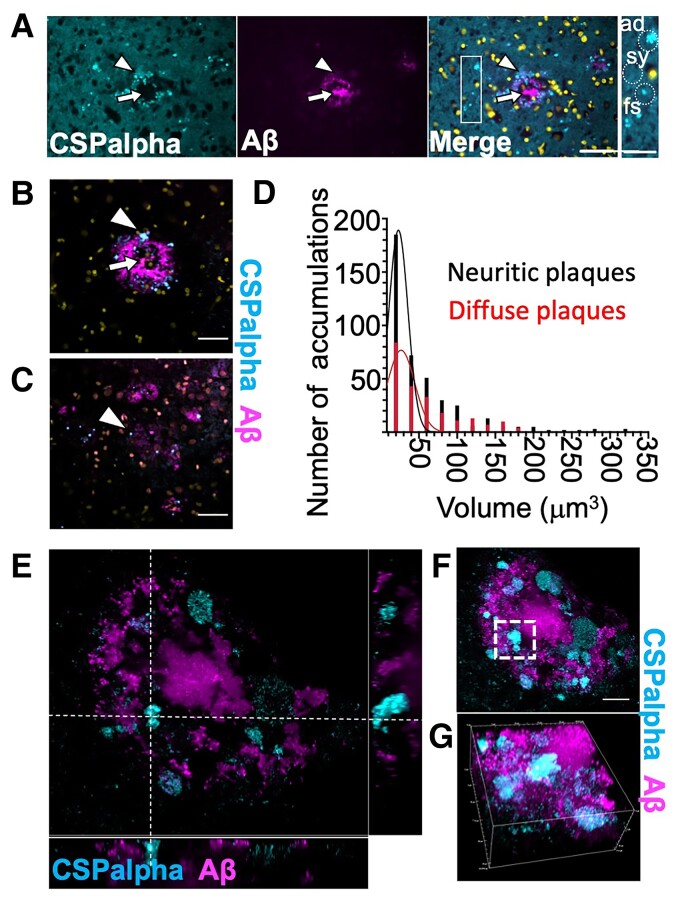
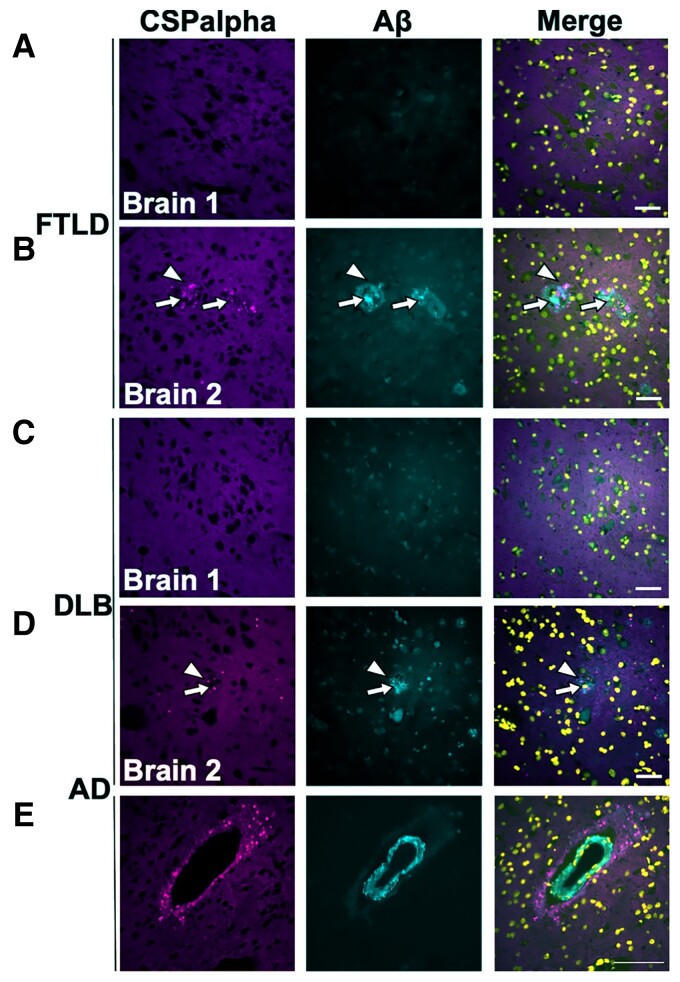
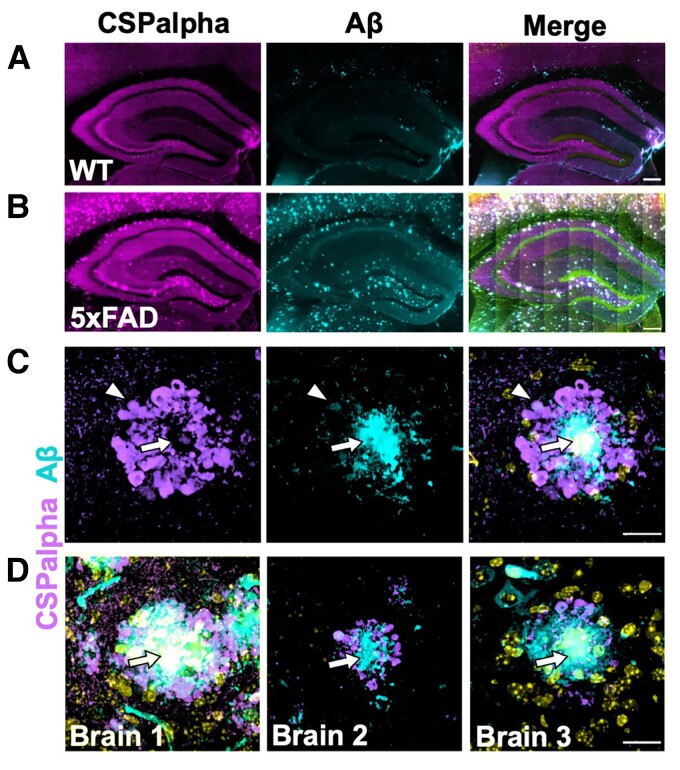
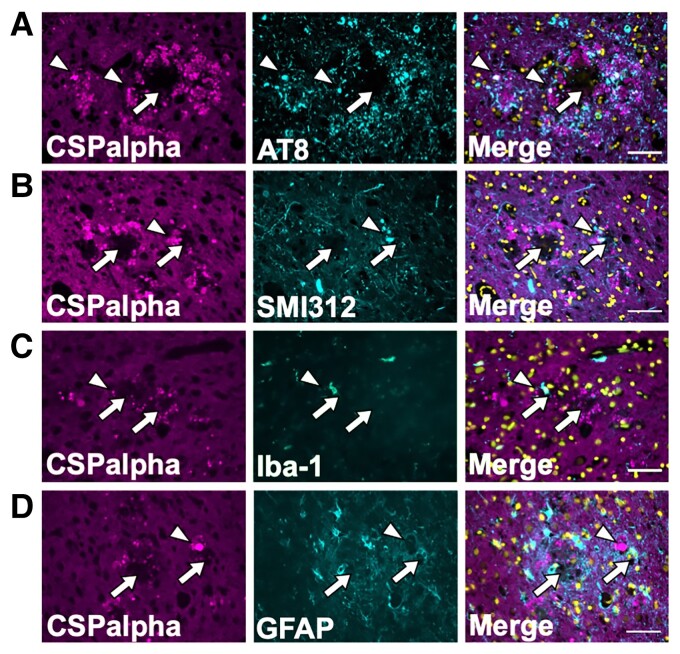
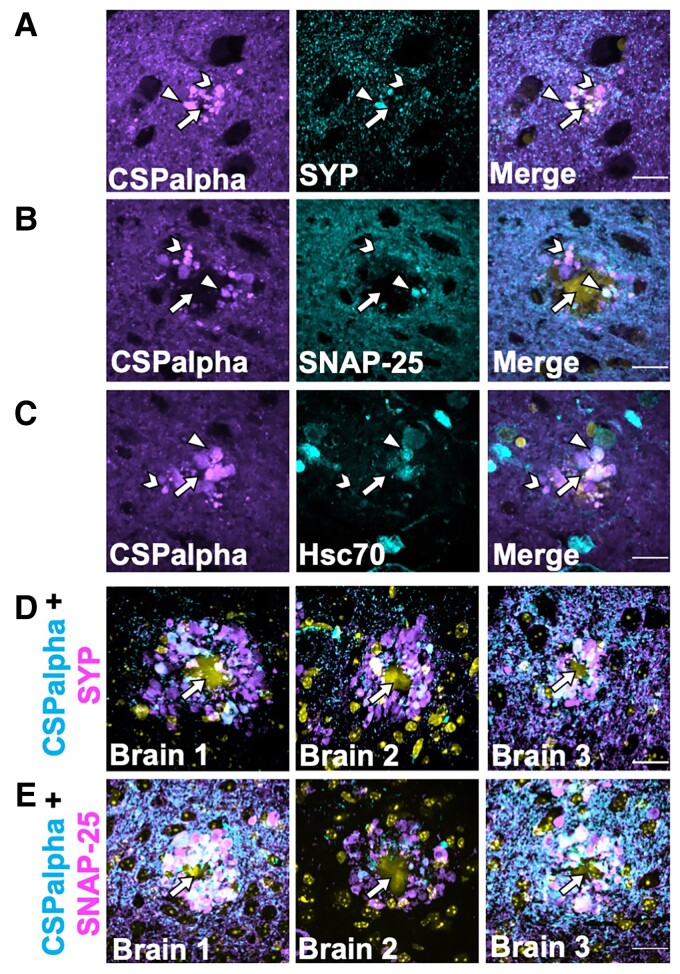
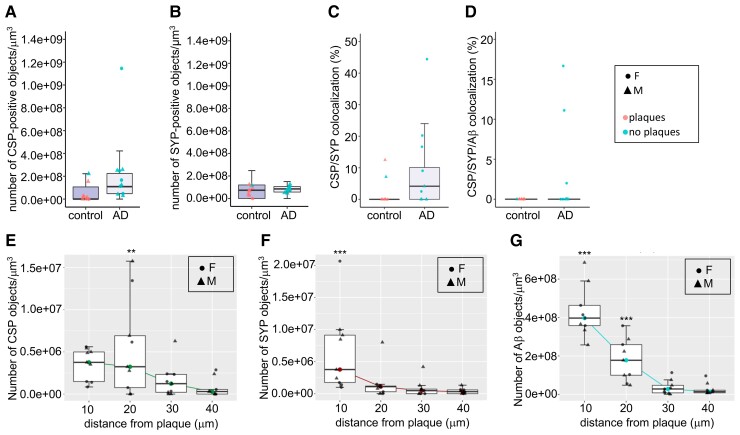
In Alzheimer's disease, synapse loss causes memory and cognitive impairment. However, the mechanisms underlying synaptic degeneration in Alzheimer's disease are not well understood. In the hippocampus, alterations in the level of cysteine string protein alpha, a molecular co-chaperone at the pre-synaptic terminal, occur prior to reductions in synaptophysin, suggesting that it is a very sensitive marker of synapse degeneration in Alzheimer's. Here, we identify putative extracellular accumulations of cysteine string alpha protein, which are proximal to beta-amyloid deposits in post-mortem human Alzheimer's brain and in the brain of a transgenic mouse model of Alzheimer's disease. Cysteine string protein alpha, at least some of which is phosphorylated at serine 10, accumulates near the core of beta-amyloid deposits and does not co-localize with hyperphosphorylated tau, dystrophic neurites or glial cells. Using super-resolution microscopy and array tomography, cysteine string protein alpha was found to accumulate to a greater extent than other pre-synaptic proteins and at a comparatively great distance from the plaque core. This indicates that cysteine string protein alpha is most sensitive to being released from pre-synapses at low concentrations of beta-amyloid oligomers. Cysteine string protein alpha accumulations were also evident in other neurodegenerative diseases, including some fronto-temporal lobar dementias and Lewy body diseases, but only in the presence of amyloid plaques. Our findings are consistent with suggestions that pre-synapses are affected early in Alzheimer's disease, and they demonstrate that cysteine string protein alpha is a more sensitive marker for early pre-synaptic dysfunction than traditional synaptic markers. We suggest that cysteine string protein alpha should be used as a pathological marker for early synaptic disruption caused by beta-amyloid.

Keywords: Alzheimer’s disease; amyloid plaque; cysteine string protein alpha; dystrophy; pre-synapse.


Figures

Graphical abstract
Graphical abstract
Figure 1
Figure 1
Focal spots and amorphous CSPalpha-positive deposits identified in Alzheimer’s disease brain. Representative images from fixed post-mortem human BA9 sections from age-matched (A) Braak 0–II (n = 6) and severe Alzheimer’s disease (Braak V–VI) (n = 5) cases probed with an anti-CSPalpha antibody. The higher magnification represents the area indicated by the dashed box. The detection of CSPalpha expression (brown) in Alzheimer’s disease brain occurred in dense focal spots and larger amorphous deposits. Nuclei were counterstained with haematoxylin (blue). A negative control where no primary antibody was used confirmed the specificity of labelling. Scale bars are 100 μm (low magnification image) and 20 μm (high magnification inset). (B) Representative epi-fluorescent images of 7 μm thick post-mortem human BA9 brain sections from Braak stages 0–VI immunolabelled using an antibody against CSPalpha (cyan) with nuclei stained with DAPI (magenta). (n = 5 cases per group.) Scale bar 50 μm. CSPalpha accumulations were apparent within the grey matter. (C) Representative images of post-mortem human hippocampus (HC) and (D) cerebellum (CB) from two Alzheimer’s disease (Braak Stage VI) and two control (Braak Stages 0–II) brain sections immunolabelled using an antibody against CSPalpha (cyan). Dotted lines in (C) indicate focal spots and amorphous deposits of CSPalpha. DAPI was used to stain nuclei (magenta). The white arrow heads indicate CSPalpha accumulations. Scale bar 50 μm. (n = 3).
Figure 2
Figure 2
CSPalpha-positive accumulations in Alzheimer’s disease brain. (A) Representative maximum intensity projection images of sections from a Braak VI post-mortem human Alzheimer’s disease brain (BA9), co-labelled with antibodies against CSPalpha (cyan) and Aβ (6E10) (magenta). Merge of images shown together with DAPI staining (yellow). The arrow heads indicate amorphous deposits of CSPalpha, and the complete arrows indicate the plaque core. Scale bar 50 μm. (n = 3 Braak VI brains.) The inset shows relative scales of synaptic CSPalpha (sy), several small focal spots (fs), one larger fs and one amorphous deposit (ad), examples indicated by dotted circles. Scale bar 25 μm. Representative spinning disc confocal images (projection of a stack of 10 optical sections) show amorphous CSPalpha deposits (cyan, arrowhead) in Braak VI post-mortem human Alzheimer’s disease brain (BA9) associated with (B) Aβ-positive neuritic and (C) diffuse plaques (magenta). Nuclei are stained with DAPI (yellow). Synaptic neuropil staining (background) was subtracted from measurements. Scale bar 25 μm. The complete arrows indicate the plaque core. (D) Histogram showing quantification of the number of CSPalpha accumulations and their volumetric measurements for both neuritic cored (n = 101) and diffuse plaques (n = 54). (n = 5 brains). (E) Representative super-resolution 25 × 26 μm iSIM image section showing orthogonal views of amorphous CSPalpha deposits and focal spots in association with a large neuritic cored Aβ plaque. The white segmented line intersects an amorphous CSPalpha deposit. (F) Maximum intensity projection of 58 optical sections of the same orthogonal field of view. The white segmented box shows the same CSPalpha amorphous deposit. Scale bar 10 μm. (G) Volumetric 3D maximum intensity projection of an isolated CSPalpha deposit. Magnification 100×. Volume of box: 25 μm × 26 μm × 11 μm.
Figure 3
Figure 3
CSPalpha accumulations in association with Aβ deposits. Representative immunofluorescence images of post-mortem temporal cortex brain sections from cases with (A) FTLD without Aβ plaques, (B) FTLD with Aβ plaques, (C) DLB without Aβ plaques and (D) DLB with Aβ plaques. Sections were immunolabelled with antibodies against CSPalpha (magenta), Aβ (6E10) (cyan) and DAPI (yellow) (n = 5 per group). The arrow heads indicate amorphous CSPalpha deposits in (B) and focal spots in (D). The complete arrows indicate the plaque core. Scale bar 50 μm. (E) Representative temporal cortex section from Braak stage VI post-mortem Alzheimer’s disease brain, showing CSPalpha focal spots in proximity to an artery with a vessel wall disrupted by Aβ deposits and dysphoric angiopathy. Brain sections were co-labelled with antibodies against CSPalpha (magenta) and Aβ (6E10) (cyan). DAPI (yellow) was used to stain nuclei. Scale bar 100 μm.
Figure 4
Figure 4
Aβ plaque-associated CSPalpha accumulation in 5xFAD transgenic mice. Representative low magnification images of the hippocampus from a minimum of three consecutive sections from female (A) wild-type (WT) mouse (n = 4) and (B) 5xFAD transgenic mouse (n = 3) brains (∼6 months old) co-labelled with CSPalpha (magenta) and Aβ (cyan) antibodies. DAPI (yellow) was used to stain nuclei. Scale bar 200 μm. (C) Representative higher magnification image of CSPalpha immunoreactivity in proximity to Aβ plaques in 5xFAD brain. The arrow heads indicate amorphous CSPalpha deposits, and the complete arrows indicate the plaque core. Scale bar 20 μm. (D) Representative higher magnification images of hippocampal sections taken from three female 5xFAD mice (∼6-month-old). The merged images show CSPalpha immunoreactivity (magenta) in proximity to individual 6E10-positive Aβ plaques (cyan). DAPI stain (yellow) was used for nuclei. Scale bar 20 μm.
Figure 5
Figure 5
Amorphous CSPalpha deposits do not co-localize with plaque-associated tau, glia or axonal dystrophies. Representative maximum intensity projection images of sections from a Braak VI post-mortem human Alzheimer’s disease brain (BA9), with two consecutive sections co-labelled with antibodies against CSPalpha (magenta) and (A) AT8 (tau phosphorylated at Serine202/Threonine205) (cyan), (B) SMI312 (neurofilament/dystrophic neurites) (cyan), (C) Iba-1 (microglia) (cyan) and (D) GFAP (activated astrocytes) (cyan). Merged images shown together with DAPI staining (yellow). CSPalpha immunoreactivity is localized in proximity to Aβ deposits and overlaps with some but not all dystrophic neurites, AT8-positive tau and glial cells (e.g. white arrowheads). The complete arrows indicate the plaque core. Scale bar 50 μm. (n = 3 Braak VI brains).
Figure 6
Figure 6
Few CSPalpha accumulations co-localize with pre-synaptic terminal structures in proximity to amyloid plaques. Representative images of sections from BA9 of Braak Stage VI human Alzheimer’s disease brains co-labelled with antibodies against (A) CSPalpha (magenta) and synaptophysin (cyan), (B) SNAP-25 (cyan), or (C) Hsc-70 (cyan). DAPI (yellow) was used to stain nuclei. CSPalpha immunoreactivity overlaps with some synaptophysin-positive pre-synaptic structures, likely dystrophic terminals, as well as SNAP-25, and Hsc-70. The arrow heads indicate co-localizing CSPalpha accumulations, the chevrons indicate isolated CSPalpha accumulation and the complete arrows indicate the plaque core. Scale bar 20 μm. (n = 3 Braak VI brains, minimum of three sections per labelling), (D) Representative images of hippocampal sections taken from three 5xFAD mice (∼6-month-old). The images show some but not all CSPalpha accumulations (magenta) co-labelling with pre-synaptic markers synaptophysin (SYP) (cyan) and (E) SNAP-25 (cyan) in 5xFAD mice. DAPI staining (yellow) was used to identify nuclei. Yellow autofluorescence also detected the Aβ plaque core. The complete arrows indicate the plaque core. Scale bar 20 μm.
Figure 7
Figure 7
CSPalpha and synaptophysin-positive pre-synaptic dystrophies at senile and diffuse plaques. Representative array tomography images of human BA9 (A) control (n = 8) and (B) Braak Stage VI Alzheimer’s disease sections (n = 10) co-labelled with antibodies against CSPalpha (green), synaptophysin (red) and Aβ (cyan). Nuclei are stained with DAPI (blue). The arrow heads indicate CSPalpha accumulations and the complete arrows indicate the plaque core. Scale bar 10 μm. (C) Representative image of neuritic cored and (D) diffuse Aβ plaque labelled with antibodies against CSPalpha, synaptophysin and Aβ. Nuclei are stained with DAPI. Scale bar 20 μm. The complete arrow indicates the plaque core. (E and H) Representative 3D reconstructions using Image J volume viewer of a singular amorphous CSPalpha (CSP) deposit alone, Aβ alone and CSPalpha with Aβ (complete black arrows), (F and I) synaptophysin (SYP)-positive pre-synaptic dystrophy alone, Aβ alone and SYP with Aβ (chevron arrow heads) and (G and J) co-localization between CSPalpha, SYP-positive pre-synaptic dystrophy and Aβ (triangular arrow heads). (EG) 3D volume images consist of 14 and (HJ) 15 stacks, respectively. Scale bar 1 μm.
Figure 8
Figure 8
CSPalpha accumulates more distal to the plaque core than synaptophysin pre-synaptic dystrophies. Quantification of immunolabelled control (n = 8) and Alzheimer’s disease Braak VI (n = 10) BA9 brain sections, using array tomography analysis. (A) Alzheimer’s disease-specific differences were detected in the density of CSPalpha deposits (the number of CSP-positive objects/mm3) but not in the density of (B) pre-synaptic dystrophies [the number of synaptophysin (SYP)-positive objects/mm3]. (C) Analysis of the percentage of CSPalpha deposits that co-localized with SYP-positive pre-synaptic dystrophies (data were transformed using the Box–Cox method) and (D) the percentage of CSPalpha deposits co-localizing with both Aβ and SYP. Data shown are median data points per case, with boxplots showing the median for every data point and with error bars showing inter-quartile ranges. All data underwent Shapiro–Wilk’s normality testing and were analysed using a parametric linear mixed-effects model. Symbol representations: circle, female (F); triangle, male (M). Colour representations: orange, no Aβ plaques present; blue, Aβ plaques present. (E) Array tomography images were analysed to yield the density of synaptic accumulations at distances of 0–10 (10), 10–20 (20), 20–30 (30) and 30–40 (40) μm from the Aβ plaque core. Quantification of median CSPalpha deposit density in Braak VI brains reveals a statistically significant gain of abnormal structures approaching Aβ plaques <10 μm and at a 10–20 μm distance from the plaque core (F) and a statistically significant amount of synaptophysin-positive pre-synaptic dystrophies were localized <10 μm distance from the plaque core. (G) There was a gradual decline in Aβ levels with most statistically significant densities <10 and 10–20 μm from the plaque centre. This effect was also statistically significant for age and post-mortem delay (PMD). Data shown are median data points per case, with boxplots showing median for every data point and with error bars showing inter-quartile ranges. All data underwent Shapiro–Wilk’s normality testing, transformed using a Tukey transformation and analysed using a parametric linear mixed-effects model with t-tests using Satterthwaite’s method. Symbol representations: circle, female (F); triangle, male (M). **P < 0.001, ***P < 0.0001.

Similar articles

Cited by

References

    1. Kent SA, Spires-Jones TL, Durrant CS. The physiological roles of tau and Aβ: Implications for Alzheimer’s disease pathology and therapeutics. Acta Neuropathol. 2020;140(4):417–447. - PMC - PubMed
    1. DeKosky ST, Scheff SW. Synapse loss in frontal cortex biopsies in Alzheimer’s disease: Correlation with cognitive severity. Ann Neurol. 1990;27(5):457–464. - PubMed
    1. Terry RD, Masliah E, Salmon DP, et al. . Physical basis of cognitive alterations in Alzheimer’s disease: Synapse loss is the major correlate of cognitive impairment. Ann Neurol. 1991;30(4):572–580. - PubMed
    1. Masliah E, Mallory M, Alford M, et al. . Altered expression of synaptic proteins occurs early during progression of Alzheimer’s disease. Neurology. 2001;56(1):127–129. - PubMed
    1. Selkoe DJ. Alzheimer’s disease is a synaptic failure. Science. 2002;298(5594):789–791. - PubMed

LinkOut - more resources