. 2022 Aug 5;8(31):eabj8002.
doi: 10.1126/sciadv.abj8002. Epub 2022 Aug 3.

Phenotypic heterogeneity driven by plasticity of the intermediate EMT state governs disease progression and metastasis in breast cancer

Affiliations

Phenotypic heterogeneity driven by plasticity of the intermediate EMT state governs disease progression and metastasis in breast cancer

Meredith S Brown et al. Sci Adv. .

Abstract

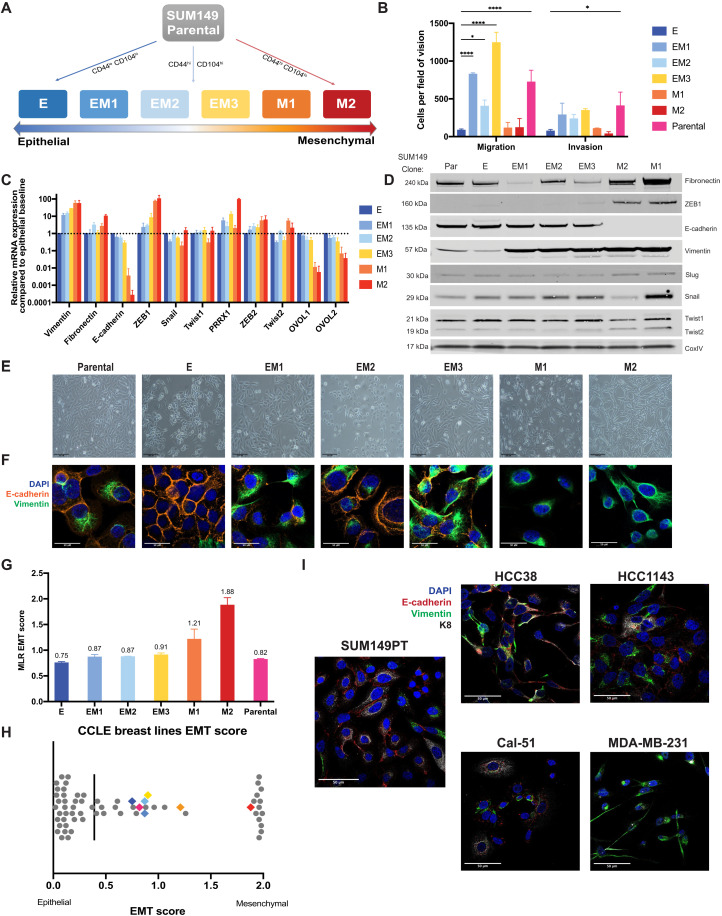
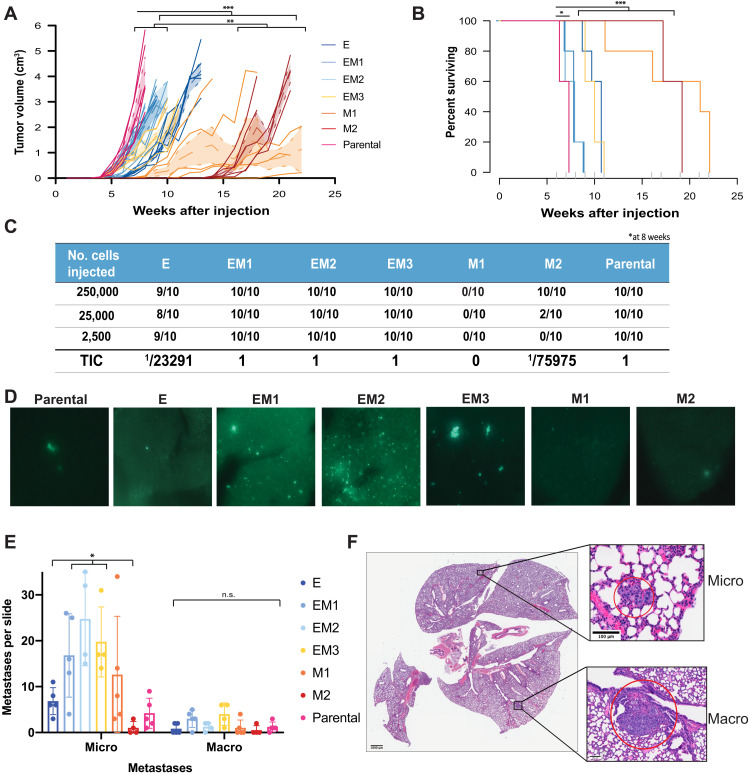
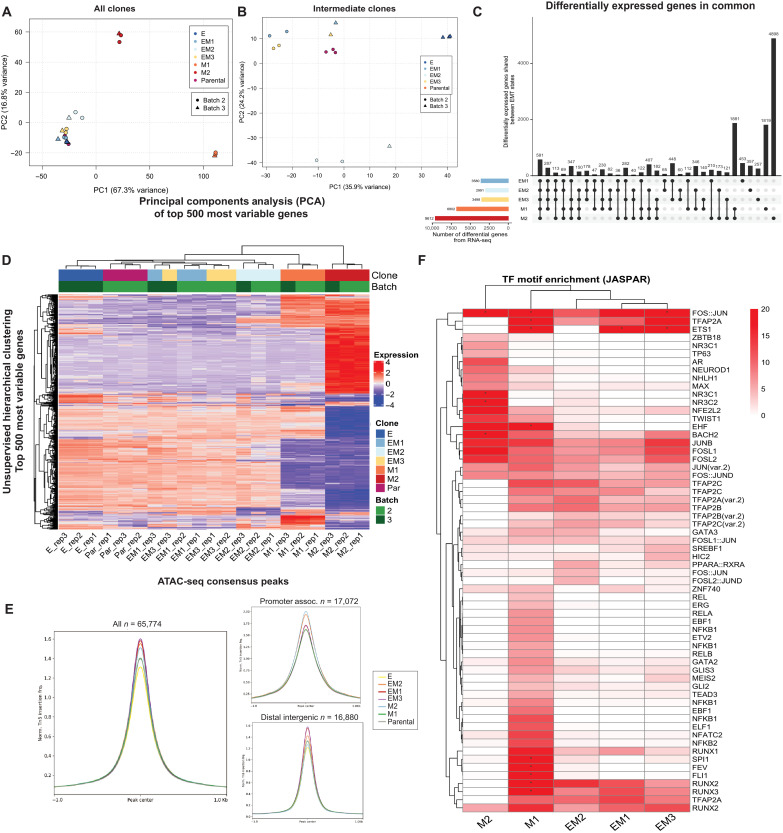
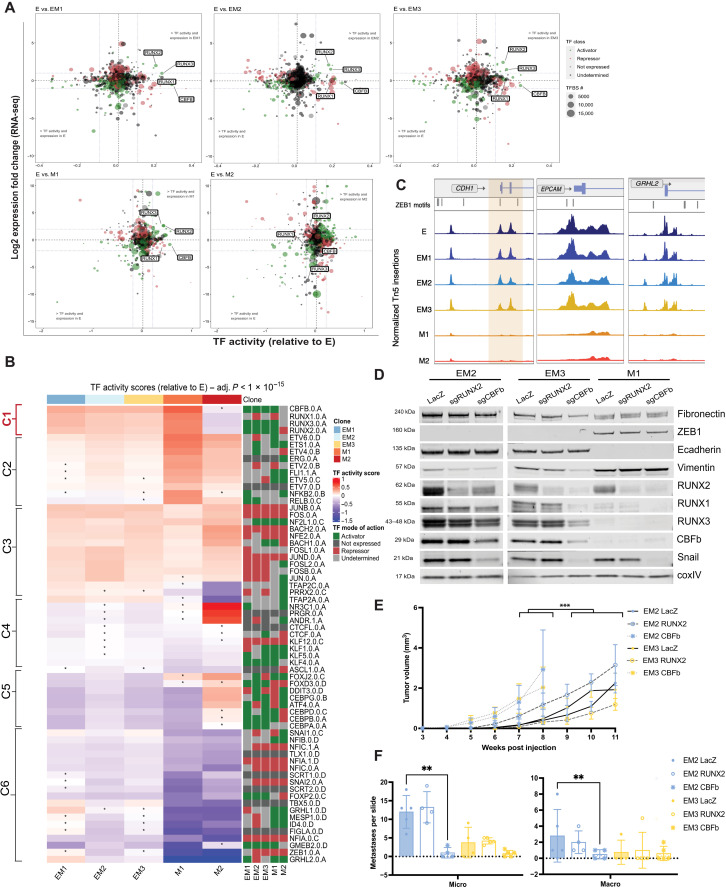
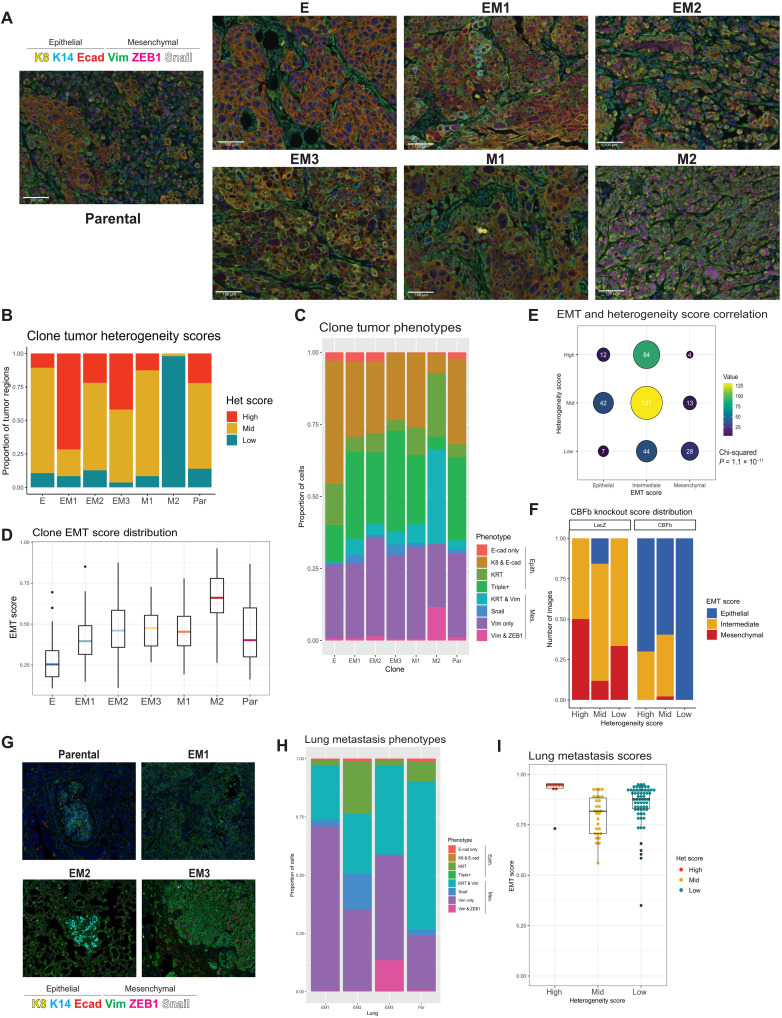
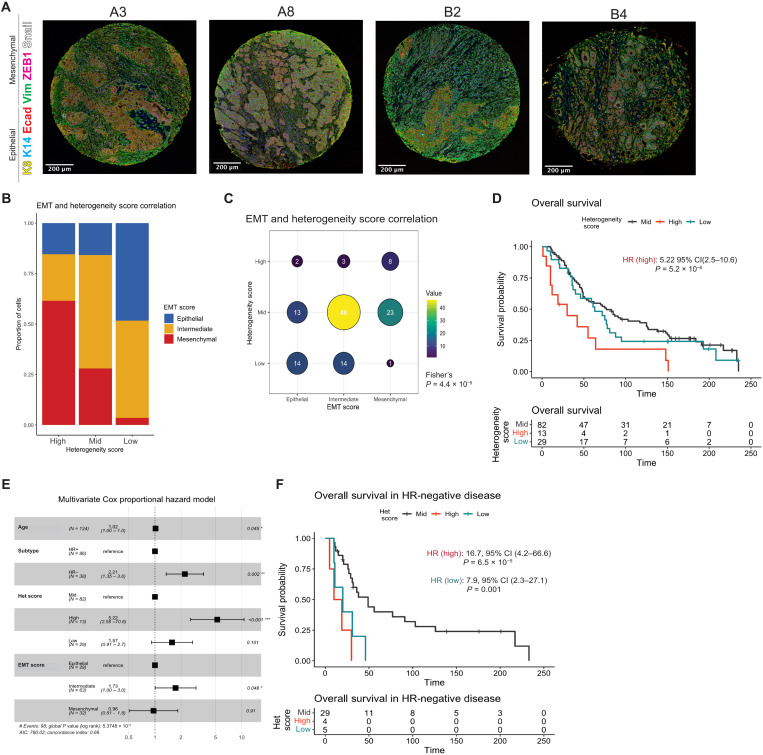
The epithelial-to-mesenchymal transition (EMT) is frequently co-opted by cancer cells to enhance migratory and invasive cell traits. It is a key contributor to heterogeneity, chemoresistance, and metastasis in many carcinoma types, where the intermediate EMT state plays a critical tumor-initiating role. We isolate multiple distinct single-cell clones from the SUM149PT human breast cell line spanning the EMT spectrum having diverse migratory, tumor-initiating, and metastatic qualities, including three unique intermediates. Using a multiomics approach, we identify CBFβ as a key regulator of metastatic ability in the intermediate state. To quantify epithelial-mesenchymal heterogeneity within tumors, we develop an advanced multiplexed immunostaining approach using SUM149-derived orthotopic tumors and find that the EMT state and epithelial-mesenchymal heterogeneity are predictive of overall survival in a cohort of stage III breast cancer. Our model reveals previously unidentified insights into the complex EMT spectrum and its regulatory networks, as well as the contributions of epithelial-mesenchymal plasticity (EMP) in tumor heterogeneity in breast cancer.


Figures

Fig. 1.
Fig. 1.. The heterogeneous cell line SUM149PT contains multiple distinct EMT states that can be isolated as single-cell clones.
(A) A schematic of the flow cytometry method used to isolate single-cell clones that present as an epithelial (E), three distinct intermediate (EM1, EM2, and EM3), and two mesenchymal (M1 and M2) EMT states. (B) In vitro assessment of clonal migratory and invasive characteristics as measured in a standard transwell assay (n = 3, SD, ****P < 0.0001, and *P < 0.05). Canonical EMT marker expression levels as determined by (C) quantitative RT-PCR (SD, n = 4) or (D) immunoblotting to rank SUM149 clones along the EMT spectrum. (E) Bright-field and (F) immunofluorescent images of EMT clones in vitro stained with vimentin and E-cadherin displaying cell morphology and marker expression and localization, respectively. (G) EMT signature of EMT clones and parental line generated from the ordinal multinomial logistic regression method of gene scoring and (H) distribution of EMT score of the EMT clones among other breast cancer cell lines from the CCLE. (I) Immunofluorescent staining for E-cadherin (red), vimentin (green), and KRT8 (white) of four triple-negative breast cancer lines (two intermediate, HCC38 and Cal-51; one epithelial, HCC1143; and one mesenchymal, MDA-MB-231) from the CCLE displaying heterogeneous phenotypes.
Fig. 2.
Fig. 2.. Differences in primary tumor growth and metastatic potential between EMT clones.
(A) Tumor growth curves measured weekly following orthotopic injection of clonal and parental cell lines at 2500 cells exhibit exponential growth differences between EMT states [TumGrowth (31) piecewise regression model breakpoint = 6 weeks, ***Holm adjusted P < 0.0001 and **Holm adjusted P < 0.01, n = 10]. (B) Survival curve of EMT clones and parental line displaying differences in survival across the parental line and early intermediate EMT states. Cox regression analysis (***Holm adjusted P < 0.0001 and *Holm adjusted P < 0.015). (C) Tumor-initiating cell frequency calculated by limiting dilution assay with cells injected at 250,000, 25,000, and 2500 cells per flank. TIC calculated at 8 weeks after injection. (D) Lung sections collected at the time of maximum tumor burden (2 cm3), with GFP-labeled tumor cells, following orthotopic injections as in (A). (E) Lungs fixed and stained from (A) with H&E and enumeration of micrometastatic (<10 adjacent cells) and macrometastatic (10+ adjacent cells) regions (SD, n = 5, micro P < 0.02 and macro P = n.s.). n.s., not significant. (F) Representative bright-field images of micro- and macrometastases from one mouse lung (EM1).
Fig. 3.
Fig. 3.. Identification of stabilizing transcription factors in the intermediate EMT state by transcriptional and chromatin analysis.
(A) PCA of the 500 most variable genes between all EMT clones and SUM149 parental line and (B) intermediate clones only from RNA-seq. (C) UpSet plot of all differentially expressed genes (referenced to clone E) that are shared and unique to each EMT clone. (D) Unsupervised hierarchical clustering of the top 500 differentially expressed genes in all comparisons to clone E (P value of <0.05). (E) ATAC-seq peak accessibility measured as counts per million (CPM) normalized Tn5 insertions surrounding consensus peaks, promoter-associated, and distal-intergenic peaks, respectively, for each EMT clone. (F) Unsupervised hierarchical clustering of transcription factor motif enrichment (−log10 adjusted P value, hypergeometric test) among accessible chromatin peaks unique to each clone, relative to (E). Motifs obtained from the JASPAR database were identified using motifmatchr (P < 0.05) and tested for enrichment against the background set of all peaks identified in the respective clone using the hypergeometric test. Asterisk indicates a −log10 P-value enrichment threshold greater than 20, scaled to fit.
Fig. 4.
Fig. 4.. Identification of stabilizing transcription factors in the intermediate EMT state by multiomics analysis.
(A) Advanced volcano plot of highly significant transcription factors, highlighting the RUNX family transcription factor activity, relative to clone E determined by diffTF from ATAC-seq along the x axis (label cutoffs at 0.1, −0.1 TF activity), plotted against log2 fold gene expression values of transcription factors on the y axis (label cutoffs at 1, −1 log2 fold). Transcription factor classification, determined by transcription factor expression, displayed in bubble color, and number of transcription factor binding sites used to determine TF activity plotted as bubble size. (B) Unsupervised hierarchical clustering of TF activity scores (z-score–transformed) compared to clone E (adjusted P value <1 × 10⁻¹⁵, asterisk indicates n.s. in that comparison). Right-hand side displays TF classification, determined by changes in TF expression (diffTF), as an activator, repressor, not expressed, or undetermined. (C) Peak accessibility of Tn5-normalized, merged coverage of three canonical ZEB1 target genes, CDH1, EPCAM, and Grainyhead like 2 (GRHL2), across all clones from ATAC-seq. ZEB1 TF motifs highlighted above signal tracks. (D) Protein levels of canonical EMT markers determined by Western blot following CRISPR-Cas9–mediated knockout of LacZ, RUNX2, and CBFβ in late intermediate and early mesenchymal clones. (E) Tumor growth curves measured weekly following orthotopic injection of CBFb knockout at 2500 cells [TumGrowth (31) piecewise regression model breakpoint = 6 weeks, ***initial-phase Holm adjusted P value <0.0001, n = 5]. (F) Lungs fixed and stained from (E) with H&E and enumeration of micrometastatic (<10 adjacent cells) and macrometastatic (10+ adjacent cells) regions (SD, n = 5, EM2 P < 0.001 and EM3 P = n.s.).
Fig. 5.
Fig. 5.. Multiplexed staining of SUM149 tumors and lungs identifies phenotypes and quantifies tumor heterogeneity and overall EMT state in clone-derived and CBFb-depleted tumors.
(A) EMT clone-derived tumors resected at 1.5 cm3 and stained with a six-marker EMT panel using multiplexed immunostaining (n = ~50 images per tumor). (B) Empirically determined heterogeneity scores of EMT clone-derived tumors. Rubric: low (one major cell trait with up to one minor trait), mid (two major cell traits with up to three minor traits), and high (three or more major cell traits present with two or more minor traits). (C) Boxplot of EMT phenotypes generated from inForm cell phenotype analysis displaying the composition of each clonally derived tumor (n = ~50 images per tumor). (D) EMT score distribution in clonally derived tumors generated from weighted multivariable logistic regression of the phenotypes in (C) present in each tumor. (E) Correlation of EMT (tertile; epithelial: 0 to 0.29, intermediate: 0.3 to 0.69, and mesenchymal: 0.7 to 1) and heterogeneity score in EMT clone-derived tumor images (n = 365, chi-squared P = 1.1 × 10⁻¹¹). (F) Distribution of EMT (tertile) and heterogeneity scores in EM2 and EM3 clone-derived tumors following CBFb knockout, compared to LacZ control tumors. (G) Outgrowth lung metastases of EM1, EM2, EM3, and parental tumors stained with the six-marker EMT panel using multiplexed immunostaining to determine (H) EMT phenotypes present and (I) EMT and heterogeneity scores.
Fig. 6.
Fig. 6.. High tumor heterogeneity and intermediate EMT states are associated with poor prognosis in patient tumors.
(A) Stage III breast cancer patient tumors (n = 124) stained with the six-marker EMT panel using multiplexed immunostaining. (B) Stage III breast cancer cohort tumor EMH score, determined by an entropy-based model of marker distribution at a single-cell level per image, trained and validated by the SUM149 clone tumors, plotted with EMT score (tertile; epithelial: 0 to 0.29, intermediate: 0.3 to 0.69, and mesenchymal: 0.7 to 1) generated from weighted multivariable logistic regression of the phenotypes present in each tumor for each patient sample. (C) Correlation of EMT and heterogeneity scores from (B) (Fisher’s exact test P = 4.4 × 10⁻⁵). (D) Kaplan-Meier plot of overall survival stratified by heterogeneity score. Hazard ratio and P value reported from (E) a forest plot of multivariate Cox proportional hazard model of overall survival for heterogeneity score and EMT score accounting for age and subtype. (F) Kaplan-Meier plot of overall survival in hormone-negative patient samples stratified by heterogeneity score. Hazard ratios and P values reported from multivariate Cox proportional hazard model.

Similar articles

Cited by

References

    1. Thiery J. P., Epithelial-mesenchymal transitions in tumour progression. Nat. Rev. Cancer 2, 442–454 (2002). - PubMed
    1. Easwaran H., Tsai H. C., Baylin S. B., Cancer epigenetics: Tumor heterogeneity, plasticity of stem-like states, and drug resistance. Mol. Cell 54, 716–727 (2014). - PMC - PubMed
    1. Pattabiraman D. R., Weinberg R. A., Tackling the cancer stem cells—What challenges do they pose? Nat. Rev. Drug Discov. 13, 497–512 (2014). - PMC - PubMed
    1. Ognjenovic N. B., Bagheri M., Mohamed G. A., Xu K., Chen Y., Saleem M. A. M., Brown M. S., Nagaraj S. H., Muller K. E., Gerber S. A., Christensen B. C., Pattabiraman D. R., Limiting self-renewal of the basal compartment by pka activation induces differentiation and alters the evolution of mammary tumors. Dev. Cell 55, 544–557.e6 (2020). - PMC - PubMed
    1. Shibue T., Weinberg R. A., EMT, CSCs, and drug resistance: The mechanistic link and clinical implications. Nat. Rev. Clin. Oncol. 14, 611–629 (2017). - PMC - PubMed