. 2022 Jul 11;12(12):5434-5450.
doi: 10.7150/thno.73426. eCollection 2022.

Transient upregulation of EGR1 signaling enhances kidney repair by activating SOX9+ renal tubular cells

Affiliations

Transient upregulation of EGR1 signaling enhances kidney repair by activating SOX9+ renal tubular cells

Jian-Wen Chen et al. Theranostics. .

Abstract

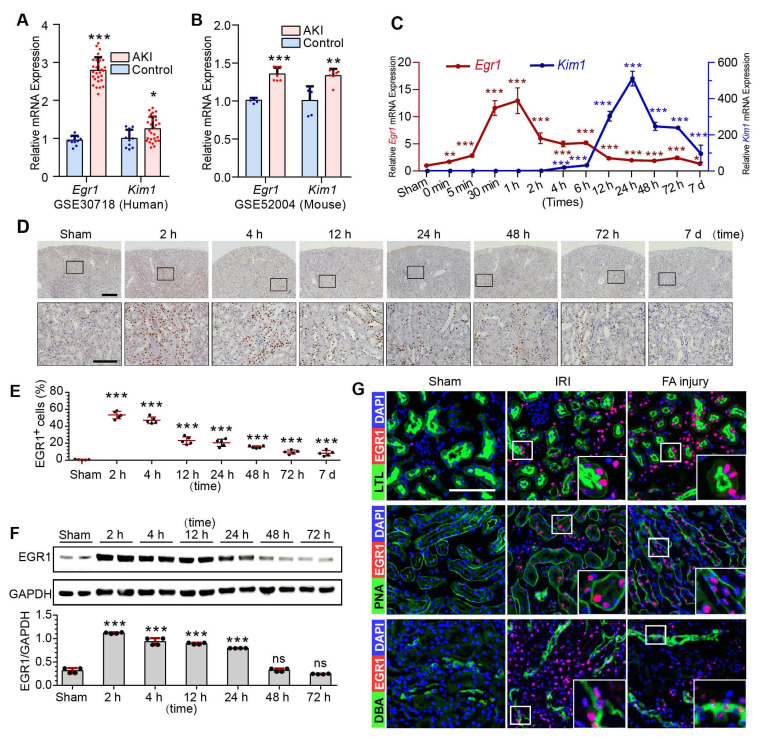
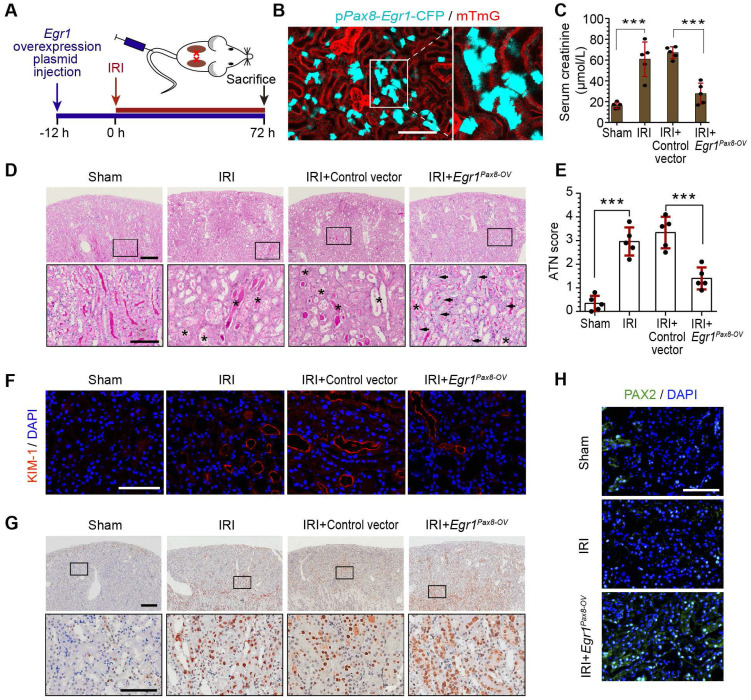
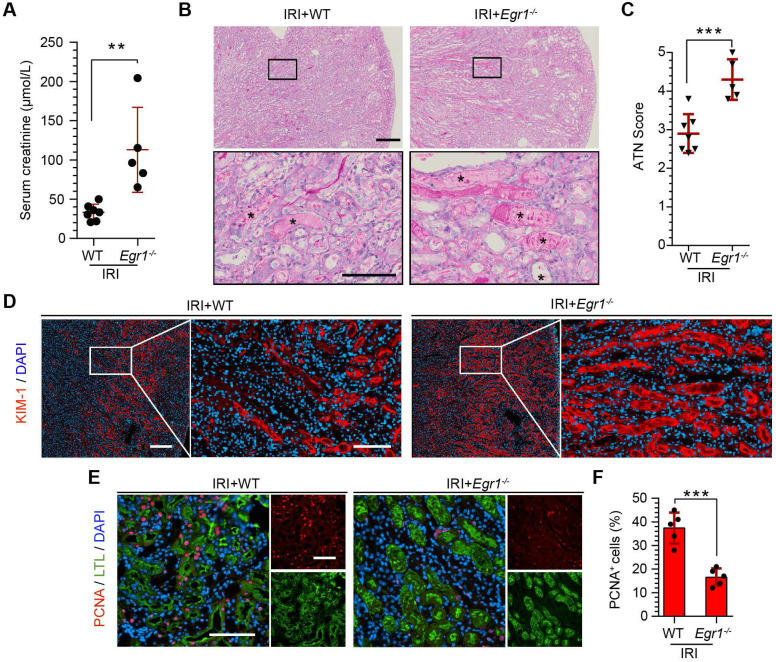
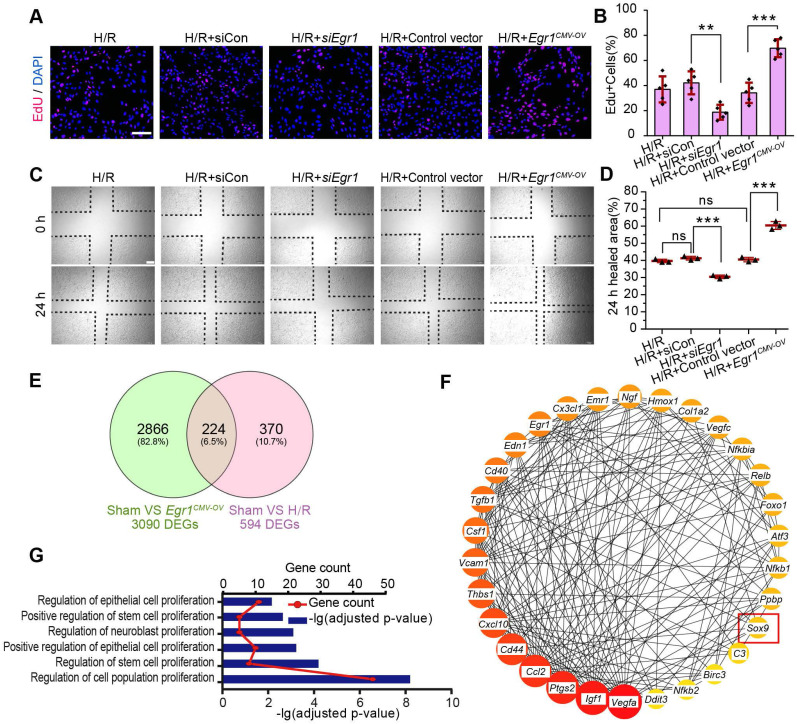
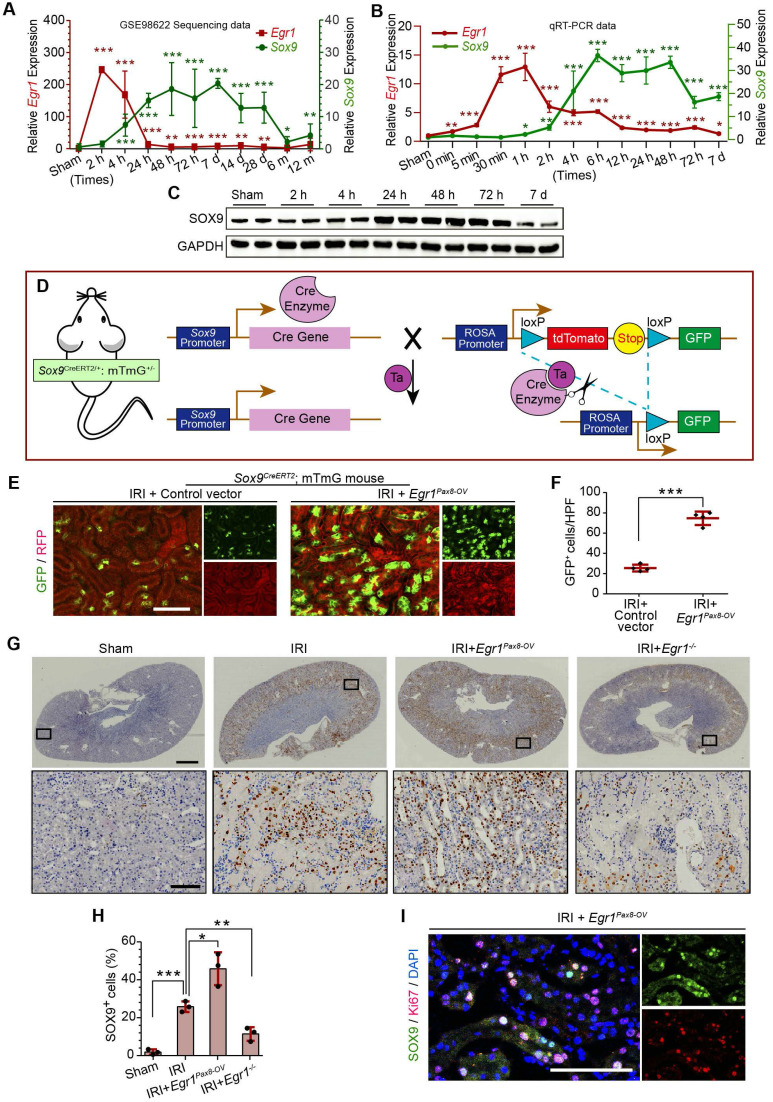
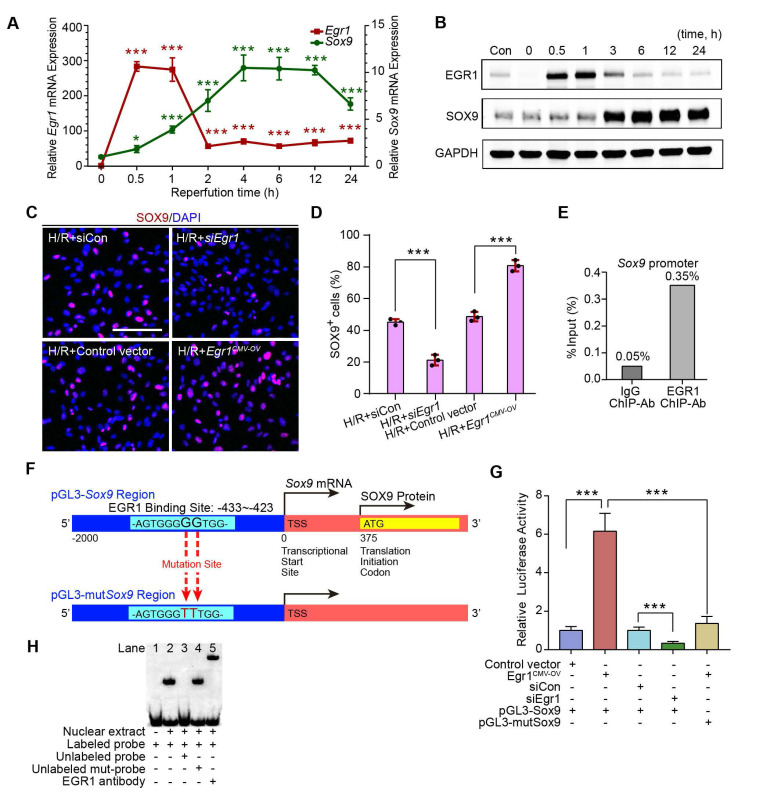
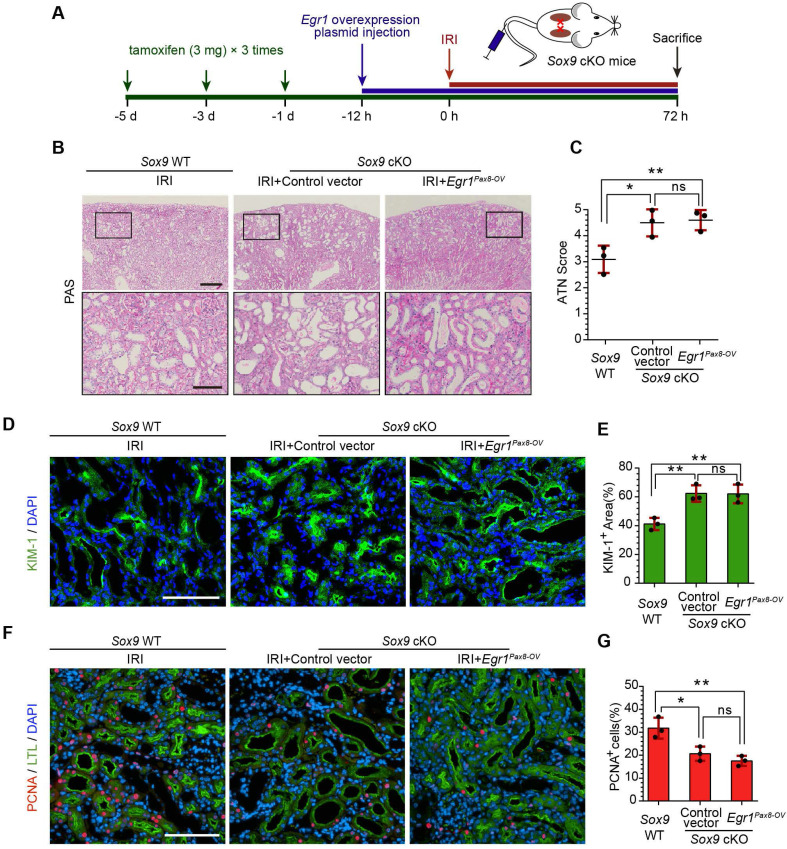
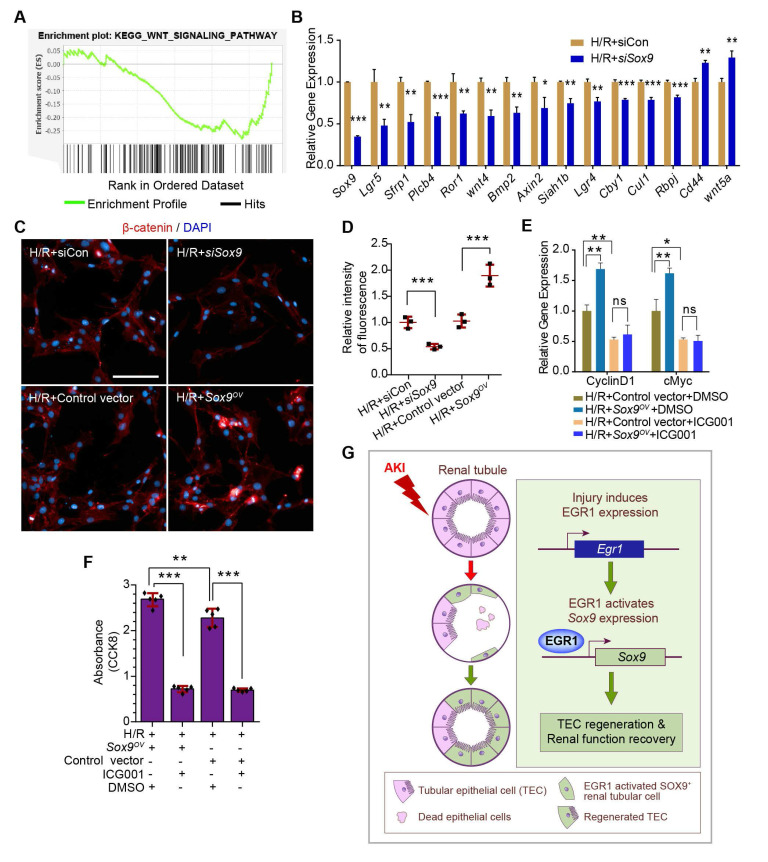
Background: Acute kidney injury (AKI) is associated with damage to the nephrons and tubular epithelial cells (TECs), which can lead to chronic kidney disease and end-stage renal disease. Identifying new biomarkers before kidney dysfunction will offer crucial insight into preventive and therapeutic options for the treatment of AKI. Early growth response 1 (EGR1) has been found to be a pioneer transcription factor that can sequentially turn on/off key downstream genes to regulate whole-body regeneration processes in the leopard worm. Whether EGR1 modulates renal regeneration processes in AKI remains to be elucidated. Methods: AKI models of ischemia-reperfusion injury (IRI) and folic acid (FA) were developed to investigate the roles of EGR1 in kidney injury and regeneration. To further determine the function of EGR1, Egr1-/- mice were applied. Furthermore, RNA sequencing of renal TECs, Chromatin Immunoprecipitation (ChIP) assay, and Dual-luciferase reporter assay were carried out to investigate whether EGR1 affects the expression of SOX9. Results: EGR1 is highly expressed in the kidney after AKI both in humans and mice through analysis of the Gene Expression Omnibus (GEO) database. Furthermore, we verified that EGR1 rapidly up-regulates in the very early stage of IRI and nephrotoxic models of AKI, and validation studies confirmed the essential roles of EGR1 in renal tubular cell regeneration. Further experiments affirmed that genetic inhibition of Egr1 aggravates the severity of AKI in mouse models. Furthermore, our results revealed that EGR1 could increase SOX9 expression in renal TECs by directly binding to the promoter of the Sox9 gene, thus promoting SOX9+ cell proliferation by activating the Wnt/β-catenin pathway. Conclusions: Together, our results demonstrated that rapid and transient induction of EGR1 plays a renoprotective role in AKI, which highlights the prospects of using EGR1 as a potential therapeutic target for the treatment of AKI.

Keywords: Acute kidney injury (AKI); Early growth response 1 (EGR1); Regeneration; SOX9; Tubular epithelial cells (TECs).


Conflict of interest statement

Competing Interests: The authors have declared that no competing interest exists.

Figures

Figure 1
Figure 1
EGR1 is rapidly and transiently induced in AKI. (A) The mRNA expression of Egr1 and Kim1 were significantly upregulated in AKI human sample (dataset GSE30718). (B) The mRNA expression of Egr1 and Kim1 were significantly upregulated in mouse kidney sample (dataset GSE52004) after IRI. (C) The mRNA expression of Egr1 and Kim1 in renal tissues at different reperfusion times in our own IRI model. (D) Immunohistochemical analysis of EGR1 expression in renal tissues was performed at different time points after I/R injury. Scale bars: 300 µm (upper panel), 100 µm (lower panel). (E) Quantification of EGR1 expression. n = 5 mice per group. (F) Western blot analysis of renal EGR1 protein expression in injured kidneys at different time points after renal IRI. n = 4 mice per group. (G) Co-immunostaining shows the localization of EGR1 after IRI and FA injury. Kidney cryosections 2 h after IRI were double stained with EGR1 (red), and LTL, PNA, DBA (green). Scale bars: 100 µm. ns, no significant; ***p < 0.001. AKI, acute kidney injury; IRI, ischemia-reperfusion injury; qRT-PCR, quantitative real-time PCR; Kim1, kidney injury molecule-1; LTL, lotus teragonolobus lectin, a proximal tubule marker; PNA, peanut agglutinin, a henle/distal tubule loop marker; DBA, dolichosbiflorus agglutinin, a collecting duct marker; FA, folic acid. DAPI, 4', 6-diamidino-2-phenylindole.
Figure 2
Figure 2
EGR1 decreases tubular injury and drives renal tubule repair and regeneration after AKI. (A) Experimental design. The blue arrow indicates mouse tail injection of the Egr1 overexpression plasmid. The red arrow indicates the establishment of IRI-AKI model. (B) CFP expression in renal tubular cells of mTmG mice (tubular cells were all marked red) 24 h after injection of the plasmid pPax8-Egr1-CFP (The plasmid transfected cells which were Pax8 positive will be marked cyan) was traced by two-photon microscopy. This is a direct microscopic observation of living tissue under a two-photon microscope without tissue staining. (C) Serum creatinine levels in different groups 3 d after IRI. n = 5 mice per group. (D) Representative micrographs of PAS staining show kidney injury in mice injected with Control vector or pPax8-Egr1 plasmid (Egr1Pax8-OV) 3 d after IRI. Asterisks in the enlarged boxed areas indicate injured tubules. Arrows in the enlarged boxed areas indicate regenerative cells and cell rearrangement. Scale bars: 300 µm (upper panel), 100 µm (lower panel). (E) Quantitative assessment of tubular damage. n = 5 per group. (F) Representative immunofluorescence staining of KIM-1 (red) in different groups 3 d after IRI. n = 4 per group. (G) Representative micrographs showing PCNA-positive tubular cells in distinct groups after IRI. n = 4 per group. Scale bars: 300 µm (upper panel), 100 µm (lower panel). (H) Immunostaining of PAX2 (green) in distinct groups 3 d after IRI. Scale bars: 100 µm. ***p < 0.001. Egr1Pax8-OV, Egr1 overexpression plasmid with Pax8 promoter. IRI, ischemia-reperfusion injury; AKI, acute kidney injury; CFP, cyan fluorescence protein; PAS, periodic acid-schif; SCr, Serum creatinine; ATN, acute tubular necrosis.
Figure 3
Figure 3
EGR1 deficiency exacerbates kidney injury and inhibits tubule repair after AKI. (A) SCr levels in WT and Egr1-/- mice 3 d after IRI. n = 5-7 per group. (B) Representative micrographs after PAS staining show kidney injury in WT and Egr1-/- mice 3 d after IRI. The asterisks in the enlarged boxed areas indicate injured tubules. Scale bars: 300 µm (upper panel), 100 µm (lower panel). (C) The results of a quantitative assessment of morphological damage (ATN score) are presented. n = 5-7 per group. (D) Representative immunofluorescence staining of KIM-1 (red) in WT and Egr1-/- mice 3 d after IRI. Scale bars: 300 µm (left panel), 100 µm (right panel). (E) Representative co-immunostaining of PCNA (red) and LTL (green) in different groups 3 d after IRI. Scale bars: 100 µm. (F) Quantitative detection of PCNA positive cells in different groups. n = 5 per group. **p < 0.01; ***p < 0.001. SCr, Serum creatinine; IRI, ischemia-reperfusion injury; AKI, acute kidney injury; WT mice, wild-type mice; Egr1-/- mice, Egr1 knockout mice; PAS, periodic acid-schiff; ATN, acute tubular necrosis.
Figure 4
Figure 4
EGR1 promotes the proliferation and migration of renal TECs after hypoxia/reoxygenation injury in vitro. (A) Representative immunofluorescence staining of EdU (red) in TCMK1 cells after H/R injury. Scale bars: 100 µm. (B) Quantitative data showing the number of EdU-positive cells (%) in different groups after H/R injury. n = 5 per group. (C) A scratch wound assay was used to detect the migrate ability of TCMK1 cells in Egr1CMV-OV and siEgr1 group. Scale bars: 100 µm. (D) Quantification of the scratch wound assay data from C., n = 3 per group. (E) Mouse primary renal tubular epithelial cells were isolated and treated with H/R (H/R group) or Egr1 overexpression plasmid (Egr1CMV-OV group) or not subjected to treatment (Sham group) respectively, each group contained three samples. After sending RNA sequencing (RNA-Seq), a total of 224 overlapping genes were found in the Venn diagram of DEGs in the Sham group vs. the Egr1 CMV-OV group and the Sham group vs. the H/R group. (F) The PPI network of the 30 genes hub genes was visualized with Cytoscape. Among these 30 hub genes, Sox9 reflects the positive regulation of epithelial cell proliferation (GO:0050679). (G) GO analysis of the 224 overlapping genes. ns, no significant; **p < 0.01; ***p < 0.001. H/R, hypoxia/reoxygenation; Egr1 CMV-OV, Egr1 overexpressing plasmid with CMV promotor; siCon, the negative control small interfering RNA; siEgr1, small interfering RNA against Egr1; DEGs, differentially expressed genes; PPI, protein-protein interaction; RNA-Seq, RNA sequencing.
Figure 5
Figure 5
EGR1 promotes SOX9 expression after AKI in vivo. (A) Expression of Sox9 and Egr1 mRNA in mouse kidney tissue at different time points after IRI in the GSE98622 sequencing data. (B) The qRT-PCR results of Sox9 and Egr1 mRNA expression in mouse kidney tissue at different time points (including the time points within 2 h of reperfusion) after IRI in our own AKI model. (C) Western blot analysis shows SOX9 protein levels in injured kidneys at different times after IRI. (D) The schematic diagram of how mTmG is regulated by Sox9CreERT2 in Sox9CreERT2; mTmG+/- mouse. (E-F) Representative micrographs (E) and number of GFP (green) positive cells (F) in Sox9CreERT2; mTmG+/- mice at 3 d after IRI. n = 4 mice per group. Scale bars: 100 µm. (G-H) Immunohistochemical analysis (G) and quantitative (H) SOX9 expression data in different groups after renal IRI. n = 3 per group. Scale bars: 1 mm (upper panel), 100 µm (lower panel). (I) Co-immunostaining of Ki67 (red) and SOX9 (green) in the kidneys of mice injected with the Egr1Pax8-OV plasmid 3 d after IRI. Scale bars: 100 µm. AKI, acute kidney injury; qRT-PCR, quantitative real-time PCR; Egr1Pax8-OV, Egr1 overexpression plasmid with Pax8 promoter; Egr1-/-mice., Egr1 knockout mice. *p < 0.05; **p < 0.01; ***p < 0.001. IRI, ischemia-reperfusion injury; GFP, green fluorescent protein; RFP, red fluorescent protein; HPF, High power field.
Figure 6
Figure 6
EGR1 promotes SOX9 expression in vitro and mediated SOX9 expression by binding the Sox9 promoter. (A) mRNA and (B) protein levels of Sox9 and Egr1 in TCMK1 cells after reoxygenation for different durations. *p < 0.05 versus the 0h group, ***p < 0.001 versus the 0 h group; ns, no significant. n = 3 per group. (C-D) Representative immunofluorescence staining(red) (C) and quantitative SOX9 data (D) in distinct groups after H/R injury in TCMK1 cells. n = 3 per group. Scale bars: 100 μm. (E) ChIP enrichment rate for the Sox9 gene binding site in EGR1. (F) Schematic diagram of possible binding sites in the Sox9 promoter region for the transcription factor EGR1 and mutation sites. (G) Relative luciferase activity in different groups determined by a dual-luciferase reporter assay. n = 5 per group. (H) The EMSA assay showed a specific binding of labeled probe to EGR1. Lane 1, biotin-labeled probe only; lane 2, biotin-labeled probe and nuclear extracts; lanes 3, biotin-labeled probe, nuclear extracts plus unlabeled competitor probe; lane 4, biotin-labeled probe, nuclear extracts plus unlabeled mut-probe; lane 5, super-shift EMSA assay with the anti-EGR1 antibody. ***p < 0.001. H/R, hypoxia/reoxygenation; Con, Control; siRNA, small interfering RNA; siCon, negtive control siRNA; Egr1 CMV-OV, Egr1 overexpressing plasmid with CMV promotor; siEgr1, siRNA against Egr1; pGL3-Sox9, pGL3 plasmid containing the Sox9 promoter region; pGL3-mutSox9, pGL3 plasmid containing the Sox9 promoter region with mutation sites; ChIP, Chromatin ImmunoPrecipitation; EMSA, Electrophoretic mobility shift assay.
Figure 7
Figure 7
EGR1 requires SOX9 to drive renal tubule repair and regeneration after AKI. (A) The experimental design used for the injection of the Egr1 overexpression plasmid through the mouse tail vein, intraperitoneal injection of tamoxifen, and IRI model construction inSox9 WT and Sox9 cKO mice. (B) Representative micrographs of PAS staining show morphological injury in the kidneys of Sox9 WT or Sox9 cKO mice injected with Control vector or Egr1Pax8-OV plasmid 3 d after IRI. Scale bars: 300 µm (left panel), 100 µm (right panel). (C) Quantitative assessment of tubular damage. n = 3 per group. (D-E) Representative immunofluorescence staining of KIM-1 (green) (D) and quantitative detection of the KIM-1 positive area (E) in different groups 3 d after IRI. n = 3 per group. Scale bars: 100 µm. (F) Representative micrographs show PCNA (red)-positive tubular cells in distinct groups after IRI. Scale bars: 100 µm. (G) Quantitative data indicating the number of PCNA-positive cells in Sox9 WT or Sox9 cKO mice injected with Control vector or Egr1Pax8-OV plasmid 3 d after IRI. n = 3 per group. ns, no significant; *p < 0.05, **p < 0.01. IRI, ischemia-reperfusion injury; Sox9 WT mice, Slc34a1CreERT2/+: Sox9+/+ mice; Sox9 cKO mice, Slc34a1CreERT2/+: Sox9fl/fl mice; PAS, periodic acid-schiff; Egr1Pax8-OV, Egr1 overexpression plasmid with Pax8 promoter.
Figure 8
Figure 8
SOX9 requires the Wnt/β-catenin pathway to drive renal tubule repair and regeneration after AKI. (A) GSEA of Sox9-responsive genes showing enrichment of the WNT signaling pathway in tubular epithelial cells. Normalized enrichment score (NES) = 1.00. (B) Relative expression of Wnt/β-catenin pathway-associated genes in siSox9 treated mouse primary renal tubular epithelial cells after H/R. (C-D) Representative immunofluorescence staining of β-catenin (red) (C) and quantitative detection of the β-catenin fluorescence intensity (D) in different groups after H/R in TCMK1 cells showing increased expression and nuclear translocalization of β-catenin after Sox9 overexpression. n = 4 per group. Scale bars: 100 µm. (E) Relative expression of Wnt/β-catenin pathway-activated genes (Cyclin D1 and cMyc) in Sox9-overexpressing (Sox9CMV-OV) and ICG001-treated TCMK1 cells after H/R. n = 3 per group. (F) CCK-8 assay of TCMK1 cells subjected to different treatments. n = 5 per group. (G) The schematic diagram showing the results of the whole study. After ischemic or nephrotoxic AKI, tubular epithelial cells are injured, some cells die, and some cells highly express EGR1. Overexpression of EGR1 increases SOX9 expression by binding the Sox9 gene promoter, and then SOX9+ renal tubular cells regeneration, thereby alleviate tubular injury and promote kidney recovery. ns, no significant; *p < 0.05, **p < 0.01, ***p < 0.001. H/R, hypoxia/reoxygenation; AKI, acute kidney injury; siCon, negtive control siRNA; siSox9, Sox9-specific small interfering RNA; Sox9OV, Sox9-overexpression plasmid; ICG001, a Wnt/β-catenin pathway inhibitor; GSEA, Gene set enrichment analysis; CCK-8, Cell Counting Kit-8.

Similar articles

Cited by

References

    1. Bellomo R, Kellum JA, Ronco C. Acute kidney injury. Lancet. 2012;380:756–66. - PubMed
    1. Han Q, Ai S, Hong Q, Zhang C, Song Y, Wang X. et al. A supramolecular hydrogel based on the combination of YIGSR and RGD enhances mesenchymal stem cells paracrine function via integrin α2β1 and PI3K/AKT signaling pathway for acute kidney injury therapy. Chem Eng J. 2022;436:135088.
    1. Izzedine H, Perazella MA. Anticancer Drug-Induced Acute Kidney Injury. Kidney Int Rep. 2017;2:504–14. - PMC - PubMed
    1. Qi R, Yang C. Renal tubular epithelial cells: the neglected mediator of tubulointerstitial fibrosis after injury. Cell Death Dis. 2018;9:1126. - PMC - PubMed
    1. Ostermann M, Joannidis M. Acute kidney injury 2016: diagnosis and diagnostic workup. Crit Care. 2016;20:299. - PMC - PubMed

Publication types

MeSH terms