. 2022 Aug 9;55(8):1483-1500.e9.
doi: 10.1016/j.immuni.2022.07.001. Epub 2022 Jul 30.

Lung fibroblasts facilitate pre-metastatic niche formation by remodeling the local immune microenvironment

Affiliations

Lung fibroblasts facilitate pre-metastatic niche formation by remodeling the local immune microenvironment

Zheng Gong et al. Immunity. .

Abstract

Primary tumors are drivers of pre-metastatic niche formation, but the coordination by the secondary organ toward metastatic dissemination is underappreciated. Here, by single-cell RNA sequencing and immunofluorescence, we identified a population of cyclooxygenase 2 (COX-2)-expressing adventitial fibroblasts that remodeled the lung immune microenvironment. At steady state, fibroblasts in the lungs produced prostaglandin E2 (PGE2), which drove dysfunctional dendritic cells (DCs) and suppressive monocytes. This lung-intrinsic stromal program was propagated by tumor-associated inflammation, particularly the pro-inflammatory cytokine interleukin-1β, supporting a pre-metastatic niche. Genetic ablation of Ptgs2 (encoding COX-2) in fibroblasts was sufficient to reverse the immune-suppressive phenotypes of lung-resident myeloid cells, resulting in heightened immune activation and diminished lung metastasis in multiple breast cancer models. Moreover, the anti-metastatic activity of DC-based therapy and PD-1 blockade was improved by fibroblast-specific Ptgs2 deletion or dual inhibition of PGE2 receptors EP2 and EP4. Collectively, lung-resident fibroblasts reshape the local immune landscape to facilitate breast cancer metastasis.

Keywords: PGE2; breast cancer; dendritic cells; fibroblasts; immune dysfunction; immunosuppression; immunotherapeutics; lung metastasis; monocytes; pre-metastatic niche.


Conflict of interest statement

Declaration of interests The authors declare no competing interests.

Figures
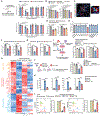
Figure 1.
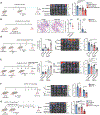
Figure 1.. Lung fibroblasts reprogram BM-DCs and monocytes to be dysfunctional or immunosuppressive via COX-2
(A) MHC-I and MHC-II expression of implanted BM-DCs in different tissues and organs was measured after transfer into naïve or 4T1 tumor-bearing mice (n=5). MFI, mean fluorescence intensity. (B) MHC-I and MHC-II expression of BM-DCs was measured after monoculture or co-culture with the indicated lung tissue cells isolated from naïve mice (n=3). (C) Localization of implanted BM-DCs and resident CD140a+ fibroblasts in lung section of naïve CD140aEGFP mouse. Scale bar, 10 μm. (D) MHC-I and MHC-II expression of BM-DCs was measured after co-culture with CD140a+ lung fibroblasts or fibroblast-derived CM (n=5). (E) MHC-II expression of BM-DCs was measured after stimulation with the indicated factors (n=3). (F and G) MHC-I and MHC-II expression (F) and T cell priming capacities (G) of BM-DCs were measured after stimulation with WT or Ptgs2−/− lung fibroblast CM (n=3-4). (H) Heatmap showing the expression of selected genes from the RNA-seq data of BM-DCs. (I-J) Effect of BM-DCs on proliferation of T cells (I) or cytotoxicity of NK cells (J) was analyzed after stimulation with WT or Ptgs2−/− lung fibroblast CM (n=3-5). (K-L) Expression of indicated genes (K) and effect on T cell proliferation (L) of BM-derived monocytes was measured after stimulation with WT or Ptgs2−/− lung fibroblast CM (n=4-5). n is the number of biological replicates. Data are representative of at least five independent experiments (A-G, I-L) and shown as mean ± SEM. *p< 0.05, **p< 0.01, ***p< 0.001; ****p< 0.0001; NS, not significant, by one-way ANOVA (B, D-G, I-L) or two-way ANOVA (A). See also Figure S1.
Figure 2.
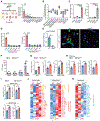
Figure 2.. Ptgs2-expressing lung fibroblasts modulate the lung resident immune microenvironment at the steady state
(A) Quantification of Ptgs2 expression in different organs isolated from naïve Ptgs2Luc mice (n=6). (B) Analysis of PTGS2 expression in human normal tissue microarray data (GSE7307). (C-D) Ptgs2 expression and PGE2 production was measured in the indicated lung tissue cells (C) or different tissue-derived fibroblasts (D) isolated from naïve mice (n=4-6). MG, mammary gland. (E) Ptgs2 expression (left) and COX-2 protein level (right) was detected in lung CD140a+ fibroblasts from WT or Ptgs2ΔFb naïve mice. Scale bars, 10 μm. (F-G) PGE2 production of indicated lung tissue cells (F) and the total number of lung DCs, CD4+ and CD8+ T cells (G) was measured in WT or Ptgs2ΔFb naïve mice (n=4-5). (H) MHC-I and MHC-II expression and OVA uptake ability was determined in lung DCs from WT or Ptgs2ΔFb naïve mice (n=5). (I) MHC-I and MHC-II expression was determined in lung CD11b+ and CD103+ DCs from WT or Ptgs2ΔFb naïve mice (n=6). (J and K) Heatmap showing expression of indicated genes from the RNA-seq data of lung CD11b+ or CD103+ DCs (J) and conventional monocytes (K) from WT or Ptgs2ΔFb naïve mice. n is the number of biological replicates. Data are representative of at least three (A, D, I) or five (C, E-H) independent experiments and shown as mean ± SEM. *p< 0.05, **p< 0.01, ***p< 0.001; ****p< 0.0001; NS, not significant, by one-way ANOVA (A, C-D) or unpaired Student’s t-test (E-I). See also Figure S2.
Figure 3.
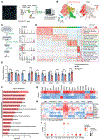
Figure 3.. Identification of Ptgs2-expressing fibroblasts by scRNA-seq
(A) Workflow depicts isolation of CD140a+ lung fibroblasts from naïve CD140aEGFP mice for scRNA-seq. (B) t-SNE plots (left) and feature plots (right) showing the Ptgs2hi fibroblasts (cluster 0) among lung CD140a+ fibroblasts. (C) Schematic showing the PGE2 synthesis pathway (left), and violin plots (right) showing the expression levels of the indicated genes across each cluster. (D) Heatmap showing the expression of the top-rated marker genes across each cluster. (E) mRNA expression of the indicated genes was measured in lung fibroblasts isolated from WT or Ptgs2ΔFb naïve mice (n=6). (F) Enrichment analysis for Gene Ontology terms in Ptgs2hi fibroblasts (cluster 0). (G) Heatmap showing transcription factor activity analysis of the three major fibroblast subsets (clusters 0, 1 and 2). (H) Heatmap showing co-expression analysis of human genes co-expressed with PTGS2 from human normal tissue microarray data (GSE3526). LN, lymph node. (I) Dot plots showing expression of the selected genes across each cluster. n is the number of biological replicates. Data are representative of at least three independent experiments (E). *p< 0.05, **p< 0.01, ****p< 0.0001; NS, not significant, by unpaired Student’s t-test (E). See also Figure S3.
Figure 4.
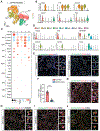
Figure 4.. Ptgs2hi lung fibroblasts localize primarily within the lung adventitial space
(A) t-SNE plots showing lung CD140a+ fibroblasts from the scRNA-seq data in Figure S3A. AdvF, adventitial fibroblast; AlvF, alveolar fibroblast; LipF, lipofibroblast. (B and C) Violin plots (B) and dot plots (C) showing expression of the indicated genes across each cluster. Gen, general fibroblast; MyoF, myofibroblast; FibM, fibromyocyte; ASM, airway smooth muscle; VSM, vascular smooth muscle; Peri, pericyte. (D) Violin plots showing expression of the indicated genes in human lung stromal cells from a published dataset (EGAS00001004344). Meso, mesothelial cells. (E and F) Representative images showing the localization of CD140a-GFP+ COX-2+ cells in naïve mouse lung adventitia or alveolar space (E), and the percentage of COX-2+ cells among CD140a+ fibroblasts was quantified in these two regions (F). For the percentage calculation, two pictures were chosen for each region from each mouse lung section; n = 5 mice per group. Scale bars, 50 μm. aw, airway; bv, blood vessel. (G-J) Representative images showing the localization of CD140a-GFP+ COX-2+ cells and myeloid cells (G), CD11b+ DCs (H), CD103+ DCs (I), or conventional monocytes (J) in pre-metastatic lung sections of AT3 tumor-bearing mice. Scale bars, 50 μm. n is the number of biological replicates. Data are representative of at least three independent experiments (E-J). ****p< 0.0001, by unpaired Student’s t-test (F).
Figure 5.
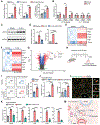
Figure 5.. IL-1β reinforces the phenotype of Ptgs2hi lung fibroblasts
(A) Ptgs2 expression (left), PGE2 production (middle), and frequency of COX-2+ cells (right) was measured in lung CD140a+ fibroblasts from naïve, AT3 and AT3-gcsf tumor-bearing mice (n=3-6). (B) Expression of the indicated genes in ex vivo cultured WT and Il1r−/− lung fibroblasts upon stimulation by vehicle or IL-1β (n=3). (C) COX-2 protein level in ex vivo cultured naïve mouse-derived lung fibroblasts stimulated with vehicle or IL-1β. (D) Ptgs2 expression (left) and PGE2 production (right) was measured in lung CD140a+ fibroblasts after stimulation with IL-1β in the absence or presence of NFκB pathway inhibitor MLN120B (n=3). (E and F) Heatmap showing expression of the indicated genes in the RNA-seq data of lung fibroblasts. (G) Volcano plots showing fold change and P-value for the comparison of IL-1β-treated and vehicle-treated lung fibroblasts based on the RNA-seq data. (H and I) As depicted in the schematic (H), the frequency of COX-2+ fibroblasts was measured among lung CD140a+ fibroblasts upon treatment by IL-1β (I) (n=7). Negative control IgG is shown. (J) Cell number (left) and IL-1β production (right) of lung neutrophils was quantified in naïve, AT3 and AT3-gcsf tumor-bearing mice (n=5). (K) Expression of the indicated genes was measured in lung fibroblasts after co-culture with lung neutrophils isolated from AT3-gcsf tumor-bearing mice in the absence or presence of anti-IL-1β (n=4). (L) Representative images showing the localization of CD140a-GFP+ COX-2+ cells and neutrophils in pre-metastatic lung sections. Scale bar, 50 μm. (M) Schematic showing that the immunoregulatory program by Ptgs2hi lung AdvF can be reinforced by IL-1β. n is the number of biological replicates. Data are representative of at least five independent experiments (A-D, I-L) and shown as mean ± SEM. *p< 0.05, **p< 0.01, ***p< 0.001; ****p< 0.0001; NS, not significant, by one-way ANOVA (A, D, J-K) or unpaired Student’s t-test (B, I). See also Figure S4.
Figure 6.
Figure 6.. Genetic ablation of Ptgs2 in CD140a+ fibroblasts mitigates lung metastasis of breast cancer
(A) As depicted in the schematic (left), lung metastatic colonization in WT or Ptgs2ΔFb recipient mice was measured by ex vivo bioluminescent imaging (BLI). The primary tumor weight was also compared between the two recipient mice (n=9). (B) As depicted in the schematic (left), lung metastatic colonization was determined in WT or Ptgs2ΔFb mice treated with control or clodronate liposomes (n=9). (C and D) As depicted in the schematic (left), the percentage of AT3-mCherry cells was measured in WT or Ptgs2ΔFb mice (C) (n=10). Representative images were taken from (C) to show mCherry+ AT3 cells in lung sections (D). Scale bars, 25 μm. (E) Comparison of spontaneous lung metastases occurring in MMTV-PyMT Ptgs2ΔFb mice and their WT littermates (n=14). Representative histological lung sections stained with H&E are shown and arrowheads indicate metastatic lesions. Scale bars, 1mm. n is the number of biological replicates. Data are representative of at least two independent experiments (A-C, E) and shown as mean ± SEM. *p< 0.05, **p< 0.01; NS, not significant, by Mann-Whitney test (A-C, E). See also Figures S5 and S6.
Figure 7.
Figure 7.. Targeting COX-2-PGE2-EP2/EP4 pathway synergizes with DC vaccine or anti-PD-1 immunotherapy in controlling lung metastasis
(A) As depicted in the schematic (left), the effect of the single inhibition of EP2 or EP4, or dual inhibition of both receptors, in controlling lung metastatic colonization was determined (n=10). (B and C) As depicted in the schematic (left), the effect of dual inhibition of EP2 and EP4 in controlling spontaneous lung metastases was determined. Representative H&E images of lung sections are shown, and the number of lung metastatic nodules was counted (B) (n=10). Mammary tumor-specific Pymt mRNA level in the lungs was quantified (C) (n=9). (D and E) As depicted in their respective schematic (left), the combined effect of DC vaccine with host fibroblast Ptgs2 ablation (D) or dual inhibition of EP2 and EP4 (E) in treating lung metastatic colonization was determined. The frequency of OVA-specific CD8+ T cells in the blood was analyzed (middle) (n=6), and lung metastatic colonization was determined (right) (n=12 for D, and n=9-12 for E). (F and G) As depicted in their respective schematic (left), the combined effect of anti-PD-1 with host fibroblast Ptgs2 ablation (F) or dual inhibition of EP2 and EP4 (G) in treating lung metastatic colonization was determined (right) (n=10 for F, and n=12-13 for G). n is the number of biological replicates. Data are representative of at least three (A-C, F-G) or two (D-E) independent experiments and shown as mean ± SEM. *p< 0.05, **p< 0.01, ***p< 0.001; ****p< 0.0001; NS, not significant, by Mann-Whitney test (B-C, F) or one-way ANOVA (A, D-E, G). See also Figure S7.

Comment in

Similar articles

Cited by

References

    1. Altorki NK, Markowitz GJ, Gao D, Port JL, Saxena A, Stiles B, McGraw T, and Mittal V (2019). The lung microenvironment: an important regulator of tumour growth and metastasis. Nat Rev Cancer 19, 9–31. - PMC - PubMed
    1. Baharom F, Rankin G, Blomberg A, and Smed-Sorensen A (2017). Human Lung Mononuclear Phagocytes in Health and Disease. Front Immunol 8, 499. - PMC - PubMed
    1. Buechler MB, Pradhan RN, Krishnamurty AT, Cox C, Calviello AK, Wang AW, Yang YA, Tam L, Caothien R, Roose-Girma M, et al. (2021). Cross-tissue organization of the fibroblast lineage. Nature 593, 575–579. - PubMed
    1. Campeau E, Ruhl VE, Rodier F, Smith CL, Rahmberg BL, Fuss JO, Campisi J, Yaswen P, Cooper PK, and Kaufman PD (2009). A versatile viral system for expression and depletion of proteins in mammalian cells. PLoS One 4, e6529. - PMC - PubMed
    1. Coombes RC, Tovey H, Kilburn L, Mansi J, Palmieri C, Bartlett J, Hicks J, Makris A, Evans A, Loibl S, et al. (2021). Effect of Celecoxib vs Placebo as Adjuvant Therapy on Disease-Free Survival Among Patients With Breast Cancer: The REACT Randomized Clinical Trial. JAMA Oncol 7, 1291–1301. - PMC - PubMed

Publication types

MeSH terms

Substances