Mutant p53 drives an immune cold tumor immune microenvironment in oral squamous cell carcinoma
- PMID: 35902768
- PMCID: PMC9334280
- DOI: 10.1038/s42003-022-03675-4
Mutant p53 drives an immune cold tumor immune microenvironment in oral squamous cell carcinoma
Abstract
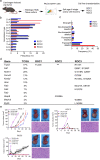
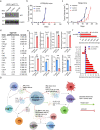
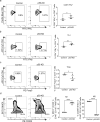
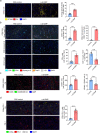
The critical role of the tumor immune microenvironment (TIME) in determining response to immune checkpoint inhibitor (ICI) therapy underscores the importance of understanding cancer cell-intrinsic mechanisms driving immune-excluded ("cold") TIMEs. One such cold tumor is oral cavity squamous cell carcinoma (OSCC), a tobacco-associated cancer with mutations in the TP53 gene which responds poorly to ICI therapy. Because altered TP53 function promotes tumor progression and plays a potential role in TIME modulation, here we developed a syngeneic OSCC models with defined Trp53 (p53) mutations and characterized their TIMEs and degree of ICI responsiveness. We observed that a carcinogen-induced p53 mutation promoted a cold TIME enriched with immunosuppressive M2 macrophages highly resistant to ICI therapy. p53-mutated cold tumors failed to respond to combination ICI treatment; however, the combination of a programmed cell death protein 1 (PD-1) inhibitor and stimulator of interferon genes (STING) agonist restored responsiveness. These syngeneic OSCC models can be used to gain insights into tumor cell-intrinsic drivers of immune resistance and to develop effective immunotherapeutic approaches for OSCC and other ICI-resistant solid tumors.
© 2022. The Author(s).
Conflict of interest statement
The authors declare no competing interests.
Figures


Similar articles
-
TP53 gain-of-function mutation modulates the immunosuppressive microenvironment in non-HPV-associated oral squamous cell carcinoma.J Immunother Cancer. 2023 Aug;11(8):e006666. doi: 10.1136/jitc-2023-006666. J Immunother Cancer. 2023. PMID: 37604640 Free PMC article.
-
NRF2 Activation in Trp53;p16-deficient Mice Drives Oral Squamous Cell Carcinoma.Cancer Res Commun. 2024 Feb 21;4(2):487-495. doi: 10.1158/2767-9764.CRC-23-0386. Cancer Res Commun. 2024. PMID: 38335300 Free PMC article.
-
Functionally impactful TP53 mutations are associated with increased risk of extranodal extension in clinically advanced oral squamous cell carcinoma.Cancer. 2020 Oct 15;126(20):4498-4510. doi: 10.1002/cncr.33101. Epub 2020 Aug 14. Cancer. 2020. PMID: 32797678
-
Targeting the DNA Damage Response in OSCC with TP53 Mutations.J Dent Res. 2018 Jun;97(6):635-644. doi: 10.1177/0022034518759068. Epub 2018 Feb 28. J Dent Res. 2018. PMID: 29489434 Free PMC article. Review.
-
ICI-based therapies: A new strategy for oral potentially malignant disorders.Oral Oncol. 2023 May;140:106388. doi: 10.1016/j.oraloncology.2023.106388. Epub 2023 Apr 11. Oral Oncol. 2023. PMID: 37054586 Review.
Cited by
-
Recent Advances on Mutant p53: Unveiling Novel Oncogenic Roles, Degradation Pathways, and Therapeutic Interventions.Biomolecules. 2024 May 31;14(6):649. doi: 10.3390/biom14060649. Biomolecules. 2024. PMID: 38927053 Free PMC article. Review.
-
Molecular basis, potential biomarkers, and future prospects of OSCC and PD-1/PD-L1 related immunotherapy methods.Heliyon. 2024 Feb 10;10(4):e25895. doi: 10.1016/j.heliyon.2024.e25895. eCollection 2024 Feb 29. Heliyon. 2024. PMID: 38380036 Free PMC article. Review.
-
p53 deficient breast cancer cells reprogram preadipocytes toward tumor-protective immunomodulatory cells.Proc Natl Acad Sci U S A. 2023 Dec 26;120(52):e2311460120. doi: 10.1073/pnas.2311460120. Epub 2023 Dec 21. Proc Natl Acad Sci U S A. 2023. PMID: 38127986 Free PMC article.
-
Biological biomarkers of oral cancer.Periodontol 2000. 2024 Oct;96(1):250-280. doi: 10.1111/prd.12542. Epub 2023 Dec 10. Periodontol 2000. 2024. PMID: 38073011 Free PMC article. Review.
-
Genetic alterations shape innate immune cells to foster immunosuppression and cancer immunotherapy resistance.Clin Exp Med. 2023 Dec;23(8):4289-4296. doi: 10.1007/s10238-023-01240-9. Epub 2023 Nov 1. Clin Exp Med. 2023. PMID: 37910258 Review.
References
-
- Califano J, et al. Genetic progression model for head and neck cancer: implications for field cancerization. Cancer Res. 1996;56:2488–2492. - PubMed
-
- Califano J, et al. Genetic progression and clonal relationship of recurrent premalignant head and neck lesions. Clin. Cancer Res. 2000;6:347–352. - PubMed
-
- Sung H, et al. Global Cancer Statistics 2020: GLOBOCAN estimates of incidence and mortality worldwide for 36 cancers in 185 countries. CA: Cancer J. Clin. 2021;71:209–249. - PubMed
Publication types
MeSH terms
Substances
Grants and funding
LinkOut - more resources
Full Text Sources
Medical
Molecular Biology Databases
Research Materials
Miscellaneous

