. 2022 Jul 28;13(1):4389.
doi: 10.1038/s41467-022-31828-w.

Topological digestion drives time-varying rheology of entangled DNA fluids

Affiliations

Topological digestion drives time-varying rheology of entangled DNA fluids

D Michieletto et al. Nat Commun. .

Abstract

Understanding and controlling the rheology of polymeric complex fluids that are pushed out-of-equilibrium is a fundamental problem in both industry and biology. For example, to package, repair, and replicate DNA, cells use enzymes to constantly manipulate DNA topology, length, and structure. Inspired by this feat, here we engineer and study DNA-based complex fluids that undergo enzymatically-driven topological and architectural alterations via restriction endonuclease (RE) reactions. We show that these systems display time-dependent rheological properties that depend on the concentrations and properties of the comprising DNA and REs. Through time-resolved microrheology experiments and Brownian Dynamics simulations, we show that conversion of supercoiled to linear DNA topology leads to a monotonic increase in viscosity. On the other hand, the viscosity of entangled linear DNA undergoing fragmentation displays a universal decrease that we rationalise using living polymer theory. Finally, to showcase the tunability of these behaviours, we design a DNA fluid that exhibits a time-dependent increase, followed by a temporally-gated decrease, of its viscosity. Our results present a class of polymeric fluids that leverage naturally occurring enzymes to drive diverse time-varying rheology by performing architectural alterations to the constituents.


Conflict of interest statement

The authors declare no competing interests.

Figures

Fig. 1
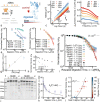
Fig. 1. RE-mediated linearisation drives an increase of viscosity of entangled fluids of circular DNA.
a Digestion of 5.9 kbp circular (supercoiled and ring) pYES2 by restriction enzyme BamHI triggers an irreversible architectural change from circular to linear topology. b Representative particle trajectories from microrheology in intact (control, red) and digested (blue) solutions. Shading from dark to light indicates increasing tracking time. Scale bar is 1 μm. c Mean-squared displacements (MSD) versus lag time t at different digestion times ta (shown in minutes in the legend) after the addition of BamHI to pYES2 fluids (see Supplementary Fig. 1). The arrow points in the direction of increasing digestion times ta. Black dotted and solid lines represent power-law scaling MSD ~ tα for free diffusion (α = 1) and subdiffusion (α < 1). d, e Normalised viscosity as a function of digestion time ta obtained from microrheology for DNA fluids with (d) varying RE:DNA stoichiometries at 3 mg/ml, and (e) varying DNA concentrations at fixed RE:DNA stoichiometry of 0.05 U/μg (see Supplementary Fig. 2 for control case with no RE). fh Time-resolved gel electrophoresis taken at different digestion times ta (listed in minutes above each lane). Border colours correspond to the associated data points. The gels display supercoiled (SC), ring (R) and linear (L) bands of equal DNA length. The marker (M) is the λ-HindIII ladder (see Supplementary Fig. 3 for the other gel images). i, j Fraction of linearised DNA versus ta for different RE stoichiometries (i) and DNA concentrations (j) as determined by quantitative analysis of the gels (see Supplementary Fig. 4). The solid lines are fits assuming Michaelis–Menten (MM) kinetics. k, l Normalised viscosity as a function of linearised DNA fraction ϕL. The viscosity grows as a function of ϕL irrespective of RE stoichiometry (k), while the growth rate depends on DNA concentrations (l). m Complex viscosity η*(ω) versus frequency ω during digestion of the highest concentration (6 mg/ml) DNA fluid. Error bars represent standard error.
Fig. 2
Fig. 2. Molecular Dynamics simulations rationalize the observed increase in viscosity during cutting of DNA plasmids.
a Simulation snapshot of entangled 6 kbp (M = 800 beads) DNA in which 90% of molecules are linearised (ϕL= 0.9, cut, light grey) and 10% (ϕL = 0.1) remain supercoiled (intact, dark grey). Boxed in is the same system in the simulation periodic box with a single uncut plasmid above it. b, c MSD of the centre-of-mass of the chains g3(t) as a function of lag time t for varying fractions of linearised DNA ϕL (listed in the legends and serving as a proxy for digestion time ta) in fluids that are (b) entangled (volume fraction Φ = 4% or Φ/Φ* ≃ 16 with Φ* = 0.26%) or (c) semidilute (volume fraction Φ = 0.24% ≃ Φ*). g3(t) and t are in simulation units equivalent to σ2 = 6.25 nm2 and τB ≃ 0.03 μs (see Methods). d Diffusion coefficients D determined as D=limtg3(t)/6t and normalised by the corresponding value at ta = 0 (D0) for entangled and semidilute fluids, showing a monotonic slowing down with increasing linearised fraction ϕL. Higher DNA concentration results in a stronger decrease in mobility with increasing ϕL, similar to experiments. e, f Snapshot of simulated chains before and after being cut, showing examples of long-lived coiled conformations in entangled (e) and semidilute (f) conditions. Notice that chains display an initial reduction in conformational size followed by an expansion as the polymer relaxes to steady-state. g Radius of gyration Rg=Rg21/2=1/NiNrirCM21/2 and h end-to-end distance Ree=Ree21/2=r1rN21/2 averaged over all (cut and intact) rings in the system. i Diffusion coefficients D/D0 plotted against average end-to-end distance Ree measured at large simulation times showing a direct correlation between slower dynamics and larger coil sizes that is stronger for higher DNA concentrations, as seen in experiments.
Fig. 3
Fig. 3. Mapping changes of topology and conformational size onto fluid viscosity.
a Normalised diffusion coefficients D/D0 versus fraction of linearised DNA ϕL, as measured via microrheology (coloured data points) and MD simulations (black data points), show slowing of DNA mobility with increasing ϕL that is stronger for higher DNA concentrations. The discrepancy between experiments and simulations may be due to the fact that experiments have a population of relaxed ring DNA not present in simulations, which may be more prone to threadings. b Data shown in a plotted against the average radius of gyration 〈Rg〉 measured in experiments (colours) and simulations (black), demonstrating that the decrease in mobility correlates with increased conformational size and that the slowing is more pronounced at higher DNA concentrations. c Experimentally measured normalised viscosity η/η0 plotted against DNA concentration c, normalised by the overlap concentration c*. Dotted and solid lines show scaling relations η/η0~(c/c*)γ with γ values corresponding to Rouse-like diffusion of semidilute polymers (γ = 0.5), reptation of entangled polymers (γ = 1.75), and constraint release of threaded circular polymers (γ = 3),. d Cartoon depiction of increased viscosity caused by weakly entangled supercoiled polymers being cut by REs to form heavily entangled linear chains due to increasing 〈Rg〉 and lowering c*.
Fig. 4
Fig. 4. Solutions of entangled linear λ-DNA undergoing digestion display a universal decrease in viscosity.
a Digestion of linear λ-DNA (48.5 kbp) into smaller fragments via a multi-cutter RE HindIII. b Representative trajectories from microrheology in inactive (control, red) and digested (blue) solutions. Shading from dark to light indicates increasing tracking time. Scale bar is 1 μm. c Mean-squared displacements (MSD) versus lag time t at different digestion times ta (shown in minutes in the legend) after the addition of 1.1 U/μg of HindIII. Black dotted and solid lines represent power-law scaling MSD ~ tα, with corresponding scaling exponents listed. d The complex viscosity η*(ω) at different digestion times displays a shear-thinning behaviour that weakens at long digestion times. e, f Viscosity during digestion time as a function of (e) different RE (BamHI) concentrations (listed as RE:DNA stoichiometry in the legend) and (f) different RE (fixed stoichiometry 1.1 U/μg) (See Supplementary Table 1 for more information on REs). g By fitting the data shown in e, f with (1 + κt)−3 (see Eq. (2)), we find the digestion rate to be a linear function of the RE concentration, i.e., κ=a[RE]. h Data from the Smith and Welcox paper where they discover HindII in 1970. The legend lists the concentration of Heamophilus Influenzae lysate. i By rescaling digestion time as taa[RE]ta with a an RE-independent constant, all data collapse onto a master curve predicted by Eq. (2). j Time-resolved agarose gel electrophoresis showing digestion of entangled λ-DNA by HindIII. Digestion time ta (in mins) is listed above each lane and M denotes lanes with the λ-HindIII marker. k We quantify the bands intensity to obtain the average fragment length 〈lf〉 as a function of digestion time ta. Solid line is a fit of the data to the predicted scaling L0/(1 + κt). l We correlate fluid rheology to DNA architecture by plotting η/η0 measured for samples digested with HindIII at 1.1 U/μg with 〈lf〉 extracted from the gel. The solid line is the theoretical predicted trend η/η0=lf3. Error bars represent standard error.
Fig. 5
Fig. 5. Time-dependent and non-monotonic rheology of entangled DNA fluids.
a Our fluid comprises 44 kbp circular DNA (IE241) and two different REs that cut the DNA twice (XhoI) or 10 times (EcoRI). The green ramp indicates that we vary the concentration of EcoRI while keeping the DNA and XhoI concentrations fixed. b Normalised viscosity versus digestion time for solutions of 1.4 mg/ml circular DNA undergoing architectural conversion by a fixed concentration of XhoI (0.84 U/μg) and five different EcoRI concentrations (listed in the legend). Fluids exhibit initial rise in viscosity, due to XhoI-driven linearisation of the circular DNA, followed by a decrease, due to fragmentation by EcoRI. The maximum increase in viscosity, ηmax/η0, and time at which the viscosity starts to decrease, i.e., the gating time Tgate, is dependent on the stoichiometry of the REs. c Data shown in (b) for the three lowest EcoRI concentrations, zoomed-in and plotted on log-x scale to more clearly show [EcoRI]-dependent behaviour and the gating time. d The gating time, which we define as Tgate=argmaxη/η0, e the maximum increase in viscosity, defined as ηmax/η0, and f the maximum decrease in viscosity, i.e., η0/ηmin, appear to scale with [EcoRI] as power laws, with approximate exponents − 0.47, − 0.26 and 0.75, respectively. g The maximum viscosity scales nearly linearly with gating time, i.e., ηmax/η0~Tgate0.95, while h it appears to decrease with increased viscosity reduction, as ηmax/η0~(η0/ηmin)0.47.

Similar articles

Cited by

References

    1. Calladine, C. R., Drew, H. R., Luisi, B. F. & Travers, A. A. Understanding DNA: the Molecule and How It Works. 3rd edn (Elsevier Academic Press, 2004).
    1. Bates, A. & Maxwell, A. DNA Topology (Oxford University Press, 2005).
    1. Jinek M, et al. A programmable dual-RNA-guided DNA endonuclease in adaptive bacterial immunity. Science. 2012;337:816–821. doi: 10.1126/science.1225829. - DOI - PMC - PubMed
    1. Pingoud A, Wilson GG, Wende W. Type II restriction endonucleases—a historical perspective and more. Nucleic Acids Res. 2014;42:7489–7527. doi: 10.1093/nar/gku447. - DOI - PMC - PubMed
    1. Kundukad B, Van Der Maarel JR. Control of the flow properties of DNA by topoisomerase II and its targeting inhibitor. Biophys. J. 2010;99:1906–1915. doi: 10.1016/j.bpj.2010.07.013. - DOI - PMC - PubMed

Publication types