. 2022 Jul 8;8(4):51.
doi: 10.3390/ncrna8040051.

Pan-Cancer Analysis Reveals the Prognostic Potential of the THAP9/THAP9-AS1 Sense-Antisense Gene Pair in Human Cancers

Affiliations

Pan-Cancer Analysis Reveals the Prognostic Potential of the THAP9/THAP9-AS1 Sense-Antisense Gene Pair in Human Cancers

Richa Rashmi et al. Noncoding RNA. .

Abstract

Human THAP9, which encodes a domesticated transposase of unknown function, and lncRNA THAP9-AS1 (THAP9-antisense1) are arranged head-to-head on opposite DNA strands, forming a sense and antisense gene pair. We predict that there is a bidirectional promoter that potentially regulates the expression of THAP9 and THAP9-AS1. Although both THAP9 and THAP9-AS1 are reported to be involved in various cancers, their correlative roles on each other's expression has not been explored. We analyzed the expression levels, prognosis, and predicted biological functions of the two genes across different cancer datasets (TCGA, GTEx). We observed that although the expression levels of the two genes, THAP9 and THAP9-AS1, varied in different tumors, the expression of the gene pair was strongly correlated with patient prognosis; higher expression of the gene pair was usually linked to poor overall and disease-free survival. Thus, THAP9 and THAP9-AS1 may serve as potential clinical biomarkers of tumor prognosis. Further, we performed a gene co-expression analysis (using WGCNA) followed by a differential gene correlation analysis (DGCA) across 22 cancers to identify genes that share the expression pattern of THAP9 and THAP9-AS1. Interestingly, in both normal and cancer samples, THAP9 and THAP9-AS1 often co-express; moreover, their expression is positively correlated in each cancer type, suggesting the coordinated regulation of this H2H gene pair.

Keywords: TCGA; THAP9; THAP9-AS1; co-expression; guilt-by-association; head-to-head genes; pan-cancer; survival.


Conflict of interest statement

The authors declare no conflict of interest.

Figures

Figure 1
Figure 1
Identification of putative bidirectional THAP9/THAP9-AS1 promoter. (a) Schematic representation of the bidirectional genomic organization of THAP9 and THAP9-AS1 genes along with the TSS predicted by EPDnew. (b) UCSC genome browser showing THAP9 and THAP9-AS1 genes transcribed divergently based on the human GRCh38 assembly. CpG islands overlapping with the bidirectional promoter region are also indicated.
Figure 2
Figure 2
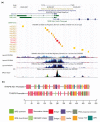
Characterization of THAP9/THAP9-AS1 putative bidirectional promoter region. (a) UCSC genome browser representing ENCODE data for THAP9/THAP9-AS1 bidirectional promoter region. The genomic region contains the putative bidirectional promoter region of the THAP9/THAP9-AS1 gene pair. The GENCODE genes track shows transcript variants for both genes. Below that is the ENCODE candidate cis-regulatory elements (cCREs) track, which shows the presence of several regulatory elements in the promoter region. The next three tracks are from ENCODE showing the H3K4Me1, H3K4Me3 and H3K27Ac marks followed by the DNAse I hypersensitivity signal shown in the last track (b) Schematic representation of the core promoter elements predicted by ElemeNT. The core promoter sequence used was −250 to +250 relative to the TSS of THAP9 and −400 to +100 for THAP9-AS1 (considering 82900569 as TSS) from EPDnew. The diagram is roughly to scale and was constructed using TBtools [43].
Figure 3
Figure 3
Genome Variation Viewer view of rs897945, which yields a G → T nucleotide substitution that leads to a Leu-to-Phe amino acid change at position 299 located on the Tnp_P_element (Pfam ID: PF12017) domain in hTHAP9 protein.
Figure 4
Figure 4
Mutations of THAP9 and THAP9-AS1 in different cancers in TCGA. The alteration frequencies with mutation type for (a) THAP9 and (d) THAP9-AS1, where the X-axis represents the type of alteration (red—amplification; blue—deep deletion; green—mutation) and the Y-axis represents the frequency of the alteration in different cancers. Correlation between mutation status and overall survival of cancer patients in (b) THAP9 and (e) THAP9-AS1. The red line shows the overall survival estimates for patients with an alteration in the gene as compared to patients with no alteration (blue line). Survival analysis significance was based on the log-rank test. Note: p < 0.05 was considered significant. (c) Mutation sites in THAP9 (refer to Supplementary Table S3 for details).
Figure 5
Figure 5
THAP9 gene expression levels in different tumors. THAP9 expression levels in human tumors (red) and corresponding normal tissues (blue) were obtained through TIMER2. The statistical significance computed by the Wilcoxon test is annotated by the number of stars (*: p-value < 0.05; **: p-value < 0.01; ***: p-value < 0.001).
Figure 6
Figure 6
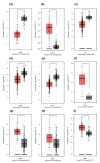
Box plot representation of the comparative expression levels of THAP9 (a,b) and THAP9-AS1 (ci) in different tumor samples (red) vs. normal tissue samples (grey) from TCGA and GTEx generated using GEPIA2. Note: * p < 0.01. GEPIA2 uses one-way ANOVA, taking the pathological stage (X-axis) as the variable for performing differential expression of the input gene. The expression data used for the analysis was log2(TPM+1) (Y-axis)-transformed. (a) THAP9 is downregulated in TGCT and (b) upregulated in THYM. (ce) THAP9-AS1 is downregulated in OV, SKCM, and THCA and (fi) upregulated in CHOL, THYM, DLBC, and PAAD (* p < 0.05).
Figure 7
Figure 7
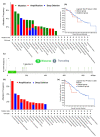
Overall patient survival analysis using GEPIA2. (a) The relationship between THAP9 and THAP9-AS1 gene expression and the overall survival prognosis of cancers in TCGA. Median was selected as a threshold for separating high-expression and low-expression cohorts. The red and blue blocks represent higher and lower risks, respectively, with an increase in gene expression. The bounding boxes depict the significant (p < 0.05) unfavorable and favorable results, respectively. The overall survival and gene expression rates (from TCGA) of (b) THAP9 in HNSC, KIRC, LGG, and STAD; and of (c) THAP9-AS1 in ACC, LGG, PRAD, SARC, and THCA.
Figure 8
Figure 8
Disease-free survival analysis using GEPIA2. (a) The relationship between THAP9 and THAP9-AS1 gene expression and the disease-free survival prognosis of cancers in TCGA. The median was selected as a threshold for separating high-expression and low-expression cohorts. The red and blue blocks represent higher and lower risks, respectively, with an increase in the gene expression. The bounding boxes depict the significant (p < 0.05) unfavorable and favorable results, respectively. The disease-free survival and gene expression rates of (b) THAP9 in BLCA, CESC, KIRC, and THYM; and of (c) THAP9-AS1 in ACC, KICH, KIRC, and MESO.
Figure 9
Figure 9
Consensus of genes co-expressed with THAP9 and THAP9-AS1. Word cloud of top 20 genes frequently co-expressed with: (1st row) THAP9 in all combined normal (top-left) vs. tumor (top-right) samples; (2nd row) THAP9-AS1 in combined normal (bottom-left) vs. tumor (bottom-right) samples. The co-expressing genes were identified using the WGCNA Bioconductor package and plotted using the Wordcloud python package. The height of a word is directly proportional to the frequency of co-expression with THAP9. The top 20 co-expressed genes are plotted only for representation purposes; details of the full gene cluster associated with THAP9 and THAP9-AS1 in each cancer type (normal and tumor tissues separately) are available in Supplementary Tables S8 and S9.
Figure 10
Figure 10
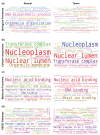
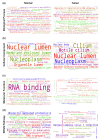
Gene Ontology (GO) and KEGG pathway analyses of genes co-expressed with THAP9 in normal vs. tumor samples. The enrichment test was performed for normal vs. tumor samples (for each cancer) using the ShinyGO for the top 10 enriched terms, with the significance cutoff for adjusted p-values bring set at 0.05. The font sizes in the word cloud are proportional to their frequency after the enrichment rates were merged for all cancers (left side for normal samples and right side for tumor samples). Word clouds of enriched GO terms in (a) the biological process category, (b) cellular component category, (c) molecular functions category, and (d) KEGG pathways.
Figure 11
Figure 11
Gene ontology (GO) and KEGG pathway analyses of genes co-expressed with THAP9-AS1 in normal vs. tumor samples. The enrichment test was performed for normal vs. tumor samples (for each cancer) using ShinyGO for the top 10 enriched terms, with the significance cutoff for adjusted p-values being set at 0.05. The font sizes in the word cloud are proportional to their frequency after the enrichment rates were merged for all cancers (left side for normal samples and right side for tumor samples). Word clouds of enriched GO terms in (a) the biological process category, (b) cellular component category, (c) molecular functions category, and (d) KEGG pathways.
Figure 12
Figure 12
Gene Ontology analysis of genes differentially correlated with THAP9 in normal vs. tumor samples (top—genes that gained a correlation with THAP9; bottom—genes that lost a correlation with THAP9). Word clouds of enriched (a) GO biological process, (b) GO cellular component, and (c) GO molecular functions. The differential gene correlation analysis, followed by the gene ontology analysis for the differentially correlated genes, was performed using the DGCA package in R.
Figure 13
Figure 13
Gene Ontology analysis of genes differentially correlated with THAP9-AS1 in normal vs. tumor samples (top—genes that gained correlation with THAP9-AS1; bottom—genes that lost correlation with THAP9). Word clouds of enriched (a) GO biological process, (b) GO cellular component, and (c) GO molecular functions. The differential gene correlation analysis, followed by the gene ontology analysis for the differentially correlated genes, was performed using the DGCA package in R.

Similar articles

References

    1. Hurst L.D., Pál C., Lercher M.J. The evolutionary dynamics of eukaryotic gene order. Nat. Rev. Genet. 2004;5:299–310. doi: 10.1038/nrg1319. - DOI - PubMed
    1. Adachi N., Lieber M.R. Bidirectional Gene Organization: A Common Architectural Feature of the Human Genome. Cell. 2002;109:807–809. doi: 10.1016/S0092-8674(02)00758-4. - DOI - PubMed
    1. Li Y.-Y., Yu H., Guo Z.-M., Guo T.-Q., Tu K., Li Y.-X. Systematic Analysis of Head-to-Head Gene Organization: Evolutionary Conservation and Potential Biological Relevance. PLoS Comput. Biol. 2006;2:e74. doi: 10.1371/journal.pcbi.0020074. - DOI - PMC - PubMed
    1. Trinklein N.D., Aldred S.F., Hartman S.J., Schroeder D.I., Otillar R.P., Myers R.M. An Abundance of Bidirectional Promoters in the Human Genome. Genome Res. 2004;14:62–66. doi: 10.1101/gr.1982804. - DOI - PMC - PubMed
    1. Burbelo P.D., Martin G.R., Yamada Y. Alpha 1(IV) and alpha 2(IV) collagen genes are regulated by a bidirectional promoter and a shared enhancer. Proc. Natl. Acad. Sci. USA. 1988;85:9679–9682. doi: 10.1073/pnas.85.24.9679. - DOI - PMC - PubMed

LinkOut - more resources