

A comprehensive analysis of ncRNA-mediated interactions reveals potential prognostic biomarkers in prostate adenocarcinoma
- PMID: 35891787
- PMCID: PMC9307580
- DOI: 10.1016/j.csbj.2022.07.020
A comprehensive analysis of ncRNA-mediated interactions reveals potential prognostic biomarkers in prostate adenocarcinoma
Abstract
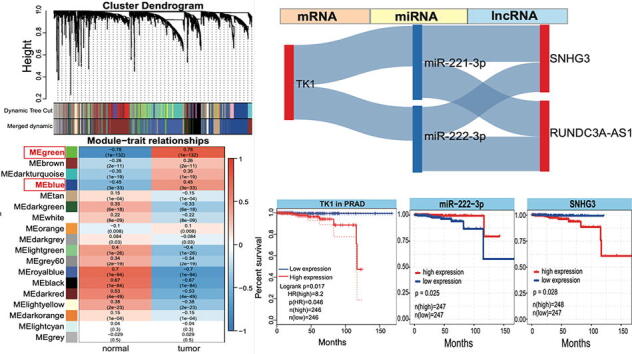
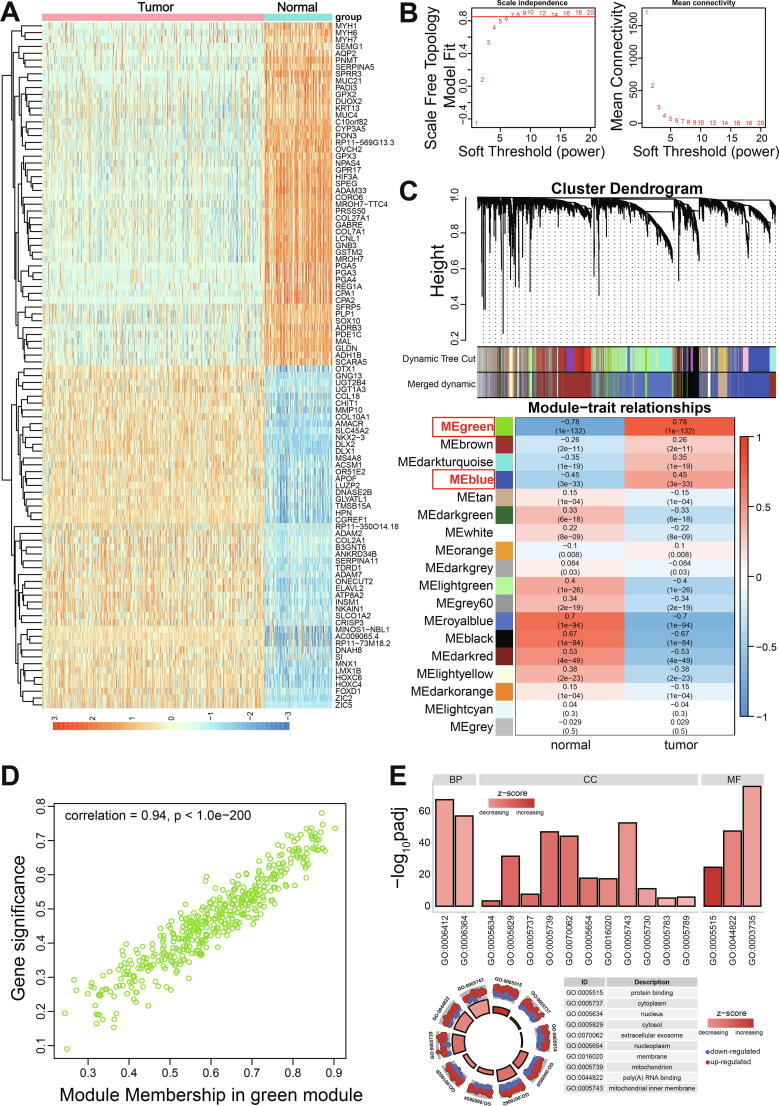
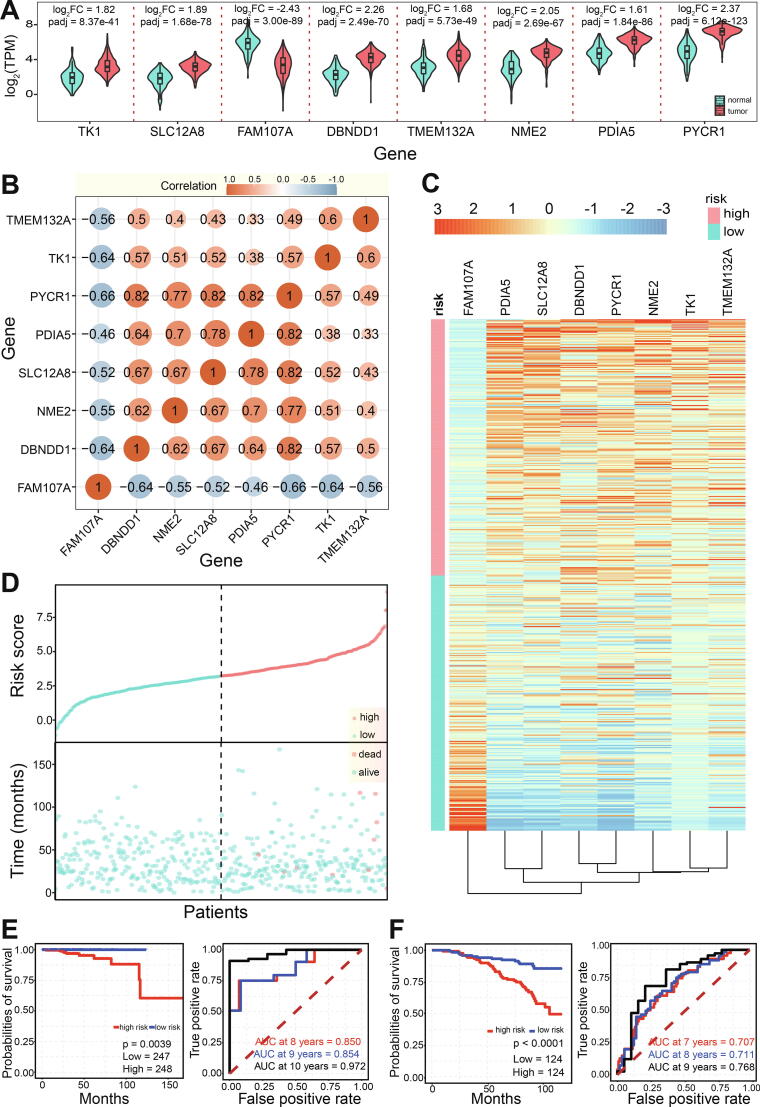
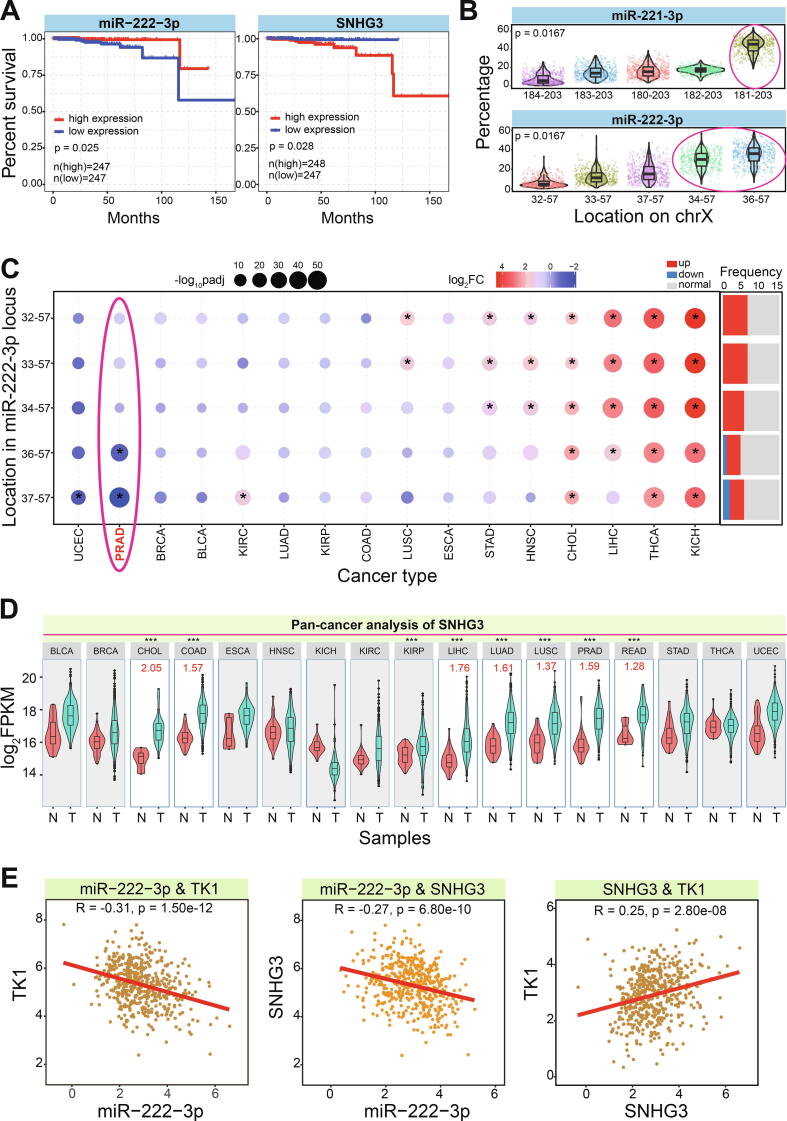
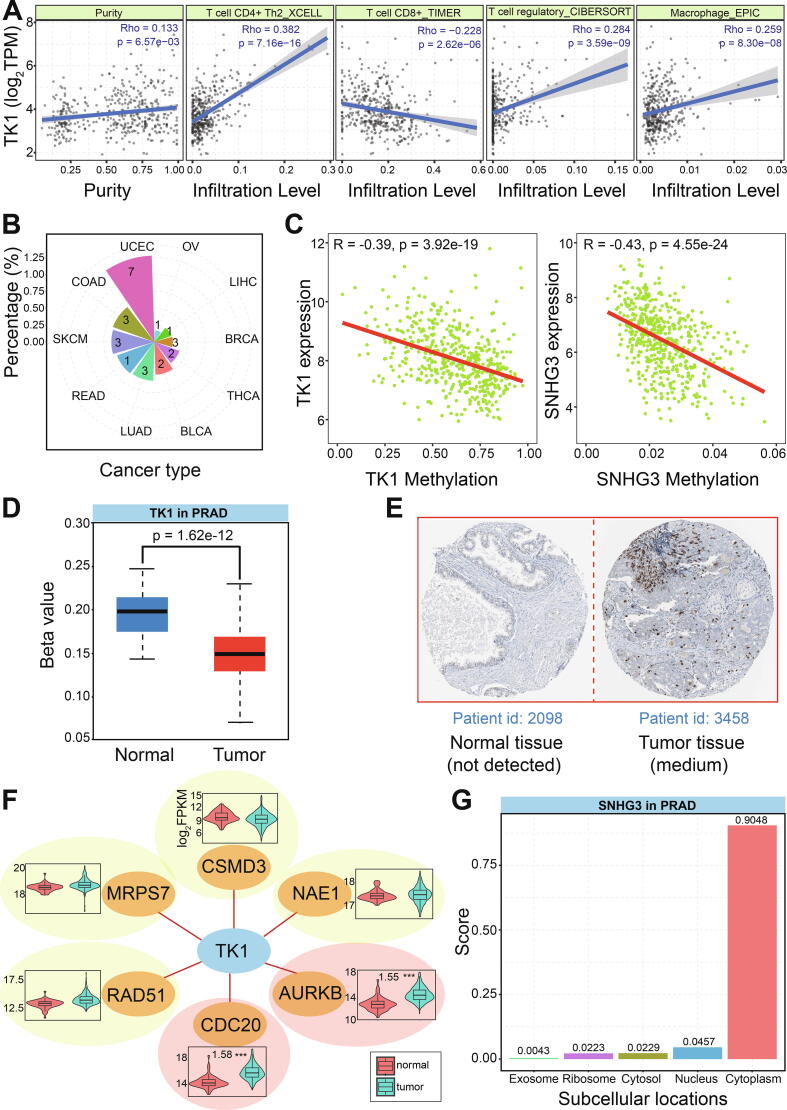
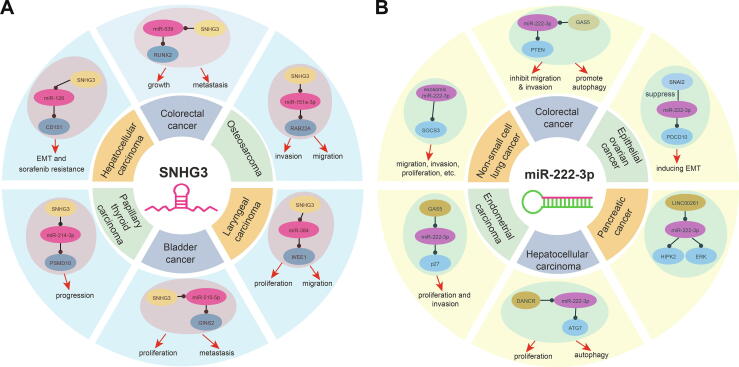
As one of common malignancies, prostate adenocarcinoma (PRAD) has been a growing health problem and a leading cause of cancer-related death. To obtain expression and functional relevant RNAs, we firstly screened candidate hub mRNAs and characterized their associations with cancer. Eight deregulated genes were identified and used to build a risk model (AUC was 0.972 at 10 years) that may be a specific biomarker for cancer prognosis. Then, relevant miRNAs and lncRNAs were screened, and the constructed primarily interaction networks showed the potential cross-talks among diverse RNAs. IsomiR landscapes were surveyed to understand the detailed isomiRs in relevant homologous miRNA loci, which largely enriched RNA interaction network due to diversities of sequence and expression. We finally characterized TK1, miR-222-3p and SNHG3 as crucial RNAs, and the abnormal expression patterns of them were correlated with poor survival outcomes. TK1 was found synthetic lethal interactions with other genes, implicating potential therapeutic target in precision medicine. LncRNA SNHG3 can sponge miR-222-3p to perturb RNA regulatory network and TK1 expression. These results demonstrate that TK1:miR-222-3p:SNHG3 axis may be a potential prognostic biomarker, which will contribute to further understanding cancer pathophysiology and providing potential therapeutic targets in precision medicine.
Keywords: Cross-talk; Prognostic biomarker; Prostate adenocarcinoma (PRAD); Weighted gene co-expression analysis (WGCNA); ceRNA network.
© 2022 The Author(s).
Conflict of interest statement
The authors declare that they have no known competing financial interests or personal relationships that could have appeared to influence the work reported in this paper.
Figures

Similar articles
-
Protein profiling reveals potential isomiR-associated cross-talks among RNAs in cholangiocarcinoma.Comput Struct Biotechnol J. 2021 Oct 14;19:5722-5734. doi: 10.1016/j.csbj.2021.10.014. eCollection 2021. Comput Struct Biotechnol J. 2021. PMID: 34745457 Free PMC article.
-
Characterization of Cell Cycle-Related Competing Endogenous RNAs Using Robust Rank Aggregation as Prognostic Biomarker in Lung Adenocarcinoma.Front Oncol. 2022 Feb 3;12:807367. doi: 10.3389/fonc.2022.807367. eCollection 2022. Front Oncol. 2022. PMID: 35186743 Free PMC article.
-
Comprehensive Analysis of Aberrantly Expressed Profiles of lncRNAs and miRNAs with Associated ceRNA Network in Lung Adenocarcinoma and Lung Squamous Cell Carcinoma.Pathol Oncol Res. 2020 Jul;26(3):1935-1945. doi: 10.1007/s12253-019-00780-4. Epub 2020 Jan 2. Pathol Oncol Res. 2020. PMID: 31898160
-
A novel lncRNA-miRNA-mRNA competitive endogenous RNA network for uveal melanoma prognosis constructed by weighted gene co-expression network analysis.Life Sci. 2020 Nov 1;260:118409. doi: 10.1016/j.lfs.2020.118409. Epub 2020 Sep 11. Life Sci. 2020. PMID: 32926921
-
Identification of MFI2-AS1, a Novel Pivotal lncRNA for Prognosis of Stage III/IV Colorectal Cancer.Dig Dis Sci. 2020 Dec;65(12):3538-3550. doi: 10.1007/s10620-020-06064-1. Epub 2020 Jan 20. Dig Dis Sci. 2020. PMID: 31960204 Review.
Cited by
-
A lncRNA-disease association prediction model based on the two-step PU learning and fully connected neural networks.Heliyon. 2023 Jun 28;9(7):e17726. doi: 10.1016/j.heliyon.2023.e17726. eCollection 2023 Jul. Heliyon. 2023. PMID: 37539215 Free PMC article.
References
-
- Siegel R.L., Miller K.D., Jemal A. Cancer statistics, 2019. CA Cancer J Clin. 2019;69(1):7–34. - PubMed
-
- Siegel R.L., Miller K.D., Jemal A. Cancer statistics, 2016. CA Cancer J Clin. 2016;66(1):7–30. - PubMed
-
- Mottet N., van den Bergh R.C.N., Briers E., Van den Broeck T., Cumberbatch M.G., De Santis M., et al. EAU-EANM-ESTRO-ESUR-SIOG Guidelines on Prostate Cancer-2020 Update. Part 1: Screening, Diagnosis, and Local Treatment with Curative Intent. Eur Urol. 2021;79(2):243–262. - PubMed
LinkOut - more resources
Full Text Sources
Research Materials