

Fertilizers and Fertilization Strategies Mitigating Soil Factors Constraining Efficiency of Nitrogen in Plant Production
- PMID: 35890489
- PMCID: PMC9319167
- DOI: 10.3390/plants11141855
Fertilizers and Fertilization Strategies Mitigating Soil Factors Constraining Efficiency of Nitrogen in Plant Production
Abstract
Fertilizer Use Efficiency (FUE) is a measure of the potential of an applied fertilizer to increase its impact on the uptake and utilization of nitrogen (N) present in the soil/plant system. The productivity of N depends on the supply of those nutrients in a well-defined stage of yield formation that are decisive for its uptake and utilization. Traditionally, plant nutritional status is evaluated by using chemical methods. However, nowadays, to correct fertilizer doses, the absorption and reflection of solar radiation is used. Fertilization efficiency can be increased not only by adjusting the fertilizer dose to the plant's requirements, but also by removing all of the soil factors that constrain nutrient uptake and their transport from soil to root surface. Among them, soil compaction and pH are relatively easy to correct. The goal of new the formulas of N fertilizers is to increase the availability of N by synchronization of its release with the plant demand. The aim of non-nitrogenous fertilizers is to increase the availability of nutrients that control the effectiveness of N present in the soil/plant system. A wide range of actions is required to reduce the amount of N which can pollute ecosystems adjacent to fields.
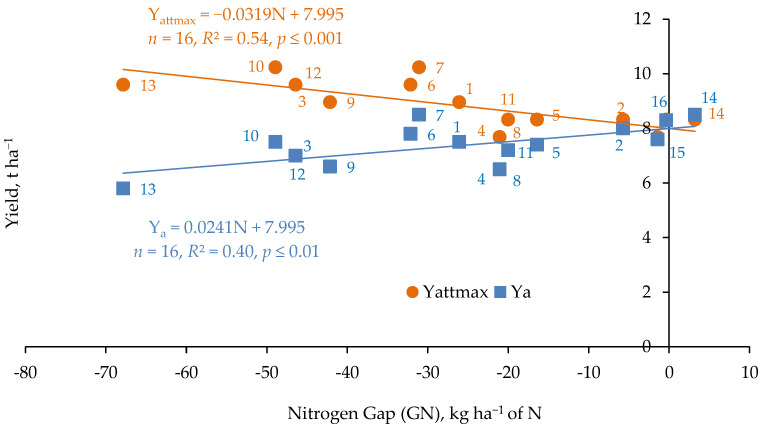
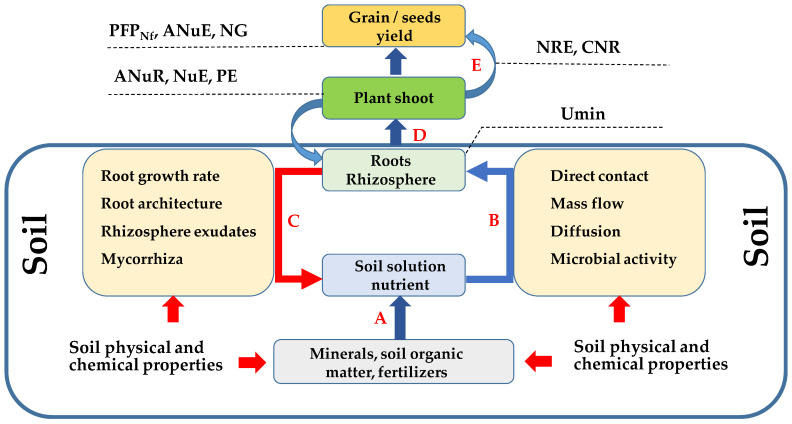
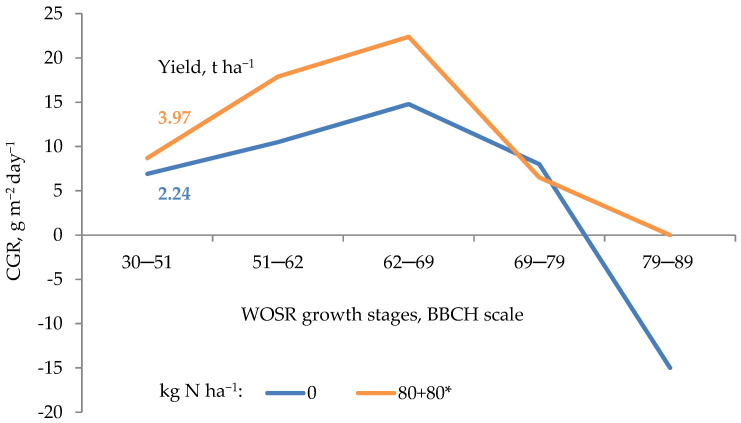
Keywords: crop growth rate; fertilizer market; nitrogen gap; nitrogen use efficiency; nutrient uptake; partial factor productivity; root architecture.
Conflict of interest statement
The authors declare no conflict of interest.
Figures
Similar articles
-
Improving Fertilizer Use Efficiency-Methods and Strategies for the Future.Plants (Basel). 2023 Oct 23;12(20):3658. doi: 10.3390/plants12203658. Plants (Basel). 2023. PMID: 37896121 Free PMC article.
-
Development of fertilizers for enhanced nitrogen use efficiency - Trends and perspectives.Sci Total Environ. 2020 Aug 20;731:139113. doi: 10.1016/j.scitotenv.2020.139113. Epub 2020 May 5. Sci Total Environ. 2020. PMID: 32438083 Review.
-
[Application effects of fertilizer recommendation by Nutrient Expert System on radish].Ying Yong Sheng Tai Xue Bao. 2020 Nov;31(11):3719-3728. doi: 10.13287/j.1001-9332.202011.022. Ying Yong Sheng Tai Xue Bao. 2020. PMID: 33300722 Chinese.
-
Nitrogen and potassium application effects on productivity, profitability and nutrient use efficiency of irrigated wheat (Triticum aestivum L.).PLoS One. 2022 May 24;17(5):e0264210. doi: 10.1371/journal.pone.0264210. eCollection 2022. PLoS One. 2022. PMID: 35609063 Free PMC article.
-
A comprehensive review on enhancing nutrient use efficiency and productivity of broadacre (arable) crops with the combined utilization of compost and fertilizers.J Environ Manage. 2022 Sep 1;317:115395. doi: 10.1016/j.jenvman.2022.115395. Epub 2022 Jun 6. J Environ Manage. 2022. PMID: 35751241 Review.
Cited by
-
Improving Fertilizer Use Efficiency-Methods and Strategies for the Future.Plants (Basel). 2023 Oct 23;12(20):3658. doi: 10.3390/plants12203658. Plants (Basel). 2023. PMID: 37896121 Free PMC article.
-
Responses of soil enzymatic activities and microbial biomass phosphorus to improve nutrient accumulation abilities in leguminous species.Sci Rep. 2024 May 15;14(1):11139. doi: 10.1038/s41598-024-61446-z. Sci Rep. 2024. PMID: 38750151 Free PMC article.
-
Soil Fertility Clock-Crop Rotation as a Paradigm in Nitrogen Fertilizer Productivity Control.Plants (Basel). 2022 Oct 25;11(21):2841. doi: 10.3390/plants11212841. Plants (Basel). 2022. PMID: 36365294 Free PMC article. Review.
References
-
- Licker R., Johnston M., Foley J.A., Barford C., Kucharik C.J., Monfreda C., Ramankutty N. Mind the gap: How do climate and agricultural management explain the ‘yield gap’ of croplands around the world? Glob. Ecol. Biogeogr. 2010;19:769–782. doi: 10.1111/j.1466-8238.2010.00563.x. - DOI
-
- Tandzi N.L., Mutengwa S.C. Factors affecting yields of crops. In: Amanullah, editor. Agronomy—Climate Change and Food Security. IntechOpen; London, UK: 2020. p. 16.
-
- Sattari S.Z., Van Ittersum M.K., Bouwman A.F., Smit A.L., Janssen B.H. Crop yield response to soil fertility and N, P, K inputs in different environments: Testing and improving the QEFTS model. Field Crops Res. 2014;157:35–46. doi: 10.1016/j.fcr.2013.12.005. - DOI
-
- Lollato R.P., Edwards J.T. Maximum attainable wheat yield and resources-use efficiency in the Southern Great Plains. Crop Sci. 2015;55:2863–2875. doi: 10.2135/cropsci2015.04.0215. - DOI
-
- Wallace A., Wallace G.A. Closing the Crop-Yield Gap through Better Soil and Better Management. Wallace Laboratories; Los Angeles, CA, USA: 2003. p. 162.
Publication types
Grants and funding
LinkOut - more resources
Full Text Sources
Miscellaneous
