. 2022 Jun 21;13(7):1107.
doi: 10.3390/genes13071107.

Mutation of foxl1 Results in Reduced Cartilage Markers in a Zebrafish Model of Otosclerosis

Affiliations

Mutation of foxl1 Results in Reduced Cartilage Markers in a Zebrafish Model of Otosclerosis

Alexia Hawkey-Noble et al. Genes (Basel). .

Abstract

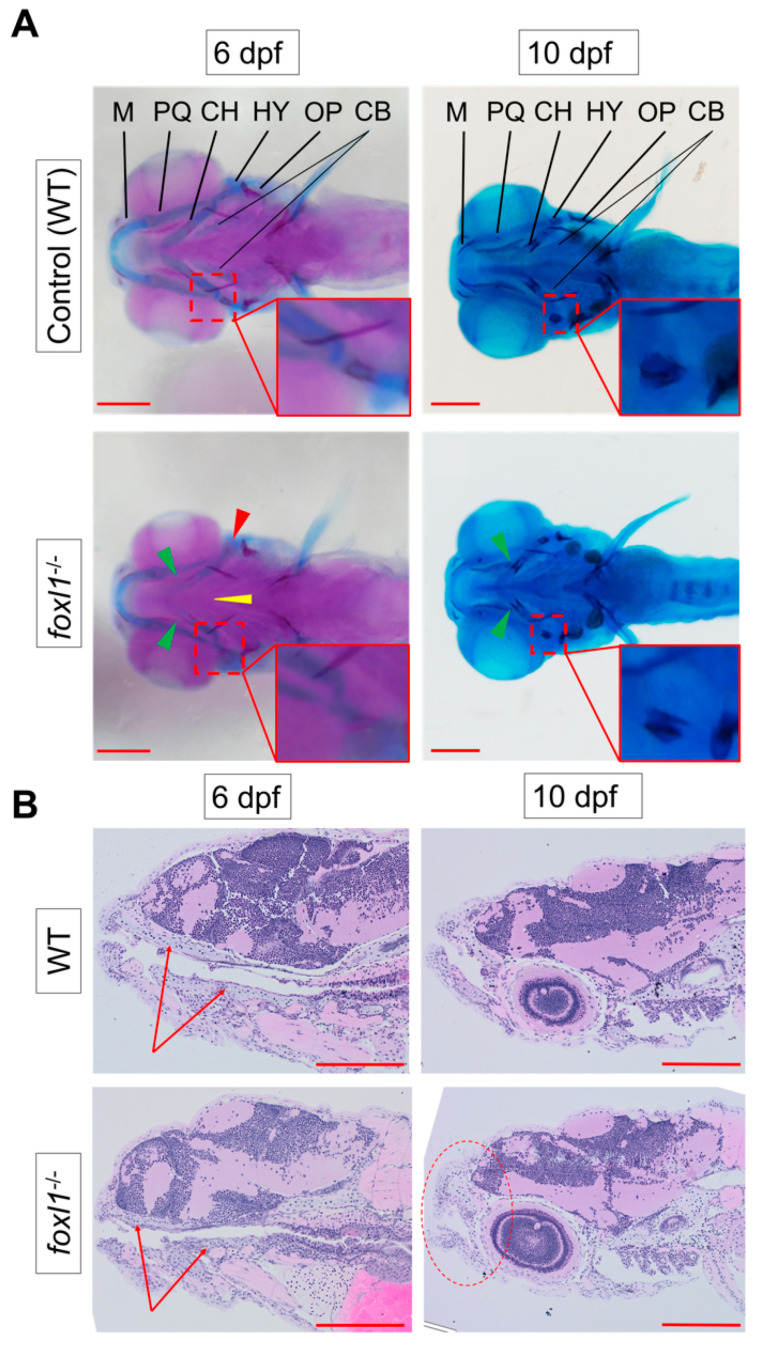
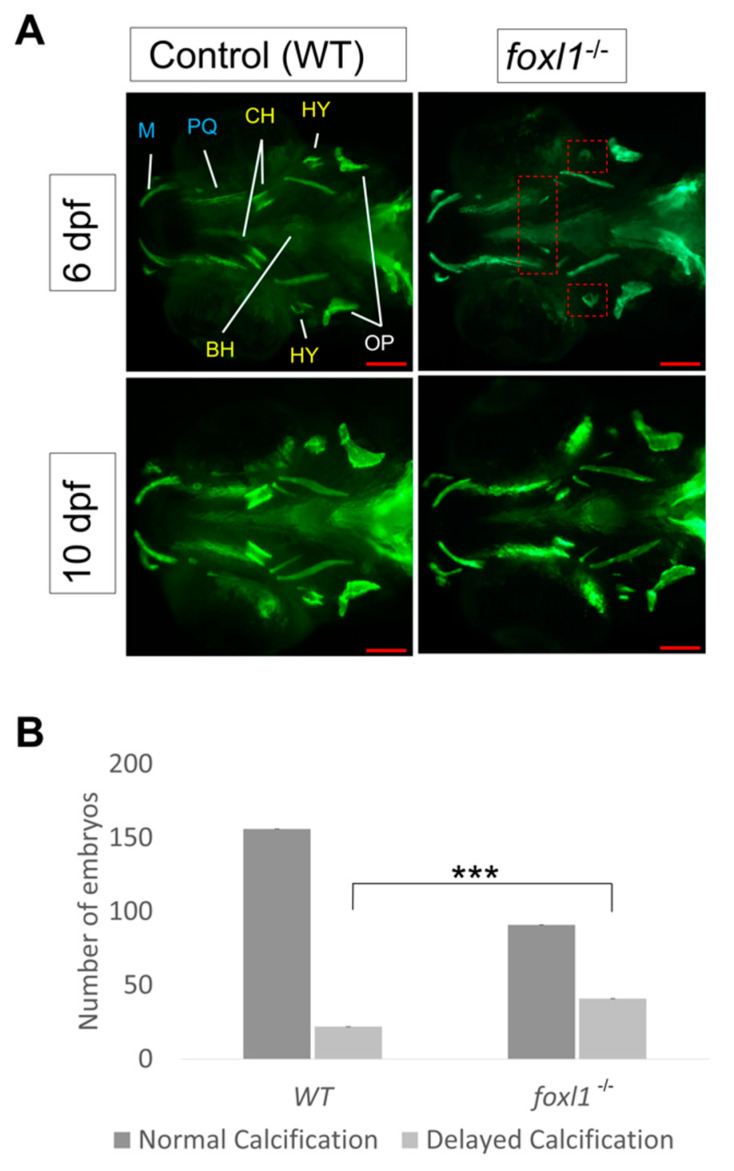
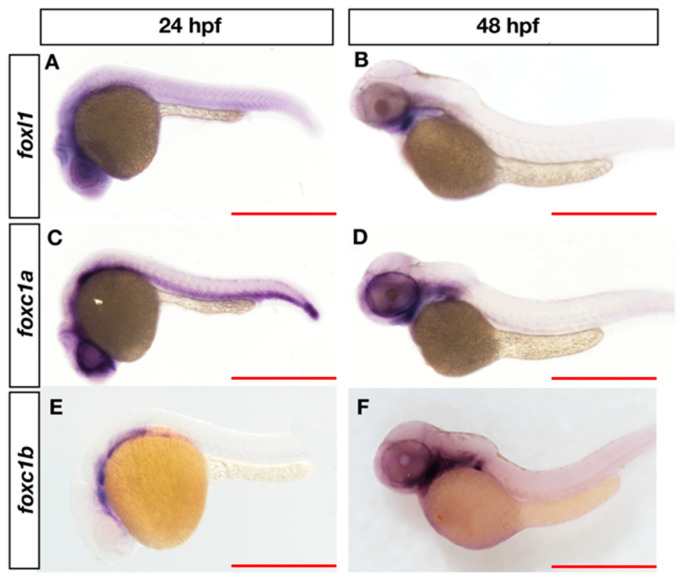
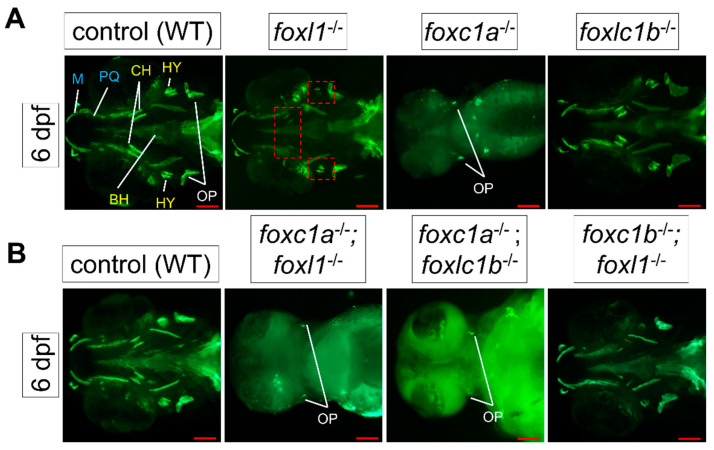
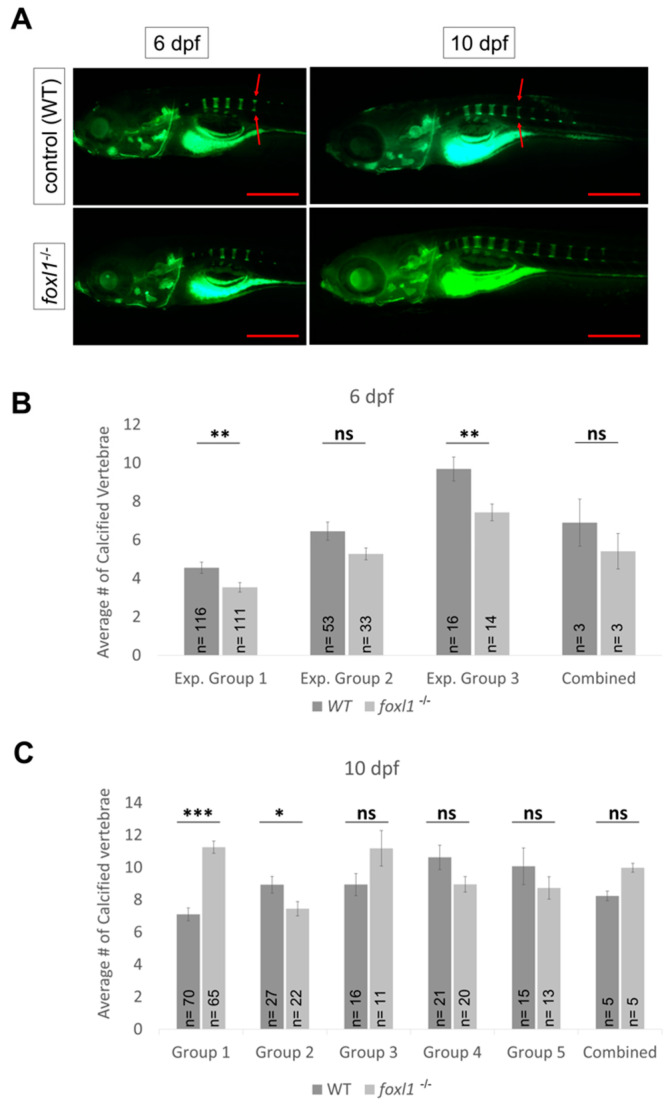
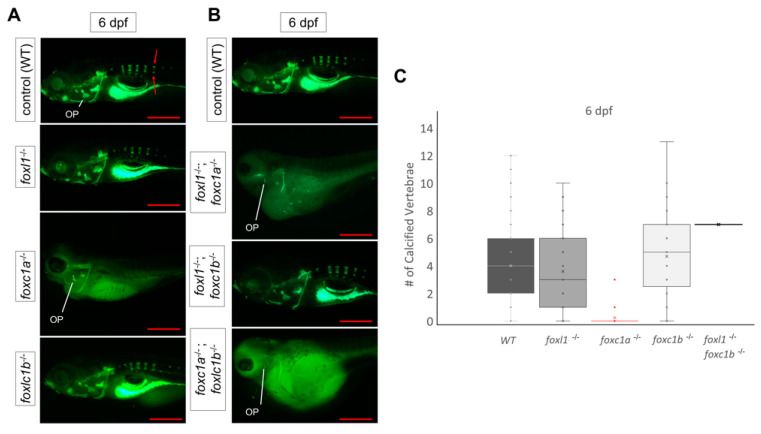
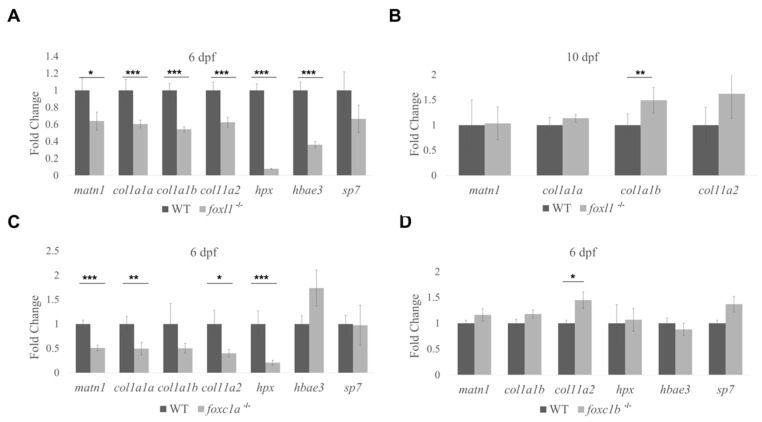
Bone diseases such as otosclerosis (conductive hearing loss) and osteoporosis (low bone mineral density) can result from the abnormal expression of genes that regulate cartilage and bone development. The forkhead box transcription factor FOXL1 has been identified as the causative gene in a family with autosomal dominant otosclerosis and has been reported as a candidate gene in GWAS meta-analyses for osteoporosis. This potentially indicates a novel role for foxl1 in chondrogenesis, osteogenesis, and bone remodelling. We created a foxl1 mutant zebrafish strain as a model for otosclerosis and osteoporosis and examined jaw bones that are homologous to the mammalian middle ear bones, and mineralization of the axial skeleton. We demonstrate that foxl1 regulates the expression of collagen genes such as collagen type 1 alpha 1a and collagen type 11 alpha 2, and results in a delay in jawbone mineralization, while the axial skeleton remains unchanged. foxl1 may also act with other forkhead genes such as foxc1a, as loss of foxl1 in a foxc1a mutant background increases the severity of jaw calcification phenotypes when compared to each mutant alone. Our zebrafish model demonstrates atypical cartilage formation and mineralization in the zebrafish craniofacial skeleton in foxl1 mutants and demonstrates that aberrant collagen expression may underlie the development of otosclerosis.

Keywords: bone mineral density; collagen; foxc1; foxl1; iron binding; osteoporosis; otosclerosis; zebrafish.


Conflict of interest statement

The authors declare no conflict of interest.

Figures

Figure 1
Figure 1
Reduction in cartilage in foxl1 mutants. (A) Alcian blue (staining cartilage) of WT and foxl1-/- (6 dpf n = 24, 10 dpf n = 20) embryos, indicating a delay in ceratohyal cartilages at 6 dpf (green arrowhead), but a recovery begins by 10 dpf. Alizarin red indicates a delay in the ossification of the hyomandibula (red arrowhead and inserts) in foxl1 mutants at 6 dpf, which also begins to normalize by 10 dpf. (B) Longitudinal sections through jaw, demonstrating a reduced presence of cartilage formation in the upper and lower jaw as indicated by the red arrows at 6 dpf, along with a shortened and round jaw structure that progresses by 10 dpf (red circle). PQ, palatoquadrate; M, Meckel; HY, hyomandibula (hyosympletic); CH, ceratohyal; CB, ceratobranchials (yellow arrowhead); OP, operculum. Zoomed-in inserts in each panel focus on the cartilage and primary centres of ossification of the hyomandibula. Scale bars are 200 µm.
Figure 2
Figure 2
Calcein staining illustrating the impact of foxl1 loss on craniofacial development and calcification. (A) Embryos of WT aged 6 and 10 dpf (n = 173 and 99, respectively) as well as those of foxl1-/- (n = 116 and 65, respectively). WT embryos at both 6 and 10 dpf exhibit normal craniofacial development and calcification of all jaw structures. foxl1-/- embryos show a delayed calcification in the ceratohyal and hyomandibula (red boxes) at 6 dpf yet appear mostly recovered by 10 dpf. (B) The proportion of embryos with delayed calcification in foxl1 mutants is statistically significant (Fisher’s *** p = 0.0001) when compared to wildtype siblings. PQ, palatoquadrate; M, Meckel; HY, hyomandibula (hyosympletic); BH, basihyal; OP, opercula; CH, ceratohyal. Scale bars are 100 µm.
Figure 3
Figure 3
Expression of foxl1, foxc1a, and foxc1b in wildtype zebrafish at 24 and 48 hpf. At 24 hpf, foxl1 is expressed at in the brain and trunk (A), similar to foxc1a (C), while foxc1b is observed in the ventral head/brain regions (E). At 48 hpf, all three forkhead genes are expressed in the pharyngeal arches (B,D,F). Scale bars are 500 µm.
Figure 4
Figure 4
Calcein staining illustrating the impact of foxl1, foxc1a, and foxc1b lone and combined loss on craniofacial development and calcification. (A) foxc1a-/- embryos have a lack of bone development in all craniofacial bones resulting from the first (blue) and second (yellow) pharyngeal arches and diminished formation of the opercula bones at 6 dpf. foxc1b-/- embryos exhibit no change. foxl1 panels are included for reference. (B) WT (n = 173); foxc1a-/-; foxl1-/- (n = 6); foxc1b-/-; foxl1-/- (n = 2); and foxc1a-/-; foxc1b-/- (n = 4) embryos at 6 dpf. foxc1a-/-; foxl1-/- embryos exhibit a further loss of craniofacial bone formation and calcification with increased size in the cardiac edema present, while foxc1b-/-; foxl1-/- embryos exhibit no change from their respective individual knockout models. foxc1a-/-; foxc1b-/- double mutants show a similar phenotype as foxc1a-/-; foxl1-/- embryos. Red boxes highlight areas of interest. Small red squares highlight the hyomandibula and the large rectangular box isolates the ceratohyal bone. Scale bars are 100 µm.
Figure 5
Figure 5
Calcein staining illustrating the impact of foxl1 loss on axial skeletal development and calcification. (A) WT and foxl1-/- embryos at 6 and 10 dpf showing normal formation of the vertebrae in foxl1. (B,C) Experimental groups of calcein staining illustrating the variability in calcification of the zebrafish vertebrate between WT and foxl1 homozygotes at 6 and 10 dpf, respectively (* p < 0.05, ** p < 0.01, *** p < 0.001), showing an increased trend in number of calcified vertebrae in foxl1 mutants by 10 dpf. Total number of calcified vertebrae were counted by including both complete and partially calcified vertebrae [partially calcified vertebrae are indicated by disconnected primary and secondary centres of ossification (red arrows)]. Scale bars are 500 µm.
Figure 6
Figure 6
Calcein staining illustrating the impact of foxl1, foxc1a, and foxc1b lone and combined loss on axial skeleton development and calcification. (A) WT, foxl1-/-, foxc1a-/-, and foxc1b-/- embryos at 6 dpf showing normal formation of the vertebrae in foxl1 and foxc1b mutants. foxc1a-/- embryos did not develop or calcify vertebrae and had large abdomen cavity edemas that grew over time. (B) WT; foxc1a-/-; foxl1-/-, foxc1b-/-; foxl1-/-, and foxc1a-/-; foxc1b-/- embryos at 6 dpf. Double foxc1a-/-; foxl1-/- embryos exhibit larger edemas and a lack of most calcified structures at 6 dpf, including the operculum (OP). foxc1b-/-; foxl1-/- embryos had no significant change. foxc1a-/-; foxc1b-/- mutants elicited similar results as foxc1a-/-; foxl1-/- embryos, including edemas and lack of craniofacial calcification. (C) Boxplots illustrating the variability in the number of vertebrae calcified in foxl1-/-, foxc1a-/-, foxc1b-/-,and foxl1-/-; foxc1b-/- mutants in comparison with WT embryos at 6 dpf. Red arrows indicate primary centres of ossification within the vertebrae. Scale bars are 500 µm.
Figure 7
Figure 7
Differential gene expression in forkhead mutants. foxl1-/- (A), foxc1a-/- (C), and foxc1b-/- (D) embryos at 6 dpf using TaqMan RT-qPCR to confirm genes of interest from RNA-Seq screen. Targets of interest were examined at 10 dpf in foxl1 mutants (B), demonstrating a recovery in gene expression. Fold change between WT and foxl1-/- plotted with WT values set to 1 (* p < 0.05, ** p < 0.01, *** p < 0.001).

Similar articles

Cited by

References

    1. Berendsen A.D., Olsen B.R. Bone Development. Bone. 2015;80:14–18. doi: 10.1016/j.bone.2015.04.035. - DOI - PMC - PubMed
    1. Fleming A., Kishida M.G., Kimmel C.B., Keynes R.J. Building the Backbone: The Development and Evolution of Vertebral Patterning. Development. 2015;142:1733–1744. doi: 10.1242/dev.118950. - DOI - PubMed
    1. Javidan Y., Schilling T.F. Methods in Cell Biology. Volume 76. Elsevier; Amsterdam, The Netherlands: 2004. Development of Cartilage and Bone; pp. 415–436. - PubMed
    1. Kozhemyakina E., Lassar A.B., Zelzer E. A Pathway to Bone: Signaling Molecules and Transcription Factors Involved in Chondrocyte Development and Maturation. Development. 2015;142:817–831. doi: 10.1242/dev.105536. - DOI - PMC - PubMed
    1. Dash S., Trainor P.A. The Development, Patterning and Evolution of Neural Crest Cell Differentiation into Cartilage and Bone. Bone. 2020;137:115409. doi: 10.1016/j.bone.2020.115409. - DOI - PubMed

Publication types

Grants and funding

This research was funded through the Medical Research Fund at Memorial University (Curtis French) and the Atlantic Canada Opportunities Agency—Community Innovation Fund (Terry-Lynn Young). Alexia Hawkey-Noble is supported by the Dean’s Fellowship (Memorial University).