. 2022 Jul 22;13(1):4231.
doi: 10.1038/s41467-022-31852-w.

Altered tRNA dynamics during translocation on slippery mRNA as determinant of spontaneous ribosome frameshifting

Affiliations

Altered tRNA dynamics during translocation on slippery mRNA as determinant of spontaneous ribosome frameshifting

Panagiotis Poulis et al. Nat Commun. .

Abstract

When reading consecutive mRNA codons, ribosomes move by exactly one triplet at a time to synthesize a correct protein. Some mRNA tracks, called slippery sequences, are prone to ribosomal frameshifting, because the same tRNA can read both 0- and -1-frame codon. Using smFRET we show that during EF-G-catalyzed translocation on slippery sequences a fraction of ribosomes spontaneously switches from rapid, accurate translation to a slow, frameshifting-prone translocation mode where the movements of peptidyl- and deacylated tRNA become uncoupled. While deacylated tRNA translocates rapidly, pept-tRNA continues to fluctuate between chimeric and posttranslocation states, which slows down the re-locking of the small ribosomal subunit head domain. After rapid release of deacylated tRNA, pept-tRNA gains unconstrained access to the -1-frame triplet, resulting in slippage followed by recruitment of the -1-frame aa-tRNA into the A site. Our data show how altered choreography of tRNA and ribosome movements reduces the translation fidelity of ribosomes translocating in a slow mode.


Conflict of interest statement

The authors declare no competing interests.

Figures

Fig. 1
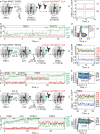
Fig. 1. EF-G-induced translocation of pept-tRNA.
a Schematic of the smFRET experiment. Pept-tRNALys-Cy5 (red star) fluctuates between A/A, A/P, and A/P* states in the absence of EF-G. Upon EF-G addition, pept-tRNA moves into a transient CHI state before reaching the P/P state. The movement is monitored by change in FRET between pept-tRNALys-Cy5 and L11-Cy3 (green star). FRET values are assigned to PRE and POST states in independent experiments (Supplementary Fig. 1) and validated by distance measurements based on cryo-EM structures,,. b Coding sequences of mRNA constructs. Slippery sequence encodes fMet-Gly-Lys-Phe peptide in 0 frame and fMet-Gly-Lys-Val in −1 frame. Non-slippery mRNA that does not support frameshifting encodes only the 0-frame peptide fMet-Phe-Lys-Phe. c Representative smFRET time trace showing tRNA translocation on non-slippery mRNA. Trace shows fluctuations between FRET 0.8 (A/A, A/P) and 0.6 (A/P*) followed by rapid transition to FRET 0.2 (P/P). Black line shows the HMM fit of the data here and in all smFRET traces. d Contour plot showing distribution of FRET values during tRNA translocation on non-slippery mRNA. Transitions occur from either A/A and A/P or A/P* to P/P in less than 33 ms. Traces are synchronized to the first transition below FRET 0.5. Histogram at the right shows distribution of FRET values after synchronization. Data are from 5 independent experiments (N = 5). e Representative smFRET time trace showing tRNA translocation on slippery mRNA. Trace shows rapid transition from FRET 0.8 (A/A, A/P) to FRET 0.4 (CHI),, followed by fluctuations between FRET 0.4 and 0.2 before adopting a long-lived FRET 0.2 state (P/P). f Contour plot showing distribution of FRET values during translocation on slippery mRNA. The contour plot contains mixture of trajectories. 81% of traces show direct transitions from A/A, A/P or A/P* to P/P. 19% of traces show transitions from A/A, A/P, or A/P* to CHI followed by fluctuations between CHI and P/P states before transition to long-lived P/P state. Traces are synchronized to the first transition below FRET 0.5. Histogram at the right shows distribution of FRET values after synchronization. Data are from 12 independent experiments (N = 12).
Fig. 2
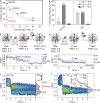
Fig. 2. Frameshifting-prone translocation with EF-G(Q507) mutants.
a Schematic of an EF-G–ribosome complex in CHI state (adapted from PDB 4W29). Pept-tRNA (magenta) and deacylated tRNA (blue) are in CHI states. The zoom-in shows residue Q507 at the tip of domain 4 of EF-G (green) in contact with the anticodon loop of pept-tRNA. The ribosome is shown in gray and the mRNA in black. bd Contour plots showing the distribution of FRET values during translocation on slippery mRNA mediated by EF-G(Q507A) (b), EF-G(Q507N) (c), and EF-G(Q507D) (d). Histograms at the right show distribution of FRET values after synchronization to the first transition below FRET 0.5. Pie charts indicate percentage of smFRET traces showing prolonged fluctuations between CHI and P/P states (dark gray) during translocation. Data are from at least four independent experiments (N = 4 for Q507A, N = 5 for Q507N, and N = 9 for Q507D). e Transition frequency between FRET states during translocation on slippery mRNA with Q507 mutants and EF-G(wt) (Supplementary Fig. 2 and Table 1). After addition of EF-G, transitions between FRET 0.4 (CHI) and 0.2 (P/P) states are predominant. Shown are mean values with error bars representing the standard deviations. Data are from at least three independent experiments (N = 3 for PRE, N = 12 for wt, N = 4 for Q507A, N = 5 for Q507N, and N = 9 for Q507D). f Correlation between frameshifting efficiency and the fraction of ribosomes sampling CHI states during translocation on slippery mRNA (Supplementary Fig. 3). Frameshifting efficiencies were measured at 22 °C to match the conditions of the smFRET experiments. Shown are mean values with error bars representing the standard deviation. Black line indicates a linear fit with the slope of 1.3 ± 0.1, R2 = 0.9982. Frameshifting efficiencies are from three independent experiments (N = 3). The percentage of traces with CHI states is derived from at least three independent experiments (N = 12 for wt, N = 4 for Q507A, N = 5 for Q507N, and N = 9 for Q507D).
Fig. 3
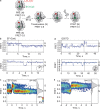
Fig. 3. Translocation of pept-tRNALys on slippery mRNA and incorporation of 0- and –1-frame aa-tRNAs.
a Schematic of translocation on slippery mRNA with EF-G(wt). Pept-tRNALys-BHQ2 (black circle) moves from the A to the P site. The near-cognate –1-frame Val-tRNAVal-Cy5 (red star) samples POST2 complexes without accommodating in the A site. EF-G is added to immobilized PRE1 complexes together with the EF-Tu–GTP–Val-tRNAVal-Cy5 complex. b Representative time trace of pept-tRNALys-BHQ2 movement and subsequent sampling of POST2 complexes by Val-tRNAVal-Cy5 (N = 89). Fl, fluorescence intensity; Q-pb, photobleaching of BHQ2. Green labels at the right Y-axis indicate tRNALys conformational states monitored by Cy3 fluorescence, as assigned in Supplementary Fig. 4. c Zoom-in into b showing Cy3 and Cy5 FI and calculated FRET of the initial binding (IB) without accommodation of –1-frame Val-tRNAVal-Cy5 on POST2 complexes. d Contour plot showing distribution of FRET values during –1-frame Val-tRNAVal-Cy5 sampling of POST2 complexes. Traces were synchronized to the point with FRET > 0. Histogram at the right shows FRET distribution after synchronization. e Schematic of translocation on slippery mRNA by EF-G(wt), with −1 frameshifting. After translocation of pept-tRNALys-BHQ2 (black circle) from the A to the P site and Val-tRNAVal-Cy5 (red star) can bind to its cognate –1-frame codon. f Representative time trace of pept-tRNALys-BHQ2 translocation and accommodation of Val-tRNAVal-Cy5 (N = 57). g Zoom-in into f showing Cy3 and Cy5 FI and calculated FRET of Val-tRNAVal-Cy5 binding to POST2 forming PRE2 complexes. Red labels indicate conformational states of tRNAVal-Cy5. h Contour plot showing distribution of FRET values after Val-tRNAVal-Cy5 accommodation on POST2 complex forming PRE2. i Schematic of translocation on slippery mRNA by EF-G(Q507D), with −1 frameshifting. After translocation of pept-tRNALys-BHQ2 from the A to the P site, Val-tRNAVal-Cy5 (red star) accommodates on its cognate codon in –1-frame. j Representative time trace of pept-tRNALys-BHQ2 translocation and subsequent accommodation of –1-frame Val-tRNAVal-Cy5 (box) (N = 46). k Zoom-in into k showing Cy3 and Cy5 FI and calculated FRET of Val-tRNAVal-Cy5 binding to POST2 complex, leading to CR and subsequent fluctuations between A/A, A/P and A/P* states. l Contour plot showing the distribution of FRET values after Val-tRNAVal-Cy5 accommodation on POST2 complex.
Fig. 4
Fig. 4. Translocation trajectory of deacylated tRNA.
a Schematic of smFRET experiment monitoring movement of tRNALys-Cy5 (Cy5; red star) relative to protein S13-Cy3 (green star). Translocation is induced by addition of EF-G to immobilized PRE complexes. FRET values corresponding to P, P/E and E states were determined in independent experiments (Supplementary Fig. 5 and 6). b Coding sequences of mRNA constructs. Slippery sequence encodes fMet-Ala-Lys-Lys-Phe in 0 frame and fMet-Ala-Lys-Lys-Val in −1 frame. Non-slippery mRNA encodes only 0-frame fMet-Ala-Lys-Lys-Phe peptide because tRNALys does not base pair with the –1-frame GAA. c Representative smFRET time trace of tRNA translocation on non-slippery mRNA in the presence of EF-G(wt) showing step-wise transition from FRET 0.9 (P/P) to 0.6 (P/E) to 0.3 (E site) to 0.0 (dissociation). d Contour plot showing distribution of FRET efficiencies during translocation on non-slippery mRNA by EF-G(wt). Transitions occur either from FRET 0.9 (P site) or 0.6 (P/E) to FRET 0.3 (E site). Traces are synchronized to the first transition below FRET 0.5. Histogram at the right shows distribution of FRET values after synchronization. Inset shows rates and curve fits of tRNA dissociation from E site on slippery (closed circles) and non-slippery (open circles) mRNA (Supplementary Fig. 6b and Table 2). Normalization was performed by division by the number of transitions (n). Data are from four independent experiments (N = 4). e Representative smFRET time trace of tRNA translocation on slippery mRNA in the presence of EF-G(Q507D) showing step-wise transition from FRET 0.9 (P site) to 0.6 (P/E) to 0.3 (E site) to 0.0 (dissociation), similar to EF-G(wt) (c). f Contour plot showing the distribution of FRET efficiencies during translocation on slippery mRNA by EF-G(Q507D). Transitions occur either from FRET 0.9 (P site) or 0.6 (P/E) to FRET 0.3 (E site). Inset shows rates and curve fits of tRNA dissociation from E site on slippery (closed circles) and non-slippery (open circles) mRNA. Normalization was performed by division by the number of transitions (n) (Supplementary Fig. 6c and Table 2). Data are from three independent experiments (N = 3).
Fig. 5
Fig. 5. Translocation on slippery mRNA with EF-G(wt)—GTPγS.
a Correlation between frameshifting and ensemble translocation rate. Frameshifting was measured at 37 °C, data are presented as mean ± s.d. from three independent experiments (N = 3). Translocation rates of EF-G(wt) and Q507 mutants are from ref. , of GTPγS (brown) from ref. , and of Spc (orange) from . b Above: schematic of smFRET experiment monitoring movement of pept-tRNALys-Cy5 (red stars) relative to L11-Cy3 (green star) by EF-G(wt)—GTPγS (brown hexagon) binding to immobilized PRE complexes. Below: representative smFRET trace of pept-tRNA translocation by EF-G(wt)—GTPγS with fluctuations between FRET 0.8 (A/A, A/P) and 0.6 (A/P*) followed by fluctuations between FRET 0.4 (CHI) and 0.6. c Contour plot showing the distribution of FRET values during translocation of pept-tRNA on slippery mRNA by EF-G(wt)—GTPγS. Traces are synchronized to the first transition below FRET 0.5. Histogram at the right shows the distribution of FRET values after synchronization. Data are from six independent experiments (N = 6). d Transition frequencies between FRET states during pept-tRNA translocation on slippery mRNA by EF-G(wt)—GTPγS (Supplementary Fig. 7b and Table 1) and in the presence of Spc (Table 1). Data are presented as mean ± s.d. from 6 (N = 6, EF-G(wt)—GTPγS), or 3 (N = 3, Spc) independent experiments. e Above: schematic of smFRET experiment with tRNALys-Cy5 (red star) moving relative to protein S13-Cy3 (green star) during translocation induced by addition of EF-G(wt)–GTPγS to immobilized PRE complexes. Below: representative smFRET trace of translocation by EF-G(wt)—GTPγS with step-wise transition from FRET 0.9 (P/P) to 0.6 (P/E) to 0.3 (E) to 0.0 (dissociation). f Contour plot showing the distribution of FRET values during translocation of deacylated tRNA on slippery mRNA by EF-G(wt)—GTPγS. Inset shows rates and curve fit of tRNA dissociation from E site on slippery (closed circles) and non-slippery (open circles) mRNA (Supplementary Fig. 7c and Table 2). Normalization was performed by division by the number of transitions (n). Data are from 3 independent experiments (N = 3).
Fig. 6
Fig. 6. SSU head domain swiveling during translocation on slippery mRNA.
a Schematic of smFRET experiment. Movement of SSU head domain during translocation induced by addition of EF-G to immobilized PRE complexes monitored with FRET labels on ribosomal proteins S13 (S13-Cy3, green star) and L33 (L33-Cy5, red star). FRET values representing the non-swiveled (N) and swiveled (S) states are determined in independent experiments (Supplementary Fig. 9 and Table 3). b Representative smFRET time traces for SSU head movements during EF-G(wt)-induced translocation. The majority of traces (upper panel) show fluctuations between FRET 0.8 (S) and 0.5 (N) followed by a stable FRET 0.5 (N) state after translocation. 13% of traces (lower panel) show no transition to the N state in the time course of the experiment. Pie charts indicate the percentage of traces ending in N (white) or S (gray) state. Black vertical lines represent the synchronization point, i.e., the last transition to FRET 0.8 (S) (see below). c Contour plot showing distribution of FRET values representing SSU head movement during translocation on slippery mRNA by EF-G(wt). Traces were synchronized to the last transition to FRET 0.8 (S). The duration of the last FRET 0.8 state is an estimate for the duration of translocation, because back swiveling occurs simultaneously with the dissociation of EF-G from the ribosome after translocation. Histogram at the right shows distribution of FRET values after synchronization. Data are from four independent experiments (N = 4). d Representative smFRET time traces for SSU head domain movement during translocation on slippery mRNA with EF-G(Q507D). A small fraction of traces (upper panel) show fluctuations between FRET 0.8 (S) and 0.5 (N) and end in a stable FRET 0.5 (N) state after translocation. 87% of traces (lower panel) show no transition to the N state in the time course of the experiment. e Contour plot showing distribution of FRET values representing SSU head domain movement during translocation on slippery mRNA by EF-G(Q507D). Histogram at the right shows the distribution of FRET values after synchronization. Data are from three independent experiments (N = 3).
Fig. 7
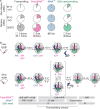
Fig. 7. Translocation trajectories correlating with frameshifting.
a Pie charts comparing the frameshifting efficiency (gray) with the distribution of translocation rates for pept-tRNA (magenta) and deacylated tRNA (blue) and SSU head domain back rotation (green) on non-slippery and slippery mRNA with EF-G(wt) and EF-G(Q507D). b Kinetic model of translocation on slippery mRNA. Majority of ribosomes translocate in fast mode with tRNAs moving synchronously to the POST state; back swiveling of the SSU head domain completes translocation. A fraction of ribosomes translocates in slow mode where pept-tRNA is trapped fluctuating between CHI and P/P instead of moving to the POST state. Deacylated tRNA translocates rapidly and dissociates from the E site allowing pept-tRNA to sample 0- and –1-frame codons. SSU head closure is delayed due to prolonged fluctuations of pept-tRNA. Rates of the elemental reactions for pept-tRNA are indicated.

Similar articles

Cited by

References

    1. Kelly JA, et al. Structural and functional conservation of the programmed −1 ribosomal frameshift signal of SARS coronavirus 2 (SARS-CoV-2) J. Biol. Chem. 2020;295:10741–10748. doi: 10.1074/jbc.AC120.013449. - DOI - PMC - PubMed
    1. Kendra JA, et al. Functional and structural characterization of the chikungunya virus translational recoding signals. J. Biol. Chem. 2018;293:17536–17545. doi: 10.1074/jbc.RA118.005606. - DOI - PMC - PubMed
    1. Kendra, J. A. et al. Ablation of programmed −1 ribosomal frameshifting in Venezuelan equine encephalitis virus results in attenuated neuropathogenicity. J. Virol.91, e01766-16 (2017). - PMC - PubMed
    1. Moomau C, Musalgaonkar S, Khan YA, Jones JE, Dinman JD. Structural and functional characterization of programmed ribosomal frameshift signals in west nile virus strains reveals high structural plasticity among cis-acting RNA elements. J. Biol. Chem. 2016;291:15788–15795. doi: 10.1074/jbc.M116.735613. - DOI - PMC - PubMed
    1. Atkins, J. F., O’Connor, K. M., Bhatt, P. R. & Loughran, G. From recoding to peptides for MHC class i immune display: enriching viral expression, virus vulnerability and virus evasion. Viruses13, 1251 (2021). - PMC - PubMed

Publication types

LinkOut - more resources