. 2022 Jul 27;96(14):e0012622.
doi: 10.1128/jvi.00126-22. Epub 2022 Jul 7.

Nitric Oxide Attenuates Human Cytomegalovirus Infection yet Disrupts Neural Cell Differentiation and Tissue Organization

Affiliations

Nitric Oxide Attenuates Human Cytomegalovirus Infection yet Disrupts Neural Cell Differentiation and Tissue Organization

Rebekah L Mokry et al. J Virol. .

Abstract

Human cytomegalovirus (HCMV) is a prevalent betaherpesvirus that is asymptomatic in healthy individuals but can cause serious disease in immunocompromised patients. HCMV is also the leading cause of virus-mediated birth defects. Many of these defects manifest within the central nervous system and include microcephaly, sensorineural hearing loss, and cognitive developmental delays. Nitric oxide is a critical effector molecule produced as a component of the innate immune response during infection. Congenitally infected fetal brains show regions of brain damage, including necrotic foci with infiltrating macrophages and microglia, cell types that produce nitric oxide during infection. Using a 3-dimensional cortical organoid model, we demonstrate that nitric oxide inhibits HCMV spread and simultaneously disrupts neural rosette structures, resulting in tissue disorganization. Nitric oxide also attenuates HCMV replication in 2-dimensional cultures of neural progenitor cells (NPCs), a prominent cell type in cortical organoids that differentiate into neurons and glial cells. The multipotency factor SOX2 was decreased during nitric oxide exposure, suggesting that early neural differentiation is affected. Nitric oxide also reduced maximal mitochondrial respiration in both uninfected and infected NPCs. We determined that this reduction likely influences neural differentiation, as neurons (Tuj1+ GFAP- Nestin-) and glial populations (Tuj1- GFAP+ Nestin-) were reduced following differentiation. Our studies indicate a prominent, immunopathogenic role of nitric oxide in promoting developmental defects within the brain despite its antiviral activity during congenital HCMV infection. IMPORTANCE Human cytomegalovirus (HCMV) is the leading cause of virus-mediated congenital birth defects. Congenitally infected infants can have a variety of symptoms manifesting within the central nervous system. The use of 3-dimensional (3-D) cortical organoids to model infection of the fetal brain has advanced the current understanding of development and allowed broader investigation of the mechanisms behind disease. However, the impact of the innate immune molecule nitric oxide during HCMV infection has not been explored in neural cells or cortical 3-D models. Here, we investigated the effect of nitric oxide on cortical development during HCMV infection. We demonstrate that nitric oxide plays an antiviral role during infection yet results in disorganized cortical tissue. Nitric oxide contributes to differentiation defects of neuron and glial cells from neural progenitor cells despite inhibiting viral replication. Our results indicate that immunopathogenic consequences of nitric oxide during congenital infection promote developmental defects that undermine its antiviral activity.

Keywords: SOX2; cortical organoids; induced pluripotent stem cells; microcephaly; mitochondrial respiration; neural development; neural differentiation; neural progenitor cells.


Conflict of interest statement

The authors declare no conflict of interest.

Figures
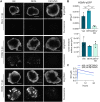
FIG 1
FIG 1
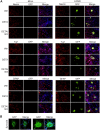
Nitric oxide reduces HCMV spread in cortical organoids. (A) Cortical organoids were infected with HCMV strain TB40/E encoding free green fluorescent protein (TB40/E-eGFP) and propagated in MRC-5 fibroblasts (TB40/EFb-eGFP) at an MOI of 500 infectious units (IU)/μg or mock infected, and tissues were treated at 2 hpi with a 400 μM concentration of the nitric oxide donor DETA/NO, DETA (spent donor), or vehicle control. Treatment was changed every 24 h. Images were acquired at 11 dpi using a 1× objective and represent 3 biological replicates per condition, with individual organoids considered a biological replicate. Bar, 1,000 μm. (B) The cross-sectional surface area (μm2) of the organoids and mean fluorescence intensity (MFI) were measured using NIS Elements software and the MFI relative to area (μm2) was quantified. Errors bars represent standard deviations from the mean (SD). One-way analysis of variance (ANOVA) with multiple comparisons was used to determine significance. **, P = 0.0044; ***, P = 0.0004; ns, not significant. (C) Steady-state nitric oxide levels for 200 μM DETA/NO were estimated using COPASI software (55). The rate of decay for DETA/NO was calculated from the half-life (t1/2) of 20 h at 37°C (51). The estimated oxygen concentration was set to 220 μM. The reaction rate of nitric oxide with oxygen to form nitrogen dioxide (NO2) was entered as 2.4 × 106 M−2 s−1 (87), and the rate of reaction of nitric oxide with NO2 to form nitrite was set to 1 × 109 M−2 s−1.
FIG 2
FIG 2
Nitric oxide induces DNA damage in organoids without increased cell death. Immunofluorescence images of cortical organoid sections at 12 dpi. (A) Sections were labeled for TUNEL (red), with Hoechst (blue) used to stain nuclei. HCMV-infected organoids show GFP expression (green), with no expression observed in mock-infected organoids. Bar, 500 μm. Images represent organoid sections from two or three organoids per condition. White arrows indicate regions without TUNEL and Hoechst staining. (B) The sum fluorescence intensity ratio of TUNEL to Hoechst (TUNEL/Hoechst) was quantified from two or three organoid sections per condition. Error bars represent SD. Two-way ANOVA with multiple comparisons was used to determine significance. *, P = 0.02. (C) Cortical organoids were infected with TB40/EFb-eGFP at an MOI of 500 IU/μg or mock infected, and tissues were treated at 2 hpi with a 400 μM concentration of the nitric oxide donor DETA/NO, DETA (spent donor), or vehicle control. Treatment was changed every 24 h. At 11 dpi, organoids were dissociated to single cells, and cell viability was quantified by trypan blue exclusion. Data are the results of two biological replicates per condition, with individual organoids considered a biological replicate. Error bars represent SD.
FIG 3
FIG 3
Neural rosette structure and tissue organization are disrupted in cortical organoids during nitric oxide exposure. (A) Organoid sections were labeled for SOX2 (red), with Hoechst (blue) used to stain nuclei. White boxes indicate regions enlarged in panel B. Bar, 500 μm. (B) Arrowheads point to SOX2-expressing cells organized in radial neural rosette structures. Arrows point to disorganized rosette-like structures. Images represent organoid sections from three organoids per condition.
FIG 4
FIG 4
Nitric oxide attenuates HCMV replication by 48 hpi. (A) Neural progenitor cells (NPCs) were plated subconfluently and treated every 24 h with the indicated concentrations of DETA/NO or vehicle control or untreated (Untx). Cell viability and live cell number were quantified at 96 h posttreatment using trypan blue exclusion. Data are the results of one or two biological replicates. Error bars represent SD. (B) NPCs were plated subconfluently and infected with HCMV strain TB40/E encoding free green fluorescent protein (TB40/E-eGFP) propagated in ARPE-19 cells (TB40/EEpi-eGFP) at an MOI of 3 IU/cell. Cells were treated at 2 hpi with 200 μM DETA/NO, DETA (spent donor), or vehicle control. Treatment was changed every 24 h. Viral DNA levels were determined relative to cellular DNA levels at the indicated time points using primers to UL123 and TP53 genes. Viral titers were determined by an infectious units assay from culture supernatant collected at 96 hpi. Data are the results of two (viral titers) or three (DNA) biological replicates and two technical replicates. Errors bars represent SD. For viral DNA, statistics were performed on transformed data using a two-way ANOVA with multiple comparisons to determine significance. For viral titers, an unpaired, one-tailed t test was used to determine significance. *, P < 0.05. (C) NPCs were infected and treated as described above. At 96 hpi, supernatants and cells from the same culture were collected to quantify cell-free and cell-associated viral titers. Cells were lysed by freeze-thawing and centrifuged to collect the supernatant. Viral titers were determined by infectious units assay on ARPE-19 cells. Data are the results of three biological replicates and two technical replicates. Error bars represent SD. (D and E) NPCs were infected and treated as described above. Whole-cell lysates were collected at the indicated time points and viral proteins IE1 (immediate early), IE2 (Immediate-early), UL44 (early), and pp28 (late) levels were assessed by Western blot analysis. (E) Antibody signals were normalized to total protein before normalizing to 96-hpi, vehicle-treated signal using Image Lab software (Bio-Rad). Data are the results of three biological replicates.
FIG 5
FIG 5
Nitric oxide alters expression of proliferation and differentiation markers. (A to C) NPCs were plated subconfluently and infected at an MOI of 3 IU/cell or mock infected. Cells were treated at 2 hpi with 200 μM DETA/NO or vehicle control, and treatment was changed every 24 h. Whole-cell lysates were collected, and protein levels were assessed by Western blotting using antibodies against the indicated proteins. Antibody signals were normalized to total protein before quantifying DETA/NO-treated relative to vehicle-treated for each time point using Image Lab software (Bio-Rad). Data represent two (A and B) or three (C) biological replicates.
FIG 6
FIG 6
Mitochondrial function is compromised in mock- and HCMV-infected NPCs during nitric oxide exposure. (A) Schematic of mitochondrial stress assay to assess mitochondrial function by measuring oxygen consumption rate (OCR). Sequential injections of oligomycin (1 μM), FCCP (1.5 μM), and rotenone/antimycin A (1 μM) allow the quantitation of basal (green), ATP-linked (blue), maximal (yellow), proton leak (red), and nonmitochondrial respiration (gray). (B to F) NPCs were plated at 50,000 cells/well in a Matrigel-coated 96-well Seahorse Bioscience dish and incubated for 3 days. Cells were infected with TB40/EEpi-eGFP at an MOI of 3 IU/cell or mock infected and treated at 2 hpi with 200 μM DETA/NO, DETA (spent donor), or vehicle control. A mitochondrial stress assay was performed at 1 dpi, and medium was replaced 1 h prior to assay with XF DMEM base medium without nitric oxide donor. The assay was run as described above, and basal (C), ATP-linked (D), maximal (E), and spare capacity (F) OCRs were quantified. Data are the results of three biological replicates and five or six technical replicates. Error bars represent SD. Brown-Forsythe and Welch’s ANOVA with multiple comparisons were used to determine significance with DETA omitted from the analysis. *, P = 0.03; **, P < 0.007; ***, P < 0.0002; ****, P < 0.0001; ns, not significant.
FIG 7
FIG 7
Assessing NPC differentiation using immunofluorescence. (A) NPCs were plated subconfluently, infected with TB40/EEpi-eGFP at an MOI of 0.05 IU/cell or mock infected and treated at 2 hpi with 200 μM DETA/NO, DETA (spent donor), or vehicle control. Treatment was changed every 48 h. At 11 dpi, progenitor, glial, and neuron populations were assessed using immunofluorescence and labeling for Nestin, GFAP, and Tuj1. Data represent two biological replicates. Bar, 100 μm. (B) Multinucleated aggregate or syncytium formation in differentiated neural cells at 11 dpi. Images are maximum-intensity projections. Bar, 50 μM.
FIG 8
FIG 8
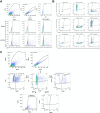
Gating for GFP and flow controls. (A) Live, single-cell events were gated, and the GFP+ gate was placed on the negative population of uninfected, unstained cells. This gate was applied to both mock- and HCMV-infected samples for all conditions. (B) FMO controls for flow analysis using unstained cells and FMO controls labeled with two of the three antibodies: Tuj1 and Nestin, Tuj1 and GFAP, and Nestin and GFAP. Live, single-cell events were gated, and FMO gates were set using the negative populations for each marker. (C) Live, single cells were gated, and Tuj1+ Nestin GFAP (neuron) and Tuj1+ Nestin+ GFAP (immature neuron) events were quantified from Tuj1+ events gated from Tuj1/GFAP populations (Q1). Tuj1+ Nestin GFAP+ (progenitor-like) and Tuj1+ Nestin+ GFAP+ (transition state) populations were quantified from cells gated on Tuj1+ GFAP+ events (Q2). Tuj1 Nestin GFAP+ (glial) populations were quantified by gating on Tuj1 GFAP+ events (Q3). Tuj1 Nestin+ GFAP (progenitor) populations were measured from gating on Tuj1 GFAP events (Q4) and then Nestin+ events.
FIG 9
FIG 9
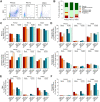
Nitric oxide alters NPC differentiation but is impacted by cell passage. NPCs were plated subconfluently, infected with TB40/EEpi-eGFP at an MOI of 0.05 IU/cell or mock infected, and treated at 2 hpi with 200 μM DETA/NO, DETA (spent donor) or vehicle control. Treatment was changed every 48 h. At 11 dpi, progenitor, glial, and neuron populations were identified by labeling for Nestin, GFAP, and Tuj1, respectively, and quantified using flow cytometry at 11 dpi. Data are from three different cell passages, with passage numbers indicating iPSC/NPC neurosphere passages. (A) HCMV-infected cell populations were identified using GFP expression as an indicator of infected cells. Live, single-cell events were gated, and GFP and GFP+ gates were applied to the unstained, uninfected cells. These gates were then applied to the experimental samples, and percent GFP+ relative to live, single-cell events is displayed. (B to F) Neural markers were quantified by gating on live, single-cell events and using FMO controls to gate Tuj1/GFAP, Tuj1/Nestin, and GFAP/Nestin populations. (B) Frequency variability between cell passage for populations of Tuj1+ Nestin GFAP (neuron), Tuj1+ Nestin+ GFAP (immature neuron), Tuj1 Nestin GFAP+ (glial), Tuj1+ Nestin GFAP+ (transition state), Tuj1+ Nestin+ GFAP+ (progenitor-like), and Tuj1 Nestin+ GFAP (progenitor) populations. (C) Tuj1+ Nestin GFAP and Tuj1+ Nestin+ GFAP populations were identified by gating live, single-cell events and gating for Tuj1/GFAP populations. Tuj1+ GFAP events were then gated for Tuj1/Nestin populations. (D) Tuj1+ Nestin+ GFAP+ (progenitor-like) and Tuj1+ Nestin GFAP+ (transition state) were identified following a similar workflow, but Tuj1+ GFAP+ events were gated for Tuj1/Nestin. (E) Tuj1 Nestin GFAP+ (glial) populations were identified by gating live, single-cell events and gating for Tuj1/GFAP populations. Tuj1 GFAP+ events were then gated for GFAP/Nestin populations. (F) Tuj1 Nestin+ GFAP (progenitor) were identified by gating for live, single cells and Tuj1/GFAP population and gating for Nestin on the Tuj1 GFAP population. All populations were quantified as percentage of live, single-cell events.

Similar articles

Cited by

References

    1. Shenk TE, Stinski MF. 2008. Human cytomegalovirus. Preface. Curr Top Microbiol Immunol 325:v. - PubMed
    1. Pass RF, Arav-Boger R. 2018. Maternal and fetal cytomegalovirus infection: diagnosis, management, and prevention. F1000Res 7:255. 10.12688/f1000research.12517.1. - DOI - PMC - PubMed
    1. Lombardi G, Garofoli F, Stronati M. 2010. Congenital cytomegalovirus infection: treatment, sequelae and follow-up. J Matern Fetal Neonatal Med 23(Suppl 3):45–48. 10.3109/14767058.2010.506753. - DOI - PubMed
    1. Boppana SB, Ross SA, Fowler KB. 2013. Congenital cytomegalovirus infection: clinical outcome. Clin Infect Dis 57(Suppl 4):S178–S181. 10.1093/cid/cit629. - DOI - PMC - PubMed
    1. Dollard SC, Grosse SD, Ross DS. 2007. New estimates of the prevalence of neurological and sensory sequelae and mortality associated with congenital cytomegalovirus infection. Rev Med Virol 17:355–363. 10.1002/rmv.544. - DOI - PubMed

Publication types