

Transcriptomic study of anastasis for reversal of ethanol-induced apoptosis in mouse primary liver cells
- PMID: 35851273
- PMCID: PMC9293995
- DOI: 10.1038/s41597-022-01470-8
Transcriptomic study of anastasis for reversal of ethanol-induced apoptosis in mouse primary liver cells
Abstract
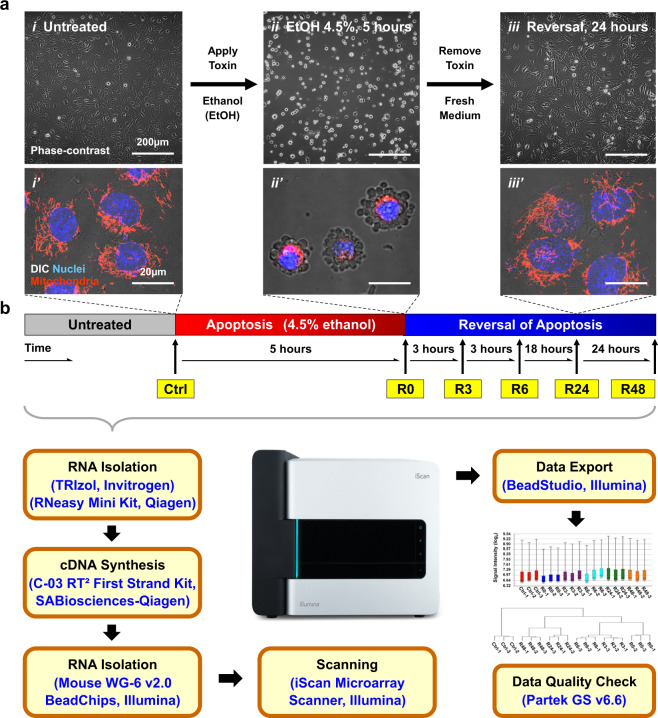
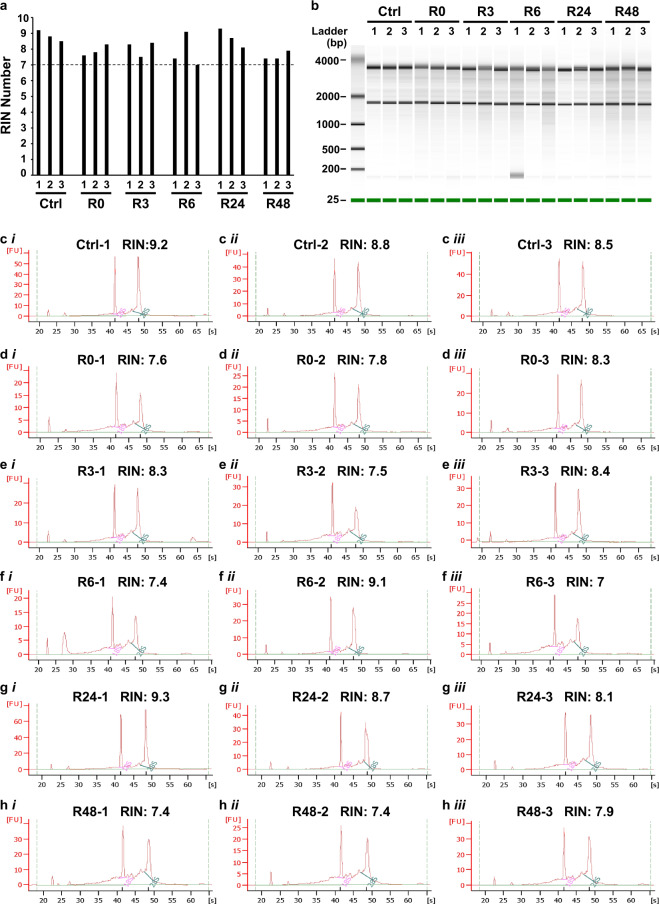
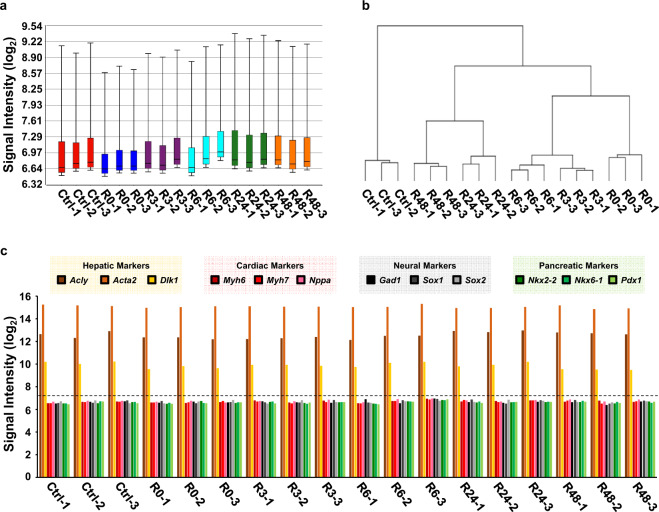
Anastasis is a cell recovery mechanism that rescues dying cells from the brink of death. Reversal of apoptosis is the first example of anastasis. Here, we describe a comprehensive dataset containing time-course mRNA expression profiles for reversal of ethanol-induced apoptosis in mouse primary liver cells in νitro. This transcriptome dataset includes the conditions of the untreated cells, cells undergoing apoptosis triggered by incubating with cell death inducer of 4.5% ethanol for 5 hours, and apoptosis reversal of ethanol-induced cells at the early (3rd hour), middle (6th hour), and late (24th, 48th hour) stages after being washed with and incubated in fresh cell culture medium. By comparing this dataset with the transcriptomic profiles of other anastasis models generated with different combinations of cell types and cell death inducers, investigators can identify the key regulators governing reversal of apoptosis and other reversible cell death processes. Therefore, reusing or reanalysing this dataset will facilitate the future studies on the physiological, pathological, and therapeutic implications of anastasis.
© 2022. The Author(s).
Conflict of interest statement
The authors declare no competing interests.
Figures
Similar articles
-
Molecular signature of anastasis for reversal of apoptosis.F1000Res. 2017 Jan 13;6:43. doi: 10.12688/f1000research.10568.2. eCollection 2017. F1000Res. 2017. PMID: 28299189 Free PMC article.
-
Anastasis: recovery from the brink of cell death.R Soc Open Sci. 2018 Sep 19;5(9):180442. doi: 10.1098/rsos.180442. eCollection 2018 Sep. R Soc Open Sci. 2018. PMID: 30839720 Free PMC article. Review.
-
Anastasis: cell recovery mechanisms and potential role in cancer.Cell Commun Signal. 2022 Jun 3;20(1):81. doi: 10.1186/s12964-022-00880-w. Cell Commun Signal. 2022. PMID: 35659306 Free PMC article. Review.
-
Cell survival, DNA damage, and oncogenic transformation after a transient and reversible apoptotic response.Mol Biol Cell. 2012 Jun;23(12):2240-52. doi: 10.1091/mbc.E11-11-0926. Epub 2012 Apr 25. Mol Biol Cell. 2012. PMID: 22535522 Free PMC article.
-
Anastasis Drives Senescence and Non-Cell Autonomous Neurodegeneration in the Astrogliopathy Alexander Disease.J Neurosci. 2022 Mar 23;42(12):2584-2597. doi: 10.1523/JNEUROSCI.1659-21.2021. Epub 2022 Feb 1. J Neurosci. 2022. PMID: 35105675 Free PMC article.
Cited by
-
Sublethal engagement of apoptotic pathways in residual cancer.Trends Cell Biol. 2024 Mar;34(3):225-238. doi: 10.1016/j.tcb.2023.07.005. Epub 2023 Aug 10. Trends Cell Biol. 2024. PMID: 37573235 Review.
-
Stressed neuronal cells can recover from profound membrane blebbing, nuclear condensation and mitochondrial fragmentation, but not from cytochrome c release.Sci Rep. 2023 Jul 8;13(1):11045. doi: 10.1038/s41598-023-38210-w. Sci Rep. 2023. PMID: 37422517 Free PMC article.
-
Beyond Death: Unmasking the Intricacies of Apoptosis Escape.Mol Diagn Ther. 2024 Jul;28(4):403-423. doi: 10.1007/s40291-024-00718-w. Epub 2024 Jun 18. Mol Diagn Ther. 2024. PMID: 38890247 Free PMC article. Review.
References
Publication types
MeSH terms
Substances
Grants and funding
LinkOut - more resources
Full Text Sources
Molecular Biology Databases
Miscellaneous
