Differentially expressed genes and miRNAs in female osteoporosis patients
- PMID: 35839011
- PMCID: PMC11132388
- DOI: 10.1097/MD.0000000000029856
Differentially expressed genes and miRNAs in female osteoporosis patients
Abstract
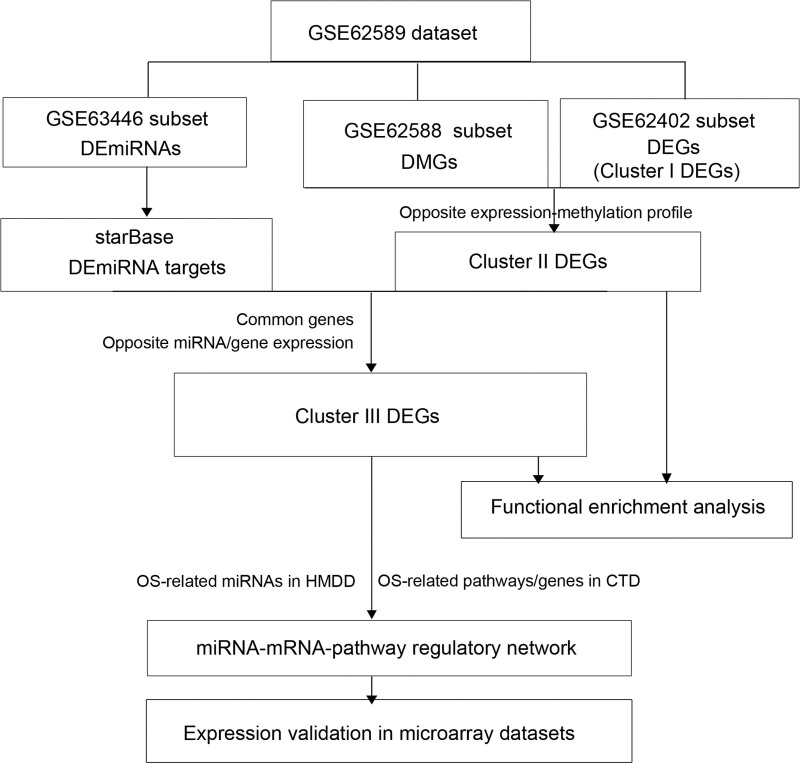
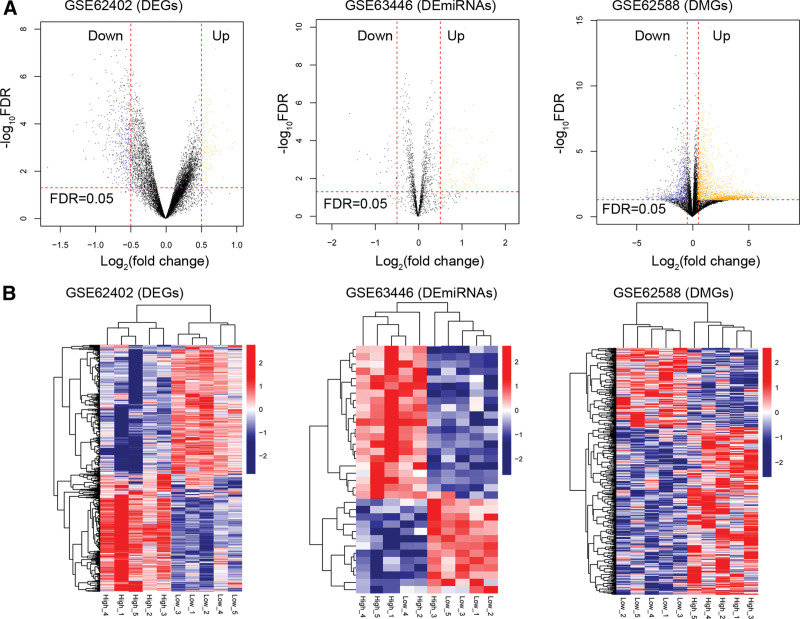
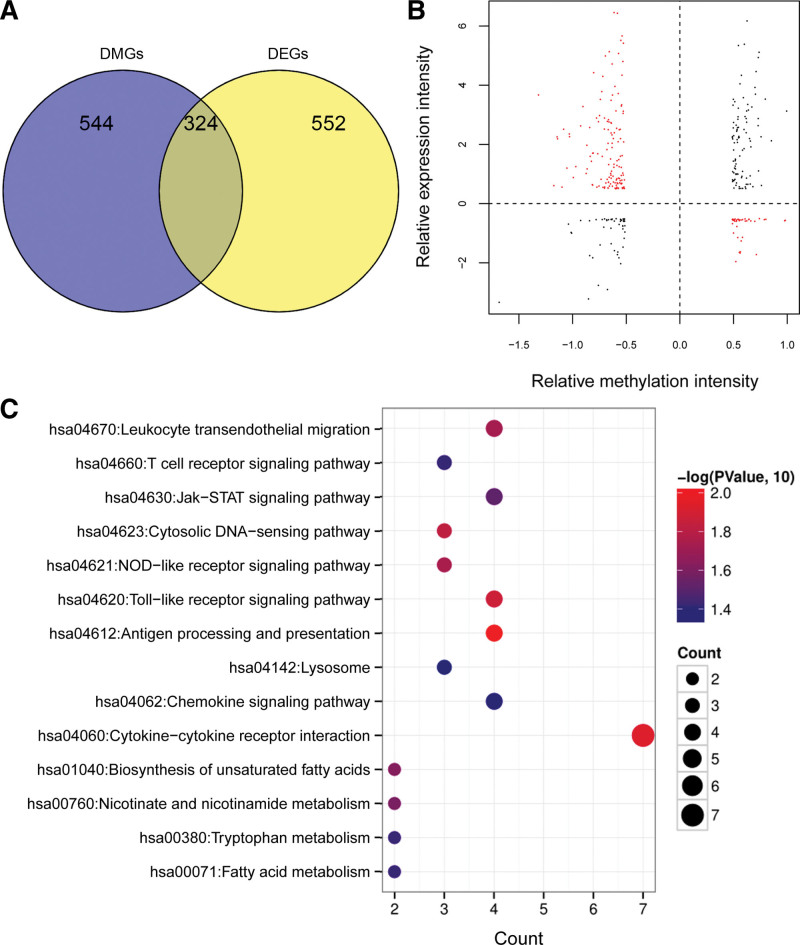
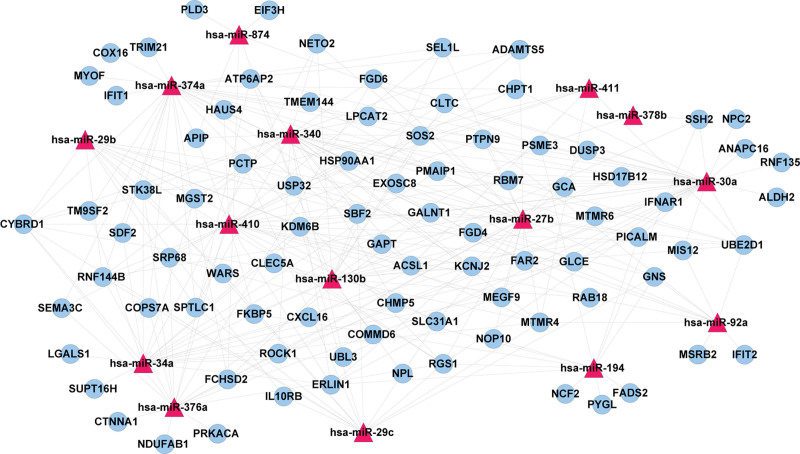
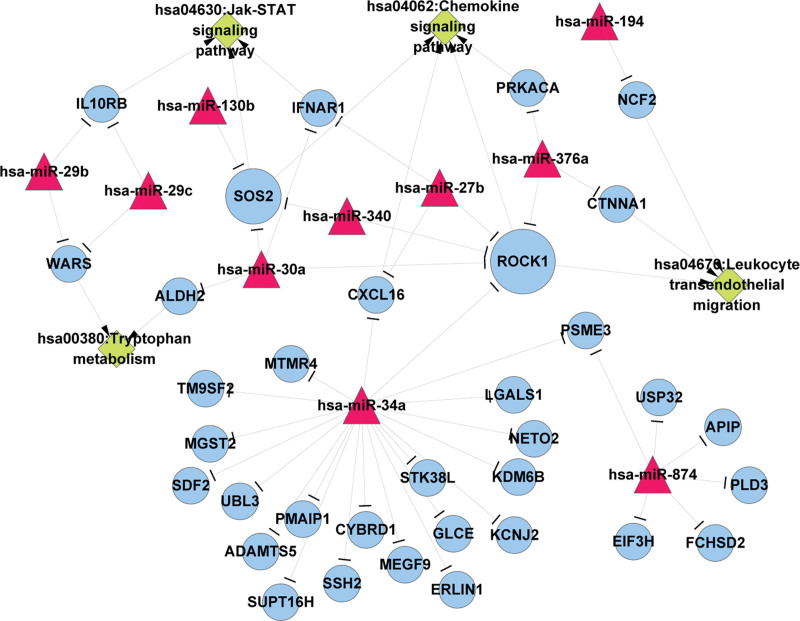
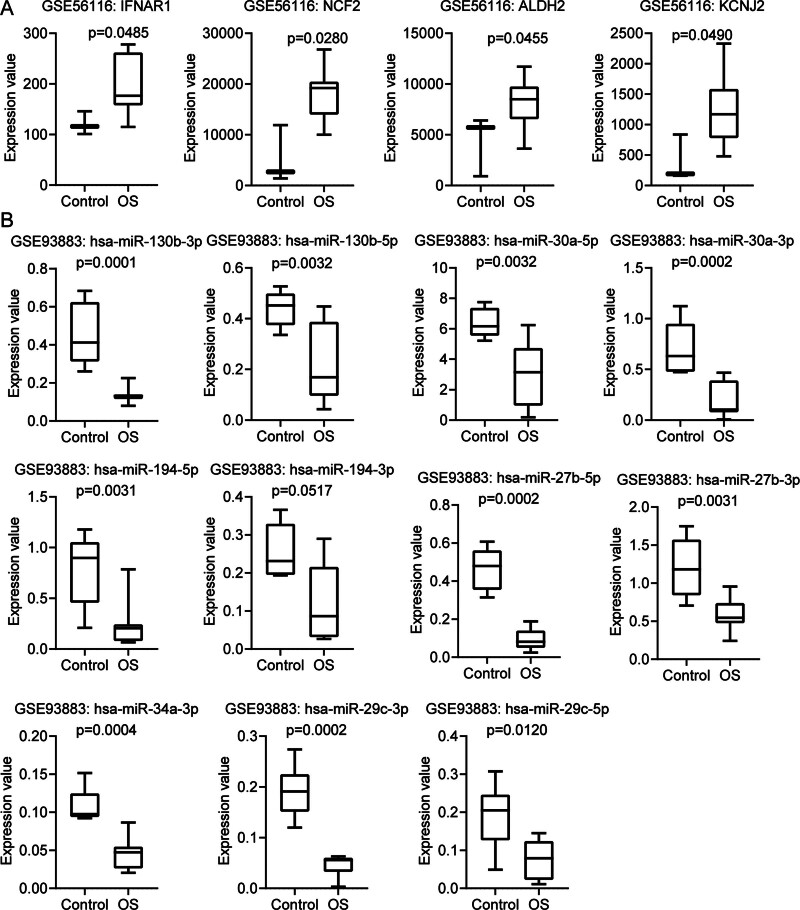
Osteoporosis is characterized by lowing bone mineral density. This study aimed to investigate the genes, miRNAs, pathways, and miRNA-gene interaction pairs involved in the pathogenesis of female osteoporosis. The differentially expressed genes (DEGs, GSE62402), differentially expressed miRNAs (DEmiRNAs, GSE63446), and differentially methylated genes (GSE62588) between females with low- and high-hip bone mineral density were identified. Genes common to DEGs, differentially methylated genes, DEmiRNAs' targets, and osteoporosis-related genes were retained and used to construct the miRNA-mRNA-pathway regulatory network. The expression of hub nodes was validated in microarray datasets (genes in GSE56116 and miRNAs in GSE93883). Thirty-four DEmiRNAs and 179 DEGs with opposite expression-methylation profiles were identified. Functional enrichment analysis showed that DEGs were associated with pathways including "hsa00380:Tryptophan metabolism," "hsa04670:Leukocyte transendothelial migration," "hsa04630:Jak-STAT signaling pathway," and "hsa04062:Chemokine signaling pathway." The miRNA-mRNA-pathway network included 10 DEGs, 9 miRNAs, and 4 osteoporosis-related pathways. The miRNA-gene-pathway axes including hsa-miR-27b-5p/3p-IFNAR1-hsa04630, hsa-miR-30a-5p/3p-IFNAR1-hsa04630, hsa-miR-30a-5p/3p-ALDH2-hsa00380, and hsa-miR-194-5p/3p-NCF2-hsa04670 were included in the network. Microarray validation showed that IFNAR1, NCF2, and ALDH2 were upregulated, and hsa-miR-30a-3p/5p, hsa-miR-194-3p/5p, hsa-miR-27b-3p/5p, and hsa-miR-34a-3p were downregulated in osteoporotic samples compared with control. Axes including hsa-miR-27b/30a-IFNAR1-Jak-STAT signaling pathway, hsa-miR-30a-ALDH2-Tryptophan metabolism, and hsa-miR-194-NCF2-Leukocyte transendothelial migration were involved in osteoporosis pathogenesis.
Copyright © 2022 the Author(s). Published by Wolters Kluwer Health, Inc.
Conflict of interest statement
The authors have no conflicts of interest to disclose.
Figures
Similar articles
-
Searching for valuable differentially expressed miRNAs in postmenopausal osteoporosis by RNA sequencing.J Obstet Gynaecol Res. 2020 Jul;46(7):1183-1192. doi: 10.1111/jog.14307. Epub 2020 May 19. J Obstet Gynaecol Res. 2020. PMID: 32429001
-
Screening for genes, miRNAs and transcription factors of adipogenic differentiation and dedifferentiation of mesenchymal stem cells.J Orthop Surg Res. 2023 Jan 17;18(1):46. doi: 10.1186/s13018-023-03514-0. J Orthop Surg Res. 2023. PMID: 36647068 Free PMC article.
-
Identification of the differential expression of genes and upstream microRNAs in small cell lung cancer compared with normal lung based on bioinformatics analysis.Medicine (Baltimore). 2020 Mar;99(11):e19086. doi: 10.1097/MD.0000000000019086. Medicine (Baltimore). 2020. PMID: 32176034 Free PMC article.
-
A Next-Generation Sequencing of Plasma Exosome-Derived microRNAs and Target Gene Analysis with a Microarray Database of Thermally Injured Skins: Identification of Blood-to-Tissue Interactions at Early Burn Stage.J Inflamm Res. 2021 Dec 10;14:6783-6798. doi: 10.2147/JIR.S343956. eCollection 2021. J Inflamm Res. 2021. PMID: 34916825 Free PMC article.
-
miRNA and leptin signaling in metabolic diseases and at extreme environments.Pharmacol Res Perspect. 2024 Aug;12(4):e1248. doi: 10.1002/prp2.1248. Pharmacol Res Perspect. 2024. PMID: 39017237 Free PMC article. Review.
Cited by
-
In-depth exploration of the shared genetic signature and molecular mechanisms between end-stage renal disease and osteoporosis.Front Genet. 2023 Nov 24;14:1159868. doi: 10.3389/fgene.2023.1159868. eCollection 2023. Front Genet. 2023. PMID: 38075679 Free PMC article.
-
[Liuwei Dihuang Pills alleviates postmenopausal osteoporosis and fatigue in rats by inhibiting the epigenetic regulatory molecule BRD4 pathway].Nan Fang Yi Ke Da Xue Xue Bao. 2023 Dec 20;43(12):1998-2005. doi: 10.12122/j.issn.1673-4254.2023.12.02. Nan Fang Yi Ke Da Xue Xue Bao. 2023. PMID: 38189384 Free PMC article. Chinese.
-
The Involvement of microRNAs in Bone Remodeling Signaling Pathways and Their Role in the Development of Osteoporosis.Biology (Basel). 2024 Jul 7;13(7):505. doi: 10.3390/biology13070505. Biology (Basel). 2024. PMID: 39056698 Free PMC article. Review.
References
-
- Black DM, Rosen CJ. Postmenopausal osteoporosis. N Engl J Med. 2016;374:254–62. - PubMed
-
- Yasuda H. The mechanism of anti-RANKL antibody in the treatment of metabolic bone diseases including osteoporosis-possible applications of anti-RANKL antibody to the treatment of cancer patients. Nihon Yakurigaku Zasshi Folia Pharmacologica Japonica. 2019;153:11–5. - PubMed
-
- Lewiecki EM. RANK ligand inhibition with denosumab for the management of osteoporosis. Expert Opin Biol Ther. 2006;6:1041–50. - PubMed
MeSH terms
Substances
LinkOut - more resources
Full Text Sources
Medical
Miscellaneous