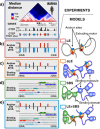
Loop-extrusion and polymer phase-separation can co-exist at the single-molecule level to shape chromatin folding
- PMID: 35831310
- PMCID: PMC9279381
- DOI: 10.1038/s41467-022-31856-6
Loop-extrusion and polymer phase-separation can co-exist at the single-molecule level to shape chromatin folding
Abstract
Loop-extrusion and phase-separation have been proposed as mechanisms that shape chromosome spatial organization. It is unclear, however, how they perform relative to each other in explaining chromatin architecture data and whether they compete or co-exist at the single-molecule level. Here, we compare models of polymer physics based on loop-extrusion and phase-separation, as well as models where both mechanisms act simultaneously in a single molecule, against multiplexed FISH data available in human loci in IMR90 and HCT116 cells. We find that the different models recapitulate bulk Hi-C and average multiplexed microscopy data. Single-molecule chromatin conformations are also well captured, especially by phase-separation based models that better reflect the experimentally reported segregation in globules of the considered genomic loci and their cell-to-cell structural variability. Such a variability is consistent with two main concurrent causes: single-cell epigenetic heterogeneity and an intrinsic thermodynamic conformational degeneracy of folding. Overall, the model combining loop-extrusion and polymer phase-separation provides a very good description of the data, particularly higher-order contacts, showing that the two mechanisms can co-exist in shaping chromatin architecture in single cells.
© 2022. The Author(s).
Conflict of interest statement
The authors declare no competing interests.
Figures


Similar articles
-
Polymer physics indicates chromatin folding variability across single-cells results from state degeneracy in phase separation.Nat Commun. 2020 Jul 3;11(1):3289. doi: 10.1038/s41467-020-17141-4. Nat Commun. 2020. PMID: 32620890 Free PMC article.
-
Unveiling the Machinery behind Chromosome Folding by Polymer Physics Modeling.Int J Mol Sci. 2023 Feb 11;24(4):3660. doi: 10.3390/ijms24043660. Int J Mol Sci. 2023. PMID: 36835064 Free PMC article. Review.
-
Chromosome organization by one-sided and two-sided loop extrusion.Elife. 2020 Apr 6;9:e53558. doi: 10.7554/eLife.53558. Elife. 2020. PMID: 32250245 Free PMC article.
-
Physics-Based Polymer Models to Probe Chromosome Structure in Single Molecules.Methods Mol Biol. 2023;2655:57-66. doi: 10.1007/978-1-0716-3143-0_5. Methods Mol Biol. 2023. PMID: 37212988
-
Computational approaches from polymer physics to investigate chromatin folding.Curr Opin Cell Biol. 2020 Jun;64:10-17. doi: 10.1016/j.ceb.2020.01.002. Epub 2020 Feb 8. Curr Opin Cell Biol. 2020. PMID: 32045823 Review.
Cited by
-
Chromatin accessibility: methods, mechanisms, and biological insights.Nucleus. 2022 Dec;13(1):236-276. doi: 10.1080/19491034.2022.2143106. Nucleus. 2022. PMID: 36404679 Free PMC article. Review.
-
Stochastic motion and transcriptional dynamics of pairs of distal DNA loci on a compacted chromosome.Science. 2023 Jun 30;380(6652):1357-1362. doi: 10.1126/science.adf5568. Epub 2023 Jun 29. Science. 2023. PMID: 37384691 Free PMC article.
-
Guiding the design of well-powered Hi-C experiments to detect differential loops.Bioinform Adv. 2023 Oct 16;3(1):vbad152. doi: 10.1093/bioadv/vbad152. eCollection 2023. Bioinform Adv. 2023. PMID: 38023330 Free PMC article.
-
The dynamics of three-dimensional chromatin organization and phase separation in cell fate transitions and diseases.Cell Regen. 2022 Dec 21;11(1):42. doi: 10.1186/s13619-022-00145-4. Cell Regen. 2022. PMID: 36539553 Free PMC article. Review.
-
Phase Separation: Direct and Indirect Driving Force for High-Order Chromatin Organization.Genes (Basel). 2023 Feb 15;14(2):499. doi: 10.3390/genes14020499. Genes (Basel). 2023. PMID: 36833426 Free PMC article. Review.
References
Publication types
MeSH terms
Substances
Grants and funding
LinkOut - more resources
Full Text Sources

