

GOS Ameliorates Nonalcoholic Fatty Liver Disease Induced by High Fat and High Sugar Diet through Lipid Metabolism and Intestinal Microbes
- PMID: 35807929
- PMCID: PMC9268751
- DOI: 10.3390/nu14132749
GOS Ameliorates Nonalcoholic Fatty Liver Disease Induced by High Fat and High Sugar Diet through Lipid Metabolism and Intestinal Microbes
Abstract
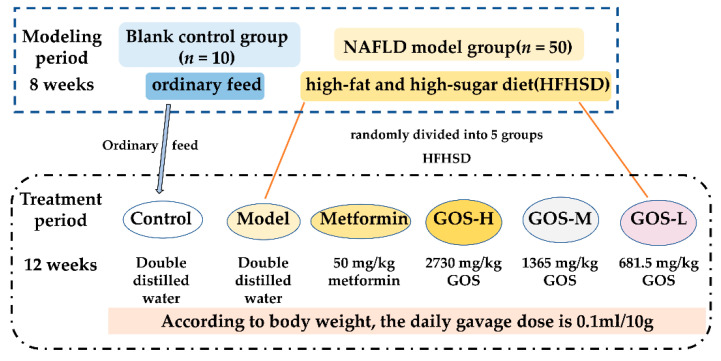
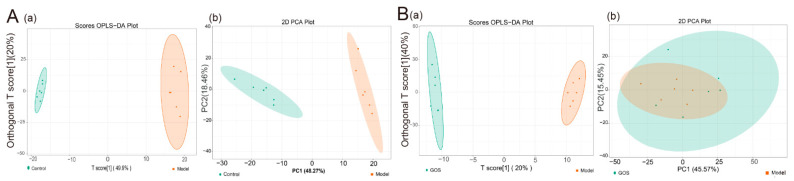
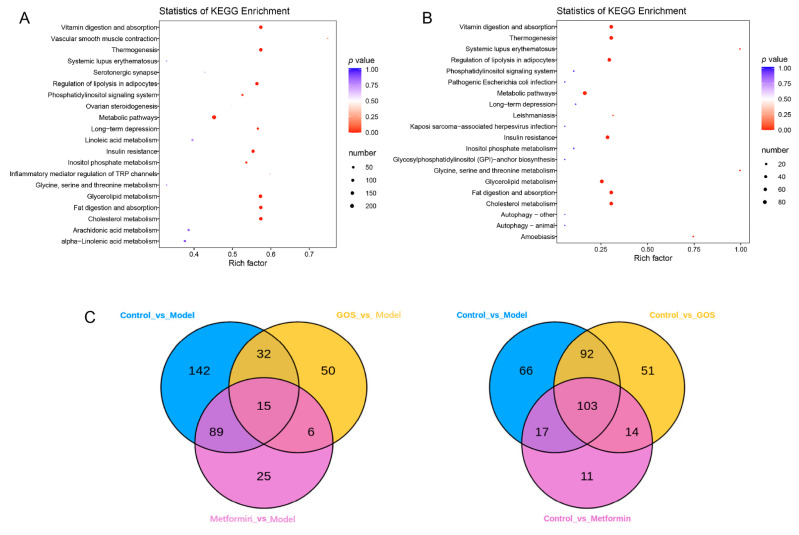
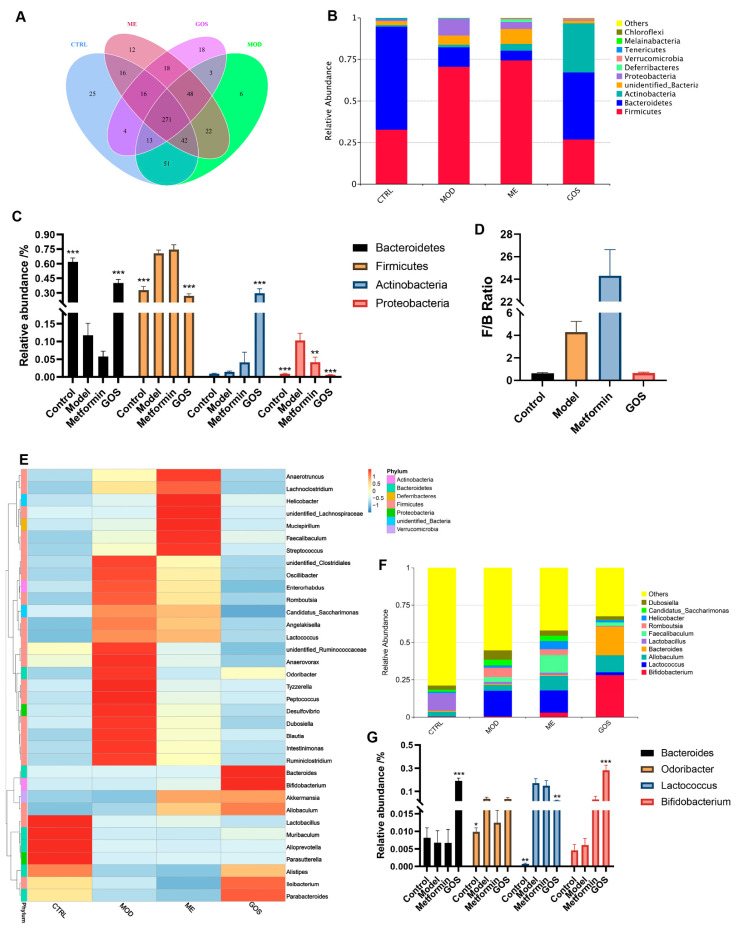
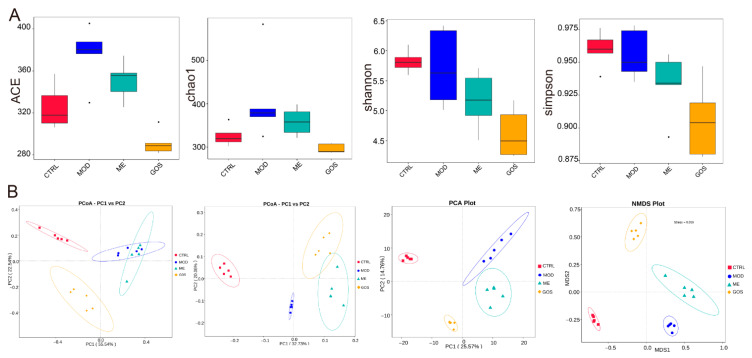
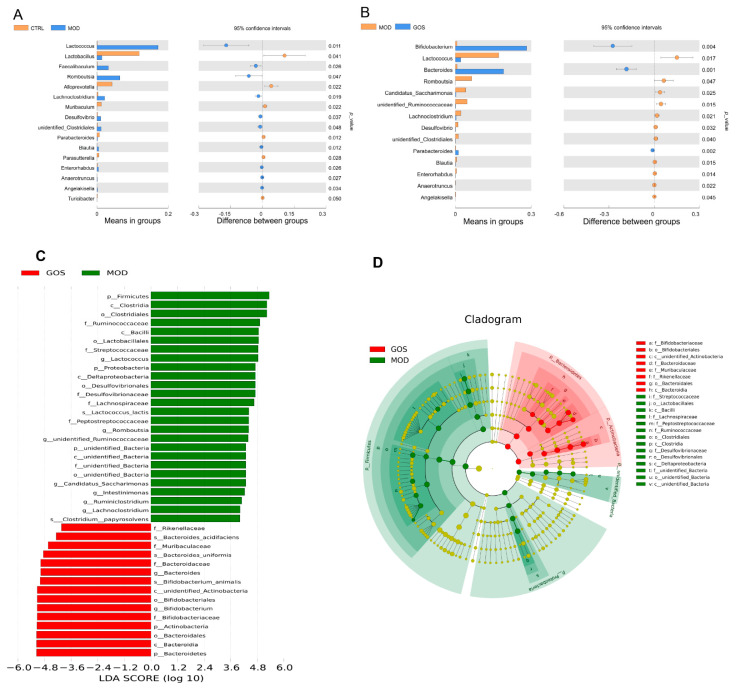
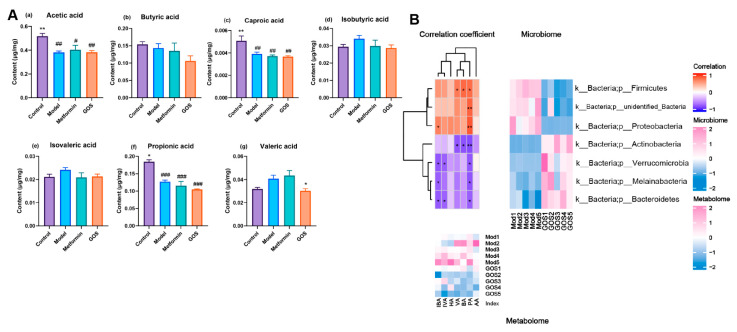
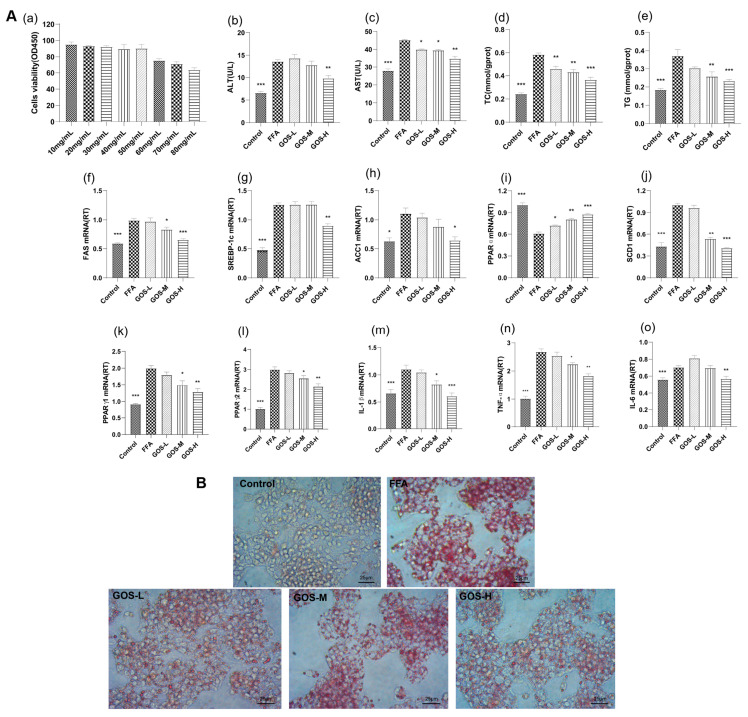
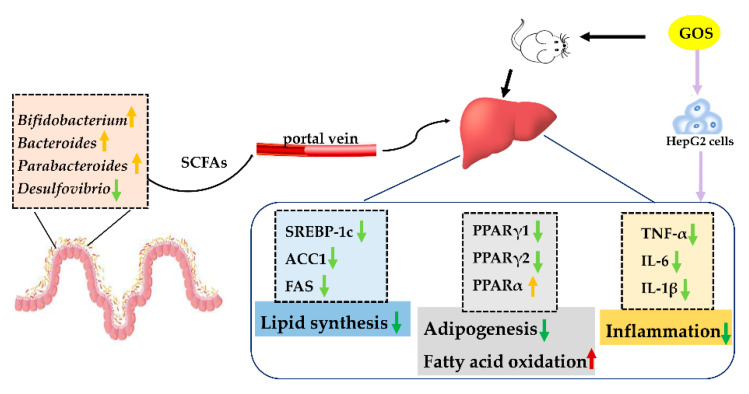
The treatment of nonalcoholic fatty liver disease (NAFLD) remains very challenging. This study investigated the therapeutic effect of galactose oligosaccharide (GOS), an important prebiotic, on NAFLD through in vivo and in vitro experiments and preliminarily explored the mechanism by which GOS improves liver lipid metabolism and inflammation through liver and intestinal microbiological analysis. The results of mouse liver lipidomics showed that GOS could promote body thermogenesis in mice with high-fat and high-sugar diet (HFHSD)-induced NAFLD, regulate lipolysis in liver fat cells, and accelerate glycine and cholesterol metabolism. GOS dose-dependently reduced the contents of total cholesterol (TC) and triglyceride (TG) in cells and reduced the accumulation of lipid droplets in cells. GOS also reduced the Firmicutes/Bacteroidetes ratio and altered the composition of the intestinal microbiota in mice fed a HFHSD. GOS can improve liver lipid metabolism and intestinal structure of NAFLD. These results provide a theoretical and experimental basis supporting the use of GOS as a health food with anti-NAFLD functions.
Keywords: galactose oligosaccharide; inflammation; intestinal microbes; lipid metabolism; nonalcoholic fatty liver disease; prebiotics.
Conflict of interest statement
The authors declare no conflict of interest.
Figures

Similar articles
-
Glucosamine Improves Non-Alcoholic Fatty Liver Disease Induced by High-Fat and High-Sugar Diet through Regulating Intestinal Barrier Function, Liver Inflammation, and Lipid Metabolism.Molecules. 2023 Oct 3;28(19):6918. doi: 10.3390/molecules28196918. Molecules. 2023. PMID: 37836761 Free PMC article.
-
Protective effect of quercetin on high-fat diet-induced non-alcoholic fatty liver disease in mice is mediated by modulating intestinal microbiota imbalance and related gut-liver axis activation.Free Radic Biol Med. 2017 Jan;102:188-202. doi: 10.1016/j.freeradbiomed.2016.11.037. Epub 2016 Nov 25. Free Radic Biol Med. 2017. PMID: 27890642
-
Sex-specific maternal calcium requirements for the prevention of nonalcoholic fatty liver disease by altering the intestinal microbiota and lipid metabolism in the high-fat-diet-fed offspring mice.Gut Microbes. 2020 Nov 1;11(6):1590-1607. doi: 10.1080/19490976.2020.1768645. Epub 2020 Jun 24. Gut Microbes. 2020. PMID: 32576050 Free PMC article.
-
Diet-Induced Models of Non-Alcoholic Fatty Liver Disease: Food for Thought on Sugar, Fat, and Cholesterol.Cells. 2021 Jul 16;10(7):1805. doi: 10.3390/cells10071805. Cells. 2021. PMID: 34359974 Free PMC article. Review.
-
Nonalcoholic Fatty Liver Disease Induced by High-Fat Diet in C57bl/6 Models.Nutrients. 2019 Dec 16;11(12):3067. doi: 10.3390/nu11123067. Nutrients. 2019. PMID: 31888190 Free PMC article. Review.
Cited by
-
Subchronic toxic effects of bisphenol A on the gut-liver-hormone axis in rats via intestinal flora and metabolism.Front Endocrinol (Lausanne). 2024 Aug 29;15:1415216. doi: 10.3389/fendo.2024.1415216. eCollection 2024. Front Endocrinol (Lausanne). 2024. PMID: 39268238 Free PMC article.
-
Developmental Changes of Duckling Liver and Isolation of Primary Hepatocytes.Animals (Basel). 2023 May 31;13(11):1820. doi: 10.3390/ani13111820. Animals (Basel). 2023. PMID: 37889689 Free PMC article.
-
Tartary Buckwheat (Fagopyrum tataricum) Ameliorates Lipid Metabolism Disorders and Gut Microbiota Dysbiosis in High-Fat Diet-Fed Mice.Foods. 2022 Sep 29;11(19):3028. doi: 10.3390/foods11193028. Foods. 2022. PMID: 36230104 Free PMC article.
-
The effect of different boron compounds on nutrient digestibility, intestinal nutrient transporters, and liver lipid metabolism.Turk J Med Sci. 2023 Jun;53(3):619-629. doi: 10.55730/1300-0144.5624. Epub 2023 Jun 19. Turk J Med Sci. 2023. PMID: 37476906 Free PMC article.
-
Galacto-Oligosaccharide Alleviates Alcohol-Induced Liver Injury by Inhibiting Oxidative Stress and Inflammation.Metabolites. 2022 Sep 15;12(9):867. doi: 10.3390/metabo12090867. Metabolites. 2022. PMID: 36144271 Free PMC article.
References
-
- Stratakis N., Golden-Mason L., Margetaki K., Zhao Y., Valvi D., Garcia E., Maitre L., Andrusaityte S., Basagana X., Borràs E., et al. In Utero Exposure to Mercury Is Associated with Increased Susceptibility to Liver Injury and Inflammation in Childhood. Hepatology. 2021;74:1546–1559. doi: 10.1002/hep.31809. - DOI - PMC - PubMed
-
- Mouries J., Brescia P., Silvestri A., Spadoni I., Sorribas M., Wiest R., Mileti E., Galbiati M., Invernizzi P., Adorini L., et al. Microbiota-driven gut vascular barrier disruption is a prerequisite for non-alcoholic steatohepatitis development. J. Hepatol. 2019;71:1216–1228. doi: 10.1016/j.jhep.2019.08.005. - DOI - PMC - PubMed
-
- Wong V.W.-S., Wong G.L.-H., Chan R.S.-M., Shu S.S.-T., Cheung B.H.-K., Li L.S., Chim A.M.-L., Chan C.K.-M., Leung J.K.-Y., Chu W.C.-W., et al. Beneficial effects of lifestyle intervention in non-obese patients with non-alcoholic fatty liver disease. J. Hepatol. 2018;69:1349–1356. doi: 10.1016/j.jhep.2018.08.011. - DOI - PubMed
MeSH terms
Substances
Grants and funding
LinkOut - more resources
Full Text Sources
Medical
Miscellaneous
