. 2022 Sep 2;82(17):3002-3015.
doi: 10.1158/0008-5472.CAN-21-2519.

Efficient Correction of Oncogenic KRAS and TP53 Mutations through CRISPR Base Editing

Affiliations

Efficient Correction of Oncogenic KRAS and TP53 Mutations through CRISPR Base Editing

Shady Sayed et al. Cancer Res. .

Abstract

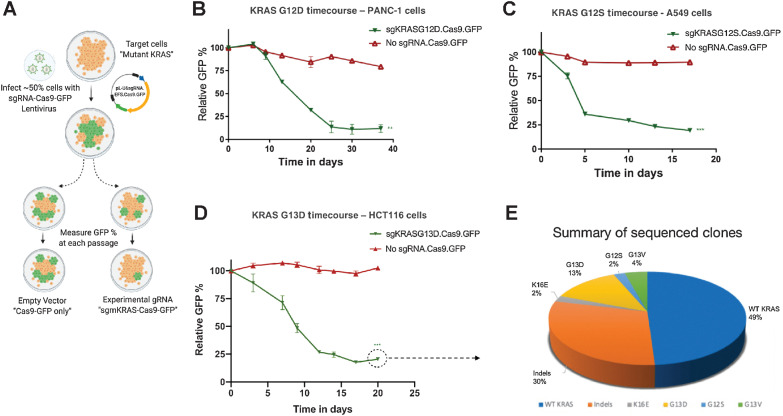
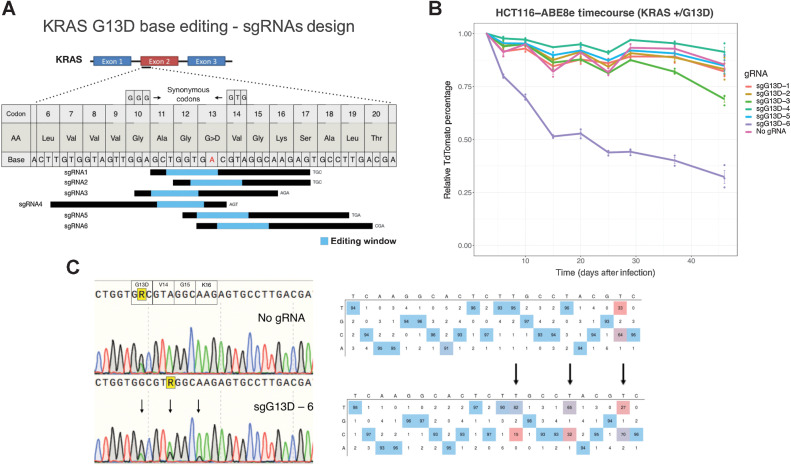
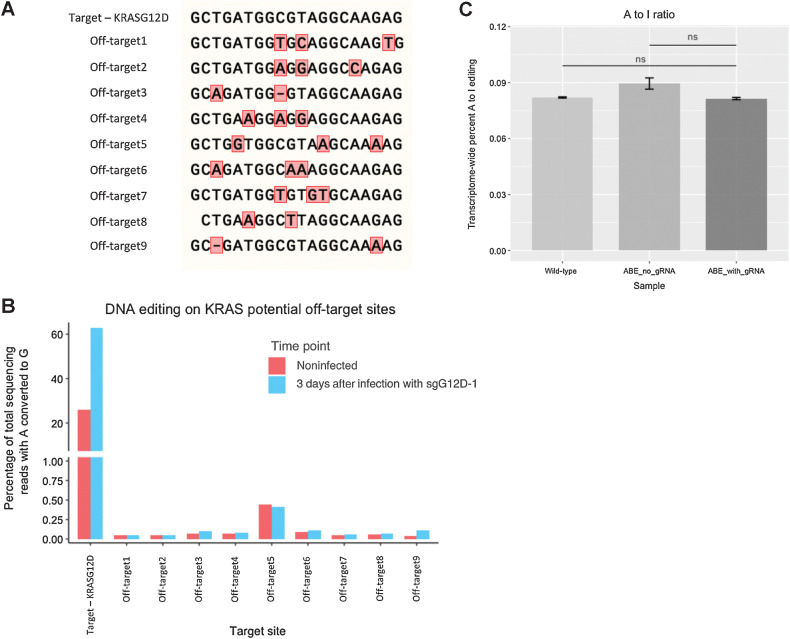
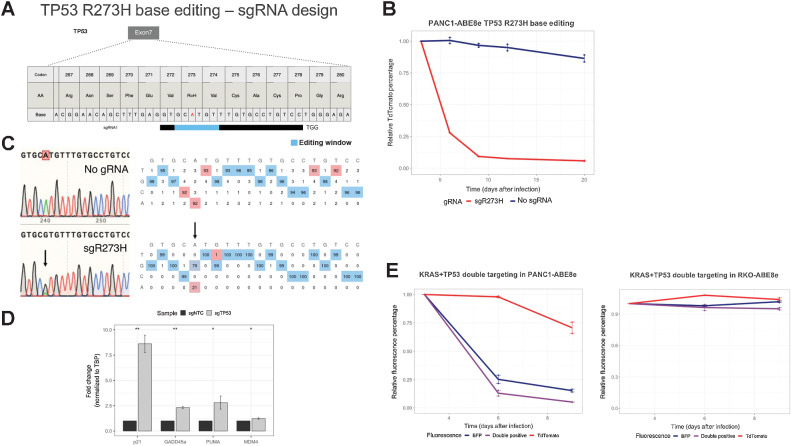
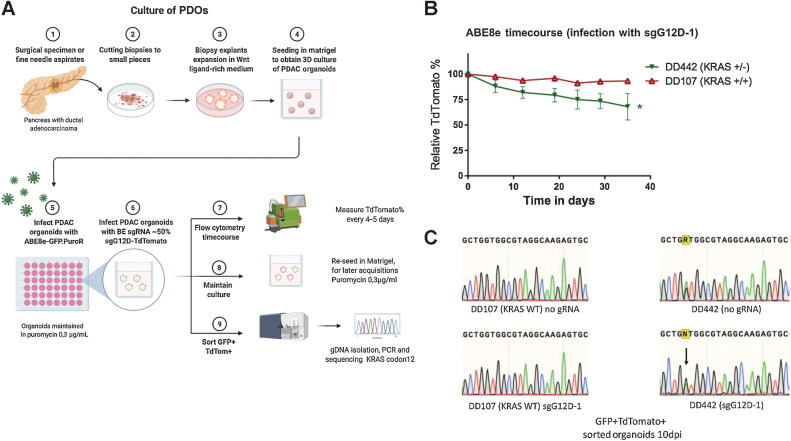
KRAS is the most frequently mutated oncogene in human cancer, and its activating mutations represent long-sought therapeutic targets. Programmable nucleases, particularly the CRISPR-Cas9 system, provide an attractive tool for genetically targeting KRAS mutations in cancer cells. Here, we show that cleavage of a panel of KRAS driver mutations suppresses growth in various human cancer cell lines, revealing their dependence on mutant KRAS. However, analysis of the remaining cell population after long-term Cas9 expression unmasked the occurence of oncogenic KRAS escape variants that were resistant to Cas9-cleavage. In contrast, the use of an adenine base editor to correct oncogenic KRAS mutations progressively depleted the targeted cells without the appearance of escape variants and allowed efficient and simultaneous correction of a cancer-associated TP53 mutation. Oncogenic KRAS and TP53 base editing was possible in patient-derived cancer organoids, suggesting that base editor approaches to correct oncogenic mutations could be developed for functional interrogation of vulnerabilities in a personalized manner for future precision oncology applications.

Significance: Repairing KRAS mutations with base editors can be used for providing a better understanding of RAS biology and may lay the foundation for improved treatments for KRAS-mutant cancers.


Figures

Figure 1. CRISPR-Cas9 cleavage of different mutant KRAS alleles. A, Schematic presentation of the competition assay. Mutant cells are transduced at a rate of ∼50% with an all-in-one sgRNA-Cas9-GFP lentivirus designed to target the mutation. Relative abundance of the transduced population (GFP+ cells) is measured over time via flow cytometry. B–D, Relative abundance of cells treated with indicated sgRNA targeting KRAS G12D, G12S, G13D mutation in PANC-1, A549, and HCT116 cells, respectively, are shown over time as a function of GFP% relative to day zero. In all three experiments, the day zero timepoint refers to 3 days after infection, the initial timepoint for measuring GFP signal. Note that in PANC-1 and HCT116 cell lines, the GFP signal increased slightly after the initial timepoint, likely because more cells started to express the fluorescent transgene, resulting in relative GFP levels above 100%. Error bars present mean ± SD from experiments performed in technical triplicates. Significance was assessed using the Studen t test comparing the mean percentage at end point of experimental sgRNA to that of no sgRNA (**, P < 0.005; ***, P < 0.0005). The dotted circle/arrow marks the time point of analyzing GFP+ clones for their KRAS-WT allele. E, Genetic makeup of persisting GFP+ cells at the KRAS cleavage site. The pie chart represents the sum of mutations observed at the codon 13 cut site.
Figure 1.
CRISPR-Cas9 cleavage of different mutant KRAS alleles. A, Schematic presentation of the competition assay. Mutant cells are transduced at a rate of ∼50% with an all-in-one sgRNA-Cas9-GFP lentivirus designed to target the mutation. Relative abundance of the transduced population (GFP+ cells) is measured over time via flow cytometry. BD, Relative abundance of cells treated with indicated sgRNA targeting KRAS G12D, G12S, G13D mutation in PANC-1, A549, and HCT116 cells, respectively, is shown over time as a function of GFP% relative to day zero. In all three experiments, the day zero time point refers to 3 days after infection, the initial time point for measuring GFP signal. Note that in PANC-1 and HCT116 cell lines, the GFP signal increased slightly after the initial time point, likely because more cells started to express the fluorescent transgene, resulting in relative GFP levels above 100%. Error bars present mean ± SD from experiments performed in technical triplicates. Significance was assessed using the Student t test comparing the mean percentage at end point of experimental sgRNA to that of no sgRNA. **, P < 0.005; ***, P < 0.0005. The dotted circle/arrow marks the time point of analyzing GFP+ clones for their KRAS-WT allele. E, Genetic makeup of persisting GFP+ cells at the KRAS cleavage site. The pie chart represents the sum of mutations observed at the codon 13 cut site.
Figure 2. Base editing of mutant KRAS G12S in A549 cells. A, Schematic presentation of the adenine base editing strategy. Important steps are highlighted by arrows. B, Overview of the employed sgRNAs to repair the G12S mutation. sgRNA alignments with respect to the mutation (red “A”) are shown. The hypothetical editing window (blue) and the chosen PAM sequences are presented. Potential bystander base editing of surrounding A-bases (G10 and V14) would yield the same amino acid due to synonymous codons (two small arrows). AA, amino acid. C, Time course of KRAS G12S base editing in A549 cells with indicated sgRNAs. The relative abundance of cells treated with mutation-targeting gRNAs or an empty vector control are shown as percentage of TdTomato-positive cells over time, relative to 3 days after infection. Error bars represent means ± SD from biological triplicates performed in three independent experiments. D, Representative chromatograms of sequenced DNA isolated from cells treated with sgG12S-2 (bottom) in comparison with cells treated with empty vector control (top), 12 days after infection. The G12S homozygous mutation is highlighted in a red box. In the bottom panel, arrows highlight editing activity shown as “G” peaks in black. Note the synonymous bystander edit at a second “A” (dashed arrow).
Figure 2.
Base editing of mutant KRAS G12S in A549 cells. A, Schematic presentation of the adenine base editing strategy. Important steps are highlighted by arrows. B, Overview of the employed sgRNAs to repair the G12S mutation. sgRNA alignments with respect to the mutation (red “A”) are shown. The hypothetical editing window (blue) and the chosen PAM sequences are presented. Potential bystander base editing of surrounding A-bases (G10 and V14) would yield the same amino acid due to synonymous codons (two small arrows). AA, amino acid. C, Time course of KRAS G12S base editing in A549 cells with indicated sgRNAs. The relative abundance of cells treated with mutation-targeting gRNAs or an empty vector control are shown as percentage of TdTomato-positive cells over time, relative to 3 days after infection. Error bars represent means ± SD from biological triplicates performed in three independent experiments. D, Representative chromatograms of sequenced DNA isolated from cells treated with sgG12S-2 (bottom) in comparison with cells treated with empty vector control (top) 12 days after infection. The G12S homozygous mutation is highlighted in a red box. In the bottom panel, arrows highlight editing activity shown as “G” peaks in black. Note the synonymous bystander edit at a second “A.”
Figure 3. Base editing of mutant KRAS G13D in HCT116 cells. A, Overview of the employed sgRNAs to repair the G13D mutation. sgRNA alignments with respect to the mutation (red “A”) are shown. The hypothetical editing windows (blue) and the chosen sgRNA lengths and PAM sequences are presented. Potential bystander base editing of surrounding A-bases is illustrated as synonymous/nonsynonimous codons. B, Time course of KRAS G13D base editing in HCT116 cells with indicated sgRNAs. The relative abundance of cells treated with six sgRNAs in addition to an empty vector control are shown as percentage of TdTomato-positive cells over time, relative to 3 days after infection. Error bars represent means ± SD from biological triplicates performed in three independent experiments. C, (Left) Representative chromatograms (12 days after infection) of cells treated with sgRNA6 (bottom) in comparison with cells treated with empty vector control (top). The G13D mutation is highlighted in a yellow box. Edited “A”s, including bystander edits, are indicated by arrows in the bottom panel. (Right) EditR Quantification of base editing efficiency indicating the 22bp sgG13D-6 sequence, representing base percentages of the empty vector control (top) and edited base percentages in cells treated with sgG13D-6 (bottom).
Figure 3.
Base editing of mutant KRAS G13D in HCT116 cells. A, Overview of the employed sgRNAs to repair the G13D mutation. sgRNA alignments with respect to the mutation (red “A”) are shown. The hypothetical editing windows (blue) and the chosen sgRNA lengths and PAM sequences are presented. Potential bystander base editing of surrounding A-bases is illustrated as synonymous/nonsynonimous codons. B, Time course of KRAS G13D base editing in HCT116 cells with indicated sgRNAs. The relative abundance of cells treated with six sgRNAs in addition to an empty vector control is shown as percentage of TdTomato-positive cells over time, relative to 3 days after infection. Error bars represent means ± SD from biological triplicates performed in three independent experiments. C, Left, representative chromatograms of cells treated with sgRNA6 (bottom) in comparison with cells treated with empty vector control (top) 12 days after infection. The G13D mutation is highlighted in a yellow box. Edited “A”s, including bystander edits, are indicated by arrows in the bottom panel. Right, EditR quantification of base editing efficiency indicating the 22 bp sgG13D-6 sequence, representing base percentages of the empty vector control (top) and edited base percentages in cells treated with sgG13D-6 (bottom).
Figure 4. Base editing of mutant KRAS G12D in PANC-1 cells. A, Overview of the employed sgRNAs to repair the G12D mutation. sgRNA alignments with respect to the mutation (red “A”) are shown. The hypothetical editing windows (blue) and the chosen PAM sequences are presented. Potential bystander base editing of surrounding A-bases is illustrated as synonymous codons. B, Time course of KRAS G12D base editing in PANC-1 cells with indicated sgRNAs. The relative abundance of cells treated with six sgRNAs in addition to an empty vector control are shown as the percentage of TdTomato-positive cells over time, relative to 3 days after infection. Error bars represent means ± SD from biological triplicates performed in three independent experiments. C, (Left) Representative chromatograms of cells treated with sgRNA1 (bottom panel) in comparison with cells treated with the empty vector control (top), at 7dpi. The G12D mutation is highlighted in a red box. The edited “A” is indicated by an arrow. (Right) EditR Quantification of base editing efficiency indicating the 20bp sequence of sgRNA-1, representing base percentages of the empty vector control (top) and edited base percentages in cells treated with sgRNA1 (bottom). The edited “A” is indicated by an arrow. D, (Left) Representative FACS plots showing the cell cycle distribution of PANC-1 treated with highlighted sgRNAs; NTC, nontargeting gRNA control. (Right) Cell-cycle analyses of PANC-1-ABE8e cells after indicated treatments (N = 2). Flow cytometry analyses were performed 7 days after sgRNA treatment. E, Time-lapse microscopy analysis of treated PANC-1-ABE8e cells. Representative time-stamps of PANC-1 cells stably expressing ABE8e (green), after infection with sgG12D-1-TdTomato (red) are shown. A bursting cell is highlighted by white arrows. Scale bar: 50μmol/L.
Figure 4.
Base editing of mutant KRAS G12D in PANC-1 cells. A, Overview of the employed sgRNAs to repair the G12D mutation. sgRNA alignments with respect to the mutation (red “A”) are shown. The hypothetical editing windows (blue) and the chosen PAM sequences are presented. Potential bystander base editing of surrounding A-bases is illustrated as synonymous codons. B, Time course of KRAS G12D base editing in PANC-1 cells with indicated sgRNAs. The relative abundance of cells treated with six sgRNAs in addition to an empty vector control is shown as the percentage of TdTomato-positive cells over time, relative to 3 days after infection. Error bars represent means ± SD from biological triplicates performed in three independent experiments. C, Left, representative chromatograms of cells treated with sgRNA1 (bottom) in comparison with cells treated with the empty vector control (top) at 7 days after infection. The G12D mutation is highlighted in a red box. The edited “A” is indicated by an arrow. Right, EditR quantification of base editing efficiency indicating the 20 bp sequence of sgRNA-1, representing base percentages of the empty vector control (top) and edited base percentages in cells treated with sgRNA1 (bottom). The edited “A” is indicated by an arrow. D, Left, representative FACS plots showing the cell-cycle distribution of PANC-1 treated with highlighted sgRNAs. NTC, nontargeting gRNA control. Right, cell-cycle analyses of PANC-1-ABE8e cells after indicated treatments (N = 2). E, Time-lapse microscopy analysis of treated PANC-1-ABE8e cells. Representative time stamps of PANC-1 cells stably expressing ABE8e (green) after infection with sgG12D-1-TdTomato (red) are shown. White arrows, bursting cell. Scale bar, 50 μm.
Figure 5. Off-target analysis for ABE8e in PANC-1 cells. A, Alignment of predicted off-target sequences. The on-target sequence is indicated (sgG12D-1) while mismatches to the on-target site are shown in red boxes. B, Analysis of deep-sequencing results. The percentages of reads with an “A” to “G” conversion are shown for indicated target sites for control (red) and sgG12D-1 infected cells. C, Off-target transcriptome-wide A-to-I conversion analysis in cellular RNA. The error bars represent SEM calculated from two biological replicates.
Figure 5.
Off-target analysis for ABE8e in PANC-1 cells. A, Alignment of predicted off-target sequences. The on-target sequence is indicated (sgG12D-1) while mismatches to the on-target site are shown in red boxes. B, Analysis of deep-sequencing results. The percentages of reads with an “A” to “G” conversion are shown for indicated target sites for control (red) and sgG12D-1–infected cells. C, Off-target transcriptome-wide A-to-I conversion analysis in cellular RNA. The error bars represent SEM calculated from two biological replicates.
Figure 6. Base editing of mutant TP53 R273H in PANC-1 cells. A, Overview of the employed sgRNA to repair the R273H mutation. sgRNA alignment with respect to the mutation (red “A”) is shown. The hypothetical editing window (blue) and the chosen PAM sequence are presented. B, Time course of TP53 R273H base editing in PANC-1 cells. The relative abundance of cells treated with the sgRNA (sgR273H, red) in addition to an empty vector control (no sgRNA, blue) is shown as the percentage of TdTomato-positive cells over time, relative to 3 days after infection. Error bars represent means ± SD from biological triplicates performed in three independent experiments. C, (Left) Representative chromatograms of cells treated with sgR273H (bottom) in comparison with cells treated with the empty vector control (top), at 3dpi. The R273H mutation is highlighted in a red box. The edited “A” is indicated by an arrow. EditR Quantification of base editing efficiency indicating the 20bp sgR273H sequence, representing base percentages of the empty vector control (top) and edited base percentages in cells treated with sgR273H (bottom). The edited “A” is indicated by an arrow. D, RT-qPCR for p21, PUMA, GADD, MDM4, normalized to TBP as a housekeeping gene on RNA isolated at 48 hours after infection, from PANC-1 cells treated with the sgR273H sgRNA or with a nontargeting control sgRNA. Significance was assessed by a paired Student t test comparing the fold change of the assessed genes in the p53 sgRNA sample to that of sgNTC (*, P < 0.05; **, P < 0.01; N = 3). E, Time course of double targeting of KRAS G12D and TP53 R273H base editing in PANC-1 and RKO cells. The relative abundance of cells infected with sgR273H-BFP in conjunction with sgG12D-TdTomato is shown as the relative percentage of fluorescence over time, relative to 3 days after infection. Error bars represent means ± SD from biological replicates performed in two independent experiments.
Figure 6.
Base editing of mutant TP53 R273H in PANC-1 cells. A, Overview of the employed sgRNA to repair the R273H mutation. sgRNA alignment with respect to the mutation (red “A”) is shown. The hypothetical editing window (blue) and the chosen PAM sequence are presented. B, Time course of TP53 R273H base editing in PANC-1 cells. The relative abundance of cells treated with the sgRNA (sgR273H, red) in addition to an empty vector control (no sgRNA, blue) is shown as the percentage of TdTomato-positive cells over time, relative to 3 days after infection. Error bars represent means ± SD from biological triplicates performed in three independent experiments. C, Left, representative chromatograms of cells treated with sgR273H (bottom) in comparison with cells treated with the empty vector control (top) at 3 dpi. The R273H mutation is highlighted in a red box. The edited “A” is indicated by an arrow. EditR quantification of base editing efficiency indicating the 20 bp sgR273H sequence, representing base percentages of the empty vector control (top) and edited base percentages in cells treated with sgR273H (bottom). The edited “A” is indicated by an arrow. D, RT-qPCR for p21, PUMA, GADD, MDM4, normalized to TBP as a housekeeping gene on RNA isolated at 48 hours after infection, from PANC-1 cells treated with the sgR273H sgRNA or with a nontargeting control sgRNA. Significance was assessed by a paired Student t test comparing the fold change of the assessed genes in the p53 sgRNA sample to that of sgNTC. *, P < 0.05; **, P < 0.01; N = 3. E, Time course of double targeting of KRAS G12D and TP53 R273H base editing in PANC-1 and RKO cells. The relative abundance of cells infected with sgR273H-BFP in conjunction with sgG12D-TdTomato is shown as the relative percentage of fluorescence over time, relative to 3 days after infection. Error bars represent means ± SD from biological replicates performed in two independent experiments.
Figure 7. Base editing of mutant KRAS G12D in PDOs. A, Graphical presentation of the experimental set-up for base editing in organoids. Important steps are indicated by arrows. B, Time course of KRAS G12D base editing in indicated organoid lines. The relative abundance of cells treated with the G12D targeting sgRNA (sgG12D-1) in both lines are shown as the percentage of TdTomato-positive cells over time, relative to 5 days after infection, the initial timepoint for measuring TdTomato signal. Error bars represent means ± SD from biological triplicates performed in three independent experiments. Significance was assessed by Student t test comparing the mean percentage at end points of experimental sgRNA to that of no sgRNA (*, P < 0.05). C, Representative chromatograms (10 days after infection) of KRAS codon 12 treated with an empty vector control (top) and with sgG12D-1 (bottom) for the indicated organoid lines. The edited “A” in the DD442 line is highlighted by a red arrow.
Figure 7.
Base editing of mutant KRAS G12D in PDOs. A, Graphical presentation of the experimental set-up for base editing in organoids. Important steps are indicated by arrows. B, Time course of KRAS G12D base editing in indicated organoid lines. The relative abundance of cells treated with the G12D targeting sgRNA (sgG12D-1) in both lines is shown as the percentage of TdTomato-positive cells over time, relative to 5 days after infection, the initial time point for measuring TdTomato signal. Error bars represent means ± SD from biological triplicates performed in three independent experiments. Significance was assessed by Student t test comparing the mean percentage at end points of experimental sgRNA to that of no sgRNA. *, P < 0.05. C, Representative chromatograms of KRAS codon 12 treated with an empty vector control (top) and with sgG12D-1 (bottom) for the indicated organoid lines, at 10 days after infection. The edited “A” in the DD442 line is highlighted by an arrow.
Figure 8. Base editing of mutant TP53 R175H in PDOs. A, Overview of the employed sgRNA to repair the R175H mutation (sgR175H). An sgRNA alignment with respect to the mutation (red “A”) is shown. B, Time course of TP53 R175H base editing in DD663 organoids. The relative abundance of cells treated with the R175H targeting sgRNA (sgR175H) in addition to an empty vector control is shown as the percentage of TdTomato-positive cells over time, relative to 3 days after infection, the initial timepoint for measuring TdTomato signal (N = 1). C, Representative chromatograms of cells treated with sgR175H (bottom) in comparison with cells treated with the empty vector control (top), at 3dpi. The R175H mutation is highlighted in a red box. The edited “A” is indicated by an arrow. EditR quantification of base editing efficiency indicating the 20bp sequence of sgR175H, representing base percentages of the empty vector control (top) and edited base percentages in cells treated with sgR175H (bottom). The edited “A” is indicated by an arrow.
Figure 8.
Base editing of mutant TP53 R175H in PDOs. A, Overview of the employed sgRNA to repair the R175H mutation (sgR175H). An sgRNA alignment with respect to the mutation (red “A”) is shown. B, Time course of TP53 R175H base editing in DD663 organoids. The relative abundance of cells treated with the R175H targeting sgRNA (sgR175H) in addition to an empty vector control is shown as the percentage of TdTomato-positive cells over time, relative to 3 days after infection, the initial time point for measuring TdTomato signal (N = 1). C, Representative chromatograms of cells treated with sgR175H (bottom) in comparison with cells treated with the empty vector control (top) at 3 days post infection. The R175H mutation is highlighted in a red box. The edited “A” is indicated by an arrow. EditR quantification of base editing efficiency indicating the 20 bp sequence of sgR175H, representing base percentages of the empty vector control (top) and edited base percentages in cells treated with sgR175H (bottom). The edited “A” is indicated by an arrow.

Similar articles

Cited by

References

    1. Prior IA, Hood FE, Hartley JL. The frequency of Ras mutations in cancer. Cancer Res 2020;80:2969–74. - PMC - PubMed
    1. Cox AD, Fesik SW, Kimmelman AC, Luo J, Der CJ. Drugging the undruggable RAS: mission possible? Nat Rev Drug Discov 2014;13:828–51. - PMC - PubMed
    1. Haigis KM. KRAS alleles: the devil is in the detail. Trends Cancer 2017;3:886–97. - PMC - PubMed
    1. Papke B, Der CJ. Drugging RAS: know the enemy. Science 2017;355:1158–63. - PubMed
    1. Ostrem JML, Shokat KM. Direct small-molecule inhibitors of KRAS: from structural insights to mechanism-based design. Nat Rev Drug Discov 2016;15:771–85. - PubMed

Publication types

Substances