

Identification of genes and key pathways underlying the pathophysiological association between nonalcoholic fatty liver disease and atrial fibrillation
- PMID: 35790963
- PMCID: PMC9258143
- DOI: 10.1186/s12920-022-01300-1
Identification of genes and key pathways underlying the pathophysiological association between nonalcoholic fatty liver disease and atrial fibrillation
Abstract
Background: Atrial fibrillation (AF) is one of the most prevalent sustained cardiac arrhythmias. The latest studies have revealed a tight correlation between nonalcoholic fatty liver disease (NAFLD) and AF. However, the exact molecular mechanisms underlying the association between NAFLD and AF remain unclear. The current research aimed to expound the genes and signaling pathways that are related to the mechanisms underlying the association between these two diseases.
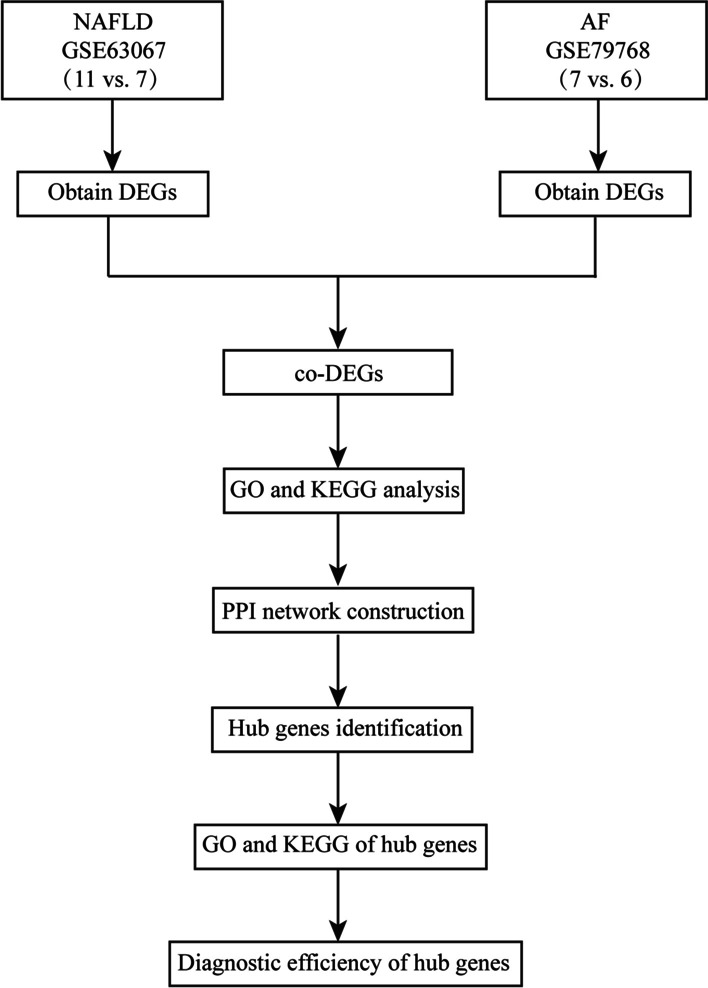
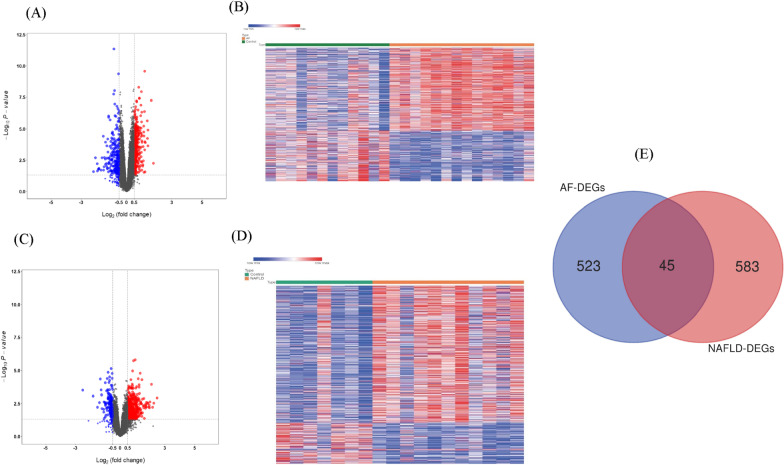
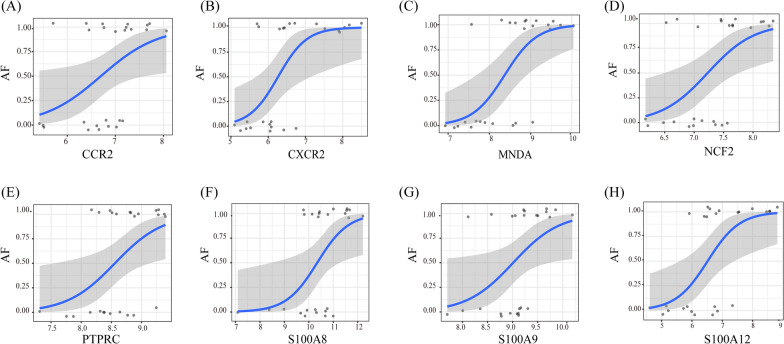
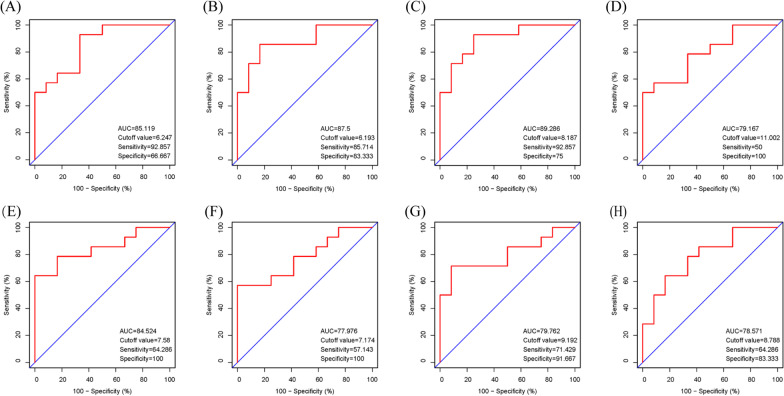
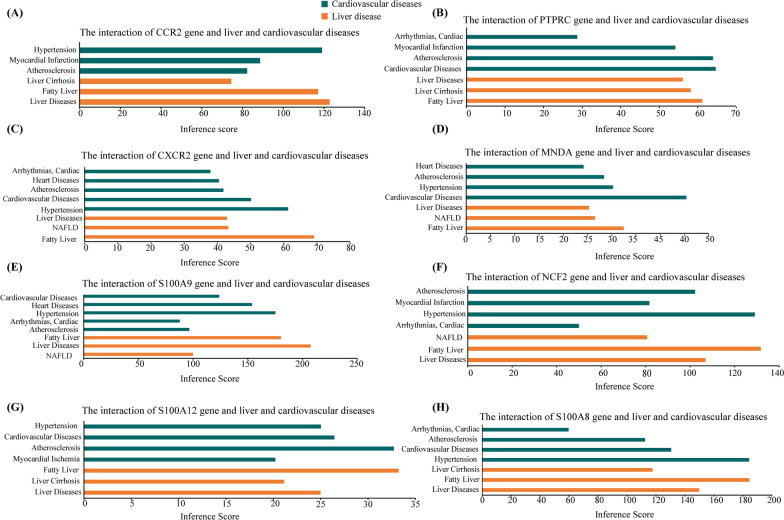
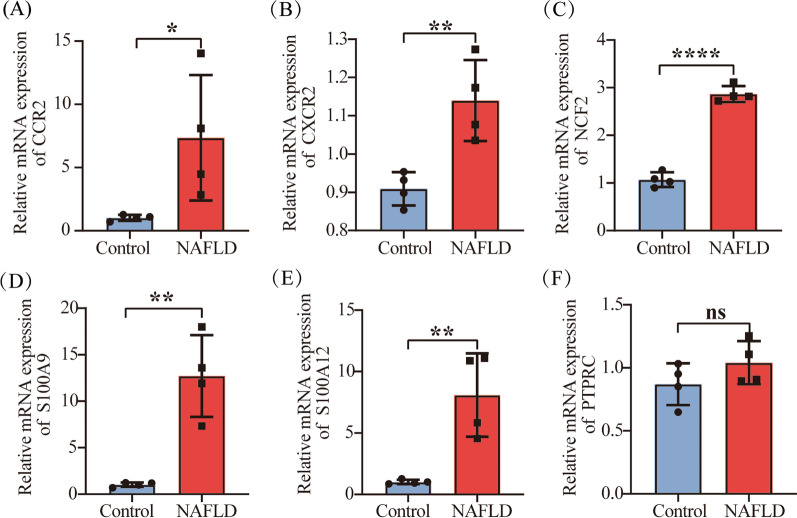
Materials and methods: NAFLD- and AF- related differentially expressed genes (DEGs) were identified via bioinformatic analysis of the Gene Expression Omnibus (GEO) datasets GSE63067 and GSE79768, respectively. Further enrichment analysis of Gene Ontology (GO) and Kyoto Encyclopedia of Genes and Genomes (KEGG), the construction of a protein-protein interaction (PPI) network, the identification of significant hub genes, and receiver operator characteristic curve analysis were conducted. The gene-disease interactions were analyzed using the Comparative Toxicogenomics Database. In addition, the hub genes were validated by quantitative Real-Time PCR (qRT-PCR) in NAFLD cell model.
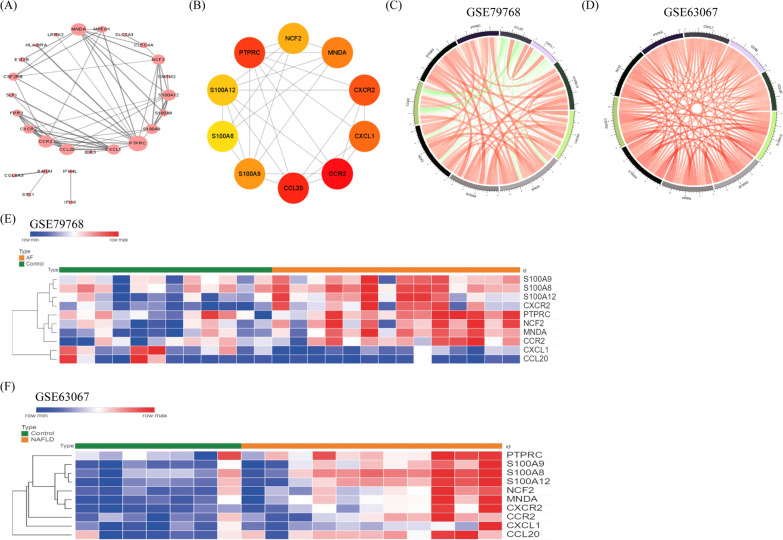
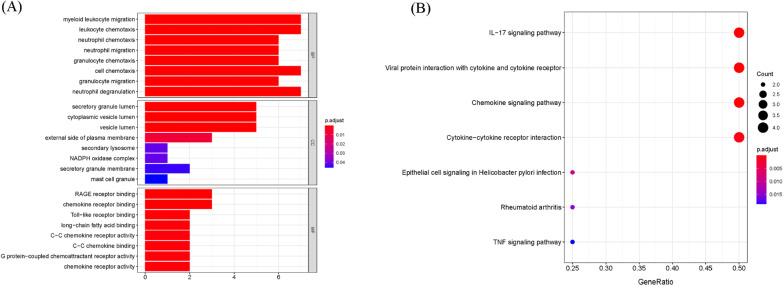
Results: A total of 45 co-expressed differentially expressed genes (co-DEGs) were identified between the NAFLD/AF and healthy control individuals. GO and KEGG pathway analyses revealed that the co-DEGs were mostly enriched in neutrophil activation involved in the immune response and cytokine-cytokine receptor interactions. Moreover, eight hub genes were selected owing to their high degree of connectivity and upregulation in both the NAFLD and AF datasets. These genes included CCR2, PTPRC, CXCR2, MNDA, S100A9, NCF2, S100A12, and S100A8.
Conclusions: In summary, we conducted the gene differential expression analysis, functional enrichment analysis, and PPI analysis of DEGs in AF and NAFLD, which provides novel insights into the identification of potential biomarkers and valuable therapeutic leads for AF and NAFLD.
Keywords: Atrial fibrillation; Bioinformatic technology; Differentially expressed genes; Hub genes; Nonalcoholic fatty liver disease.
© 2022. The Author(s).
Conflict of interest statement
The authors declare that this research was conducted in the absence of any commercial or financial relationships that could be construed as a potential conflict of interest.
Figures

Similar articles
-
Identification of common signature genes and pathways underlying the pathogenesis association between nonalcoholic fatty liver disease and heart failure.Front Immunol. 2024 Sep 16;15:1424308. doi: 10.3389/fimmu.2024.1424308. eCollection 2024. Front Immunol. 2024. PMID: 39351239 Free PMC article.
-
Identification of Genes and Key Pathways Associated with the Pathophysiology of Lung Cancer and Atrial Fibrillation.Altern Ther Health Med. 2024 Mar;30(3):68-75. Altern Ther Health Med. 2024. PMID: 37883760
-
Bioinformatics analysis reveals novel core genes associated with nonalcoholic fatty liver disease and nonalcoholic steatohepatitis.Gene. 2020 Jun 5;742:144549. doi: 10.1016/j.gene.2020.144549. Epub 2020 Mar 14. Gene. 2020. PMID: 32184169
-
Bioinformatic gene analysis for potential biomarkers and therapeutic targets of atrial fibrillation-related stroke.J Transl Med. 2019 Feb 13;17(1):45. doi: 10.1186/s12967-019-1790-x. J Transl Med. 2019. PMID: 30760287 Free PMC article.
-
Elucidation of the molecular mechanism of type 2 diabetes mellitus affecting the progression of nonalcoholic steatohepatitis using bioinformatics and network pharmacology: A review.Medicine (Baltimore). 2024 Sep 13;103(37):e39731. doi: 10.1097/MD.0000000000039731. Medicine (Baltimore). 2024. PMID: 39287256 Free PMC article. Review.
Cited by
-
Identification of m6A regulator-mediated RNA methylation modification patterns and key immune-related genes involved in atrial fibrillation.Aging (Albany NY). 2023 Feb 20;15(5):1371-1393. doi: 10.18632/aging.204537. Epub 2023 Feb 20. Aging (Albany NY). 2023. PMID: 36863715 Free PMC article.
-
Advances in the study of S100A9 in cardiovascular diseases.Cell Prolif. 2024 Aug;57(8):e13636. doi: 10.1111/cpr.13636. Epub 2024 Mar 19. Cell Prolif. 2024. PMID: 38504474 Free PMC article. Review.
-
Identification and validation of potential diagnostic signature and immune cell infiltration for NAFLD based on cuproptosis-related genes by bioinformatics analysis and machine learning.Front Immunol. 2023 Sep 26;14:1251750. doi: 10.3389/fimmu.2023.1251750. eCollection 2023. Front Immunol. 2023. PMID: 37822923 Free PMC article.
-
Multimodal AI/ML for discovering novel biomarkers and predicting disease using multi-omics profiles of patients with cardiovascular diseases.Sci Rep. 2024 Nov 3;14(1):26503. doi: 10.1038/s41598-024-78553-6. Sci Rep. 2024. PMID: 39489837 Free PMC article.
-
Bioinformatics analysis to reveal the potential comorbidity mechanism in psoriasis and nonalcoholic steatohepatitis.Skin Res Technol. 2023 Sep;29(9):e13457. doi: 10.1111/srt.13457. Skin Res Technol. 2023. PMID: 37753698 Free PMC article.
References
-
- Chugh SS, Havmoeller R, Narayanan K, Singh D, Rienstra M, Benjamin EJ, Gillum RF, Kim YH, McAnulty JH, Jr, Zheng ZJ, et al. Worldwide epidemiology of atrial fibrillation: a Global Burden of Disease 2010 Study. Circulation. 2014;129:837–847. doi: 10.1161/CIRCULATIONAHA.113.005119. - DOI - PMC - PubMed
Publication types
MeSH terms
LinkOut - more resources
Full Text Sources
Medical
Research Materials
Miscellaneous
