. 2022 Jun 16:13:896242.
doi: 10.3389/fimmu.2022.896242. eCollection 2022.

Process Development for Adoptive Cell Therapy in Academia: A Pipeline for Clinical-Scale Manufacturing of Multiple TCR-T Cell Products

Affiliations

Process Development for Adoptive Cell Therapy in Academia: A Pipeline for Clinical-Scale Manufacturing of Multiple TCR-T Cell Products

Daniela Nascimento Silva et al. Front Immunol. .

Abstract

Cellular immunotherapies based on T cell receptor (TCR) transfer are promising approaches for the treatment of cancer and chronic viral infections. The discovery of novel receptors is expanding considerably; however, the clinical development of TCR-T cell therapies still lags. Here we provide a pipeline for process development and clinical-scale manufacturing of TCR-T cells in academia. We utilized two TCRs specific for hepatitis C virus (HCV) as models because of their marked differences in avidity and functional profile in TCR-redirected cells. With our clinical-scale pipeline, we reproduced the functional profile associated with each TCR. Moreover, the two TCR-T cell products demonstrated similar yield, purity, transduction efficiency as well as phenotype. The TCR-T cell products had a highly reproducible yield of over 1.4 × 10⁹ cells, with an average viability of 93%; 97.8-99% of cells were CD3+, of which 47.66 ± 2.02% were CD8+ T cells; the phenotype was markedly associated with central memory (CD62L+CD45RO+) for CD4+ (93.70 ± 5.23%) and CD8+ (94.26 ± 4.04%). The functional assessments in 2D and 3D cell culture assays showed that TCR-T cells mounted a polyfunctional response to the cognate HCV peptide target in tumor cell lines, including killing. Collectively, we report a solid strategy for the efficient large-scale manufacturing of TCR-T cells.

Keywords: T cell modification; TCR-T cells manufacturing; academia; clinical scale; pipeline; process development.


Conflict of interest statement

The authors declare that the research was conducted in the absence of any commercial or financial relationships that could be construed as a potential conflict of interest.

Figures

Figure 1
Figure 1
Manufacturing of T cell receptor (TCR)-T cells using the CliniMACS Prodigy. Graphical representation of the manufacturing steps for TCR-T cells using the automated, closed CliniMACS Prodigy platform (steps 1–4). Frozen peripheral blood mononuclear cells were obtained from healthy donor buffy coat and used as starting material for the activation, transduction, and expansion of T cells under optimized conditions. After 8 days of expansion, samples from the harvested final products were taken for safety quality controls, and characterization of TCR-T cells was performed to determine the purity, T cell phenotype, transduction efficiency, functionality, and cytotoxic potential as assessed by 2D and 3D in vitro models (created with BioRender.com).
Figure 2
Figure 2
Characterization of T cell receptor (TCR)-T cells produced in small-scale experiments. (A, B) Comparison of the total cell number and viability of cell products from healthy donors (HD1-3) and chronically hepatitis C virus (HCV)-infected patient (KS6) performed on days 0, 4, 7, and 8 of cell expansion. (C) Transduction efficiency of redirected TCR-T cells represented by the percentage of mTCR expression in CD3+ cells from healthy donors and HCV-infected patient (KS6) after 8 days of expansion. (D) Percentage frequencies of mTCR expression in CD4+ and CD8+ T cells following T cell expansion. HCV-specific responses assessed by flow cytometry analysis for the intracellular content of IFNγ, TNFα, and IL-2 in CD8+ transduced cells following 6 h of coculture of NS31073–1081 or NS51992–2000 peptide-loaded T2 cells with redirected TCR-T cells from healthy donors (E, F) and chronically HCV-infected patient (G, H). HIV peptide-loaded T2 cells and non-stimulated T cells were included as negative controls in the coculture experiments performed in triplicate wells.
Figure 3
Figure 3
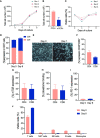
Clinical-grade manufacturing of T cell receptor (TCR)-T cells using the CliniMACS Prodigy. (A–C) Total cell numbers and cell viability of cell products from healthy donors (HD1-3) performed on days 0, 4, 7, and 8 of cell expansion. (D) CD4 and CD8 T cell ratios at the start of culture (day 0) compared to the end of culture (day 8). (E) Representative pictures from cell cultures taken with the internal camera of the CliniMACS Prodigy on day 0 and at 24 h after activation (day 1) under static culture conditions. (F) Activation status of CD4+ and CD8+ T cells after 24 h of activation as evaluated by flow cytometry analysis for the co-expression of CD25 and CD69 surface markers. (G) Transduction efficiency of redirected TCR-T cells represented by the percentage of mTCR expression in CD4+ and CD8+ cells on day 8. (H) Percentage frequencies of dextramer-specific binding in CD4+ and CD8+ transduced T cells. (I) Comparison of PD-1 expression evaluated on cells from starting material (day 0) and expanded transduced T cells (day 8). (J) Cell composition of starting material on day 0 and expanded final product on day 8 as assessed by flow cytometry to identify the percentage frequencies of lymphocyte T cells (CD3+), monocytes (CD14+), B cells (CD20+), NK cells (CD3-CD56+), and NKT cells (CD3+CD56+). The results are shown as mean ± SD for three independent healthy donors (n = 3).
Figure 4
Figure 4
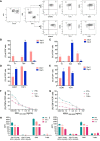
Phenotype and functionality of T cell receptor (TCR)-T cells produced in a large scale. The phenotypic characteristics of cells expanded in the CliniMACS Prodigy was assessed by flow cytometry to identify the percentage of memory T cell markers in TCR-T cells. (A) Representative FACS plots showing the gating strategy for the evaluation of memory T cell populations. The memory T cell populations were analyzed by gating on live lymphocytes based on their FSC-A/SSC-A profile and excluding any doublets. Subsequently, CD4+ and CD8+ mTCR+ transduced cells were analyzed in regard to their T cell subpopulations as assessed by the expression of CD45RO and CD62L. Besides the Tcm subpopulation (CD62L+ CD45RO+), the CCR7 and TCF1 expressions were evaluated in the CD62L+ population. The subpopulations were defined as follows: naïve T cells, CD62L+CD45RO-; central memory T cells (Tcm), CD45RO+CD62L+; and effector memory T cells (Tem), CD62-CD45RO+. (B, C) Column graphs showing the relative frequencies of the indicated subpopulations in CD8+ (B) and CD4+ T cell subsets (C) for each time point analyzed (days 0 and 8). (D, E) Comparison of CCR7 and TCF1 expressions evaluated on cells from the starting material (day 0) and expanded transduced T cells on day 8. (F, G) Hepatitis C virus (HCV)-specific responses as assessed by flow cytometry analysis for the intracellular content of IFNγ, TNFα, and IL-2 in CD8+ transduced T cells following 6 h of coculture of NS31073–1081 or NS51992–2000 peptide-loaded T2 cells with the indicated NS3- or NS5-specific TCR-T cells manufactured in CliniMacs Prodigy. HIV peptide-loaded T2 cells and non-stimulated T cells were included as negative controls in the coculture experiments performed in triplicate wells. (H, I) Cytokine production of TCR-T cells when cocultured with Huh-7/Lunet HCV replicon target cells as measured by Milliplex map human high-sensitivity kit. Huh-7/Lunet HCV replicon cells that were not engineered to express HLA-A2 (Lunet HCV+/HLA-A2-) as well as non-stimulated T cells were used as negative controls in the experiments performed with technical triplicates. The results are shown as mean ± SD for three independent healthy donors. ** is p value ≤ 0.01.
Figure 5
Figure 5
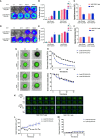
In vitro functional validation of TCR-T cells. NS3- and NS5-specific T cell receptor (TCR)-T cells demonstrate HLA-A2-restricted antiviral response against Huh-7/Lunet HCV replicon target cells in 2D cell culture model. Representative images of bioluminescence signal captured by IVIS Spectrum instrument from Huh7/Lunet HCV replicon cells after 24 h of cocultivation with NS3-specific TCR-T cells (A) or NS5-specific TCR-T cells (D) in the indicated E/T ratios (1:1, 0.1:1, and 0.01:1). Column bar graphs showing the Luciferase activity analyzed with Living Image Software in Huh-7/Lunet HCV+ cells cocultured with NS3-specific TCR-T cells (B) or NS5-specific TCR-T cells (E). Quantification of aspartate transaminase levels in the supernatants from 24-h coculture of Huh-7/Lunet HCV replicon cells with NS3-specific TCR-T cells (C) or NS5-specific TCR-T cells (F) at 1:1 E/T ratio. 3D Spheroid Killing Assay was performed to assess the cytotoxicity of NS3-specific TCR-T cells and NS5-specific TCR-T cells. Representative images of Huh-7/Lunet HCV replicon cell spheroids stained with Calcein cell-permeant green dye following the addition of NS3-specific TCR-T cells (G) or NS5-specific TCR-T cells (I) at basal time (0 h) and 48 h of coincubation. (H) Graph showing the green mean intensity from viable cells in the spheroids after 72 h of coculture with NS3-specific TCR-T cells or NS5-specific TCR-T cells (J) analyzed by the Incucyte live imaging system. (K) Representative images of Huh-7/Lunet HCV+ cell spheroids stained with Annexin V green dye cocultured or not with te indicated NS3-specific TCR-T cells or NS5-specific TCR-T cells and monitored by 72 h using the Incucyte live imaging system. (L) Graph showing the green intensity measurements of Annexin V fluorescent binding cells following the addition of NS3-specific TCR-T cells or NS5-specific TCR-T cells (M) monitored by 72 h Huh-7/Lunet HCV replicon cells that were not engineered to express HLA-A2 (Lunet HCV+/HLA-A2-) as well as mock non-transduced T cells were used as negative controls in 2D experiments. The results are shown as mean ± SD (***p ≤ 0.001) for technical triplicates performed in the 2D experiments or five replicates in the 3D Spheroid Killing Assay. * is p value ≤ 0.05; ** is p value ≤ 0.01; ***p ≤ 0.001.

Similar articles

Cited by

References

    1. Castella M, Caballero-Banos M, Ortiz-Maldonado V, Gonzalez-Navarro EA, Sune G, Antonana-Vidosola A, et al. . Point-Of-Care CAR T-Cell Production (ARI-0001) Using a Closed Semi-Automatic Bioreactor: Experience From an Academic Phase I Clinical Trial. Front Immunol (2020) 11:482. doi: 10.3389/fimmu.2020.00482 - DOI - PMC - PubMed
    1. Chandran SS, Klebanoff CA. T Cell Receptor-Based Cancer Immunotherapy: Emerging Efficacy and Pathways of Resistance. Immunol Rev (2019) 290(1):127–47. doi: 10.1111/imr.12772 - DOI - PMC - PubMed
    1. Kalos M, Levine BL, Porter DL, Katz S, Grupp SA, Bagg A, et al. . T Cells With Chimeric Antigen Receptors Have Potent Antitumor Effects and Can Establish Memory in Patients With Advanced Leukemia. Sci Transl Med (2011) 3(95):95ra73. doi: 10.1126/scitranslmed.3002842 - DOI - PMC - PubMed
    1. Maude SL, Frey N, Shaw PA, Aplenc R, Barrett DM, Bunin NJ, et al. . Chimeric Antigen Receptor T Cells for Sustained Remissions in Leukemia. N Engl J Med (2014) 371(16):1507–17. doi: 10.1056/NEJMoa1407222 - DOI - PMC - PubMed
    1. Kochenderfer JN, Dudley ME, Kassim SH, Somerville RP, Carpenter RO, Stetler-Stevenson M, et al. . Chemotherapy-Refractory Diffuse Large B-Cell Lymphoma and Indolent B-Cell Malignancies Can Be Effectively Treated With Autologous T Cells Expressing an Anti-CD19 Chimeric Antigen Receptor. J Clin Oncol (2015) 33(6):540–9. doi: 10.1200/JCO.2014.56.2025 - DOI - PMC - PubMed

Publication types

Substances