. 2022 Jul 1;149(13):dev200448.
doi: 10.1242/dev.200448. Epub 2022 Jul 4.

Notch signaling determines cell-fate specification of the two main types of vomeronasal neurons of rodents

Affiliations

Notch signaling determines cell-fate specification of the two main types of vomeronasal neurons of rodents

Raghu Ram Katreddi et al. Development. .

Abstract

The ability of terrestrial vertebrates to find food and mating partners, and to avoid predators, relies on the detection of chemosensory information. Semiochemicals responsible for social and sexual behaviors are detected by chemosensory neurons of the vomeronasal organ (VNO), which transmits information to the accessory olfactory bulb. The vomeronasal sensory epithelium of most mammalian species contains a uniform vomeronasal system; however, rodents and marsupials have developed a more complex binary vomeronasal system, containing vomeronasal sensory neurons (VSNs) expressing receptors of either the V1R or V2R family. In rodents, V1R/apical and V2R/basal VSNs originate from a common pool of progenitors. Using single cell RNA-sequencing, we identified differential expression of Notch1 receptor and Dll4 ligand between the neuronal precursors at the VSN differentiation dichotomy. Our experiments show that Notch signaling is required for effective differentiation of V2R/basal VSNs. In fact, Notch1 loss of function in neuronal progenitors diverts them to the V1R/apical fate, whereas Notch1 gain of function redirects precursors to V2R/basal. Our results indicate that Notch signaling plays a pivotal role in triggering the binary differentiation dichotomy in the VNO of rodents.

Keywords: Dll4; Mouse; Neuronal dichotomy; Neuronal differentiation; Notch signaling; Single cell RNA sequencing; Vomeronasal organ.


Conflict of interest statement

Competing interests The authors declare no competing or financial interests.

Figures

Fig. 1.
Fig. 1.
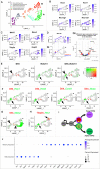
scRNA-seq identified adult neurogenesis and VSN apical-basal dichotomy in the mouse VNO. (A) UMAP dimensional reduction plot of Seurat object 1 shows neuronal and non-neuronal cell clusters of the VNO. Each colored cluster of cells corresponds to an identified cell type that has a similar transcriptomic profile. (B) Seurat object 2 generated from stem cell progenitors, neural precursors and immature neurons of Seurat object 1 identifies the VSN apical-basal dichotomy. (C) Heatmap of known gene expression that is specific to each stage of VSN formation. (D) Feature plots of Sox2, Ascl1, Neurog1 and Neurod1 in Seurat object 2. (E) Summary schematic depicting dynamic expression of stage-specific transcription factors throughout apical and basal VSN differentiation.
Fig. 2.
Fig. 2.
scRNA-seq analysis identified Notch1-Dll4 signaling in the VSN dichotomy. (A) UMAP dimension plot of Seurat object3 specifically focusing on the VSN apical-basal split. Letters A and B on the right of the UMAP denote apical and basal VSN branches, respectively. (B,C) Feature plots of known marker genes specific to neuronal progenitors, precursors and VSNs. (D) Feature plot of Bcl11b expression across the VSN dichotomy. The arrows highlight continuous Bcl11b expression in the basal VSN branch. Bcl11b expression appears at a later stage in the apical VSN branch. (Di) Feature plot highlighting Bcl11b+ and Bcl11b cells at the split point used for differential gene expression analysis. (Dii) Volcano plot highlighting Notch-related genes differentially expressed between Bcl11b+ and Bcl11b clusters. (E) Feature plots of Dll4 (arrowhead) and Notch1 (arrow) demonstrate their mutually exclusive expression at the VSN dichotomy. (F) Co-expression feature plots of Dll4 and downstream Notch signaling targets like Hes5, Hey1, Nrarp and Ccnd1 (arrows) show that active Notch signaling occurs transiently at the split point and early stages of the basal VSN trajectory. (G) Co-expression feature plot of Dll4 versus Meis2 highlights Dll4 expression at the start of the apical VSN branch. (H) Co-expression feature plot of Hey1 versus Tfap2e shows active Notch signaling in the basal VSN branch. (I) Schematic showing the inferred Notch1-Dll4 signaling required for establishing the early VSN dichotomy. (J) Dot plot of a few selected genes that are differentially expressed between the Dll4+ and Notch1+ clusters at the VSN dichotomy.
Fig. 3.
Fig. 3.
Notch1 and Dll4 immunoreactivity in Neurod1+ cells. (A-Aii) Immunofluorescence anti Dll4 (green) and Notch1 (magenta) shows expression of Notch ligand and receptor in marginal zones (MZ) and basal regions of the VNO at P1. Inset shows Dll4+ (arrow) and Notch1+ (arrowhead) cells in close proximity. (B) Immunofluorescence anti Notch1 (green) and Neurod1 (magenta). Notch1 expression co-occurs in the Neurod1+ stage (see arrow in the magnification). (C) Immunofluorescence anti Dll4 (green) and Neurod1 (magenta). Dll4 ligand expression occurs in the Neurod1+ stage (see arrow in the magnification). D, dorsal; L, lateral; M, medial; V, ventral.
Fig. 4.
Fig. 4.
Ascl1 lineage tracing reveals that both Dll4+ and Notch1+ cells are progeny of Ascl1+ cells. (A) Ascl1CreERT2/R26tdTom pups were injected with tamoxifen at P1 and perfused at 1, 3, 7 and 14 days post injection (dpi). (B) Plot showing differentiation time course of Ascl1+ traced neuronal progenitors. Data points are percentage tdTom+ traced cells that are Ki67+ and Neurod1+, quantified at different stages. (C) Top panel reflects the increase in tdTom+ traced cells from 1 dpi to 14 dpi. Bottom panel shows immunofluorescence anti Ki67 and tdTom. Arrows indicate proliferative traced cells. (D) Immunofluorescence anti Dll4, Notch1 and tdTom in Ascl1CreERT2 lineage-traced pups at 3 dpi. Inset shows both Dll4+ (arrow) and Notch1+ (arrowhead) cells in the marginal zone (MZ) that colocalized with tdTom tracing. (E) Immunofluorescence anti Notch intracellular domain (NICD) and tdTom in Ascl1CreERT2 lineage-traced pups at 3 dpi. Inset shows tdTom+ cells colocalized with NICD staining in the MZ (arrow). n=3 biological replicates. Data shown as mean±s.e.m.
Fig. 5.
Fig. 5.
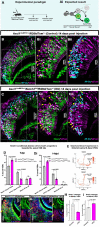
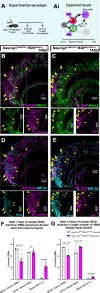
Notch1 loss of function biases VSN differentiation to the apical fate. (A) Ascl1CreERT2/Notch1fl/fl/R26tdTom and Ascl1CreERT2/R26tdTom pups were injected with tamoxifen at P1 and perfused at 7 dpi. (Ai) Expected results with Notch1 receptor KO driving the progenitors towards the apical VSN fate. (B-Cii) Immunofluorescence anti Meis2, Tfap2e (AP-2ε) and tdTom in Ascl1CreERT2 induced control and Notch1 cKO pups at 14 dpi. Arrows highlight traced Meis2+ and arrowheads highlight Tfap2e+ VSNs. (D,Di) Quantification of the percentage of traced VSNs that are Meis2+, Tfap2e+, and Meis2/Tfap2e double negative cells in control and Notch1 KO mice at 7 dpi and 14 dpi. (E) Feature plots of Gnai2 (Gαi2) and Gnao1 (Gαo) genes in the Seurat object 2 show that both G proteins are transcriptionally active in both VSN branches at the early stages of the dichotomy before getting restricted to apical versus basal VSN branches, respectively (see dotted circle). (F,G) Immunofluorescence of Gnao1/tdTom in control and Notch1 cKOs at 14 dpi. Arrows indicate Gnao1 expression in traced cells. (H,I) Quantification of the percentage of traced VSNs that are Gnao1+ and Gnai2+ in control and Notch1 KO mice at 14 dpi. D, Di, H, and I, statistical analysis based on arcsine-transformed values of the percentage data; unpaired two-tailed t-test; n=3 biological replicates. Data shown as mean±s.e.m. At 7 dpi, the average number of tdTom+ cells in control group was 234.2±9.2 and in cKOs it was 189.4±8. At 14 dpi, the average number of tdTom+ cells in control group was 229.6±11 and in cKOs it was 195.6±22.7.
Fig. 6.
Fig. 6.
Canonical Notch signaling establishes basal VSN fate. (A) Ascl1CreERT2/Rbpjfl/fl/R26tdTom and Ascl1CreERT2/R26tdTom pups were injected with tamoxifen at P1 and perfused at 7 dpi. (Ai) Expected results with Rbpj KO driving the progenitors towards the apical VSN fate. (B-Cii) Immunofluorescence anti Meis2, Tfap2e and tdTom in Ascl1CreERT2-induced control pups and Rbpj KO pups at 7 dpi. Arrows highlight traced Meis2+ and arrowheads highlight traced Tfap2e+ basal VSNs. (D) Quantification of the percentage of traced VSNs that are Meis2+, Tfap2e+, and Meis2/Tfap2e double negative cells in control and Rbpj KO mice at 7 dpi. Statistical analysis based on arcsine-transformed values of the percentage data; unpaired two-tailed t-test; n=3,4 biological replicates. Data shown as mean±s.e.m. At 7 dpi, the average number of tdTom traced cells in control group was 217.5±25.7 and in cKO it was 177±13.9.
Fig. 7.
Fig. 7.
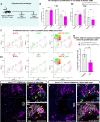
Notch1 conditional knockout at Ascl1 stage did not change proliferation or cell death at early stages. (A) Ascl1CreERT2/Notch1fl/fl/R26tdTom and Ascl1CreERT2/R26tdTom pups were injected with tamoxifen at P1 and perfused at 1 dpi and 3 dpi. (B,Bi) Quantification of percentage traced tdTom+ cells undergoing proliferation and quantification of the number of traced tdTom+ cells undergoing apoptosis in control and Notch1 cKOs at 1 dpi and 3 dpi. (C,Ci) Blended feature plots of Bcl11b/Mki67 and Bcl11b/Hey1 show that Bcl11b+ cells expressed early in the VSN dichotomy (highlighted in the box) are still proliferative and positive for downstream Notch signaling targets like Hey1, suggesting they are putative basal VSN precursors. (D) Quantification of percentage traced tdTom+ cells that are Bcl11b and Ki67 double positive at 3 dpi. (E-Fii) Immunofluorescence anti tdTom/Ki67/Bcl11b in control and conditional Notch1 KO at 3 dpi. Arrows highlight traced Ki67/Bcl11b double positive cells, whereas notched arrowheads highlight traced Ki67+/Bcl11b cells. In B, Bi and D, Ki67+ traced cells in distinct genetic backgrounds were compared as a percentage. Statistical analysis based on arcsine-transformed values of the percentage data; unpaired two-tailed t-test; n=3 biological replicates. Data shown as mean±s.e.m. At 1 dpi, the average number of tdTom+ cells in the control group was 27±2.5 and in cKO it was 33±4.8. At 3 dpi, the average number of tdTom+ cells in the control group was 119.5±2.9 and in cKO it was 95.8±11.9.
Fig. 8.
Fig. 8.
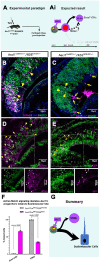
Ectopic expression of NICD at the Ascl1+ stage diverts the progenitors towards sustentacular cell fate. (A) Ascl1CreERT2/R26NICD and Ascl1CreERT2/R26tdTom pups were injected with tamoxifen at P1 and perfused at 7 dpi. (Ai) Expected result with NICD overexpression at the Ascl1+ stage driving progenitors towards the basal VSN fate. (B,C) Immunofluorescence of tdTom/HUCD in control and GFP/HUCD in NICD-inducible mice at 7 dpi. Arrows highlight NICD+/HUCD sustentacular cells, whereas arrowheads highlight NICD+/HUCD+ VSNs. (D,E) Immunofluorescence of tdTom/Meis2 in control and GFP/Meis2 in NICD-inducible mice at 7 dpi. Arrows highlight traced Meis2+ apical VSNs in control mice and Meis2+ sustentacular cells in inducible mice. Arrowheads highlight Meis2 basal VSNs in both control and inducible mice. (F) Quantification of percentage traced tdTom+ cells or GFP+ cells that are sustentacular cells or VSNs in control and NICD mice, respectively. (G) Summary showing NICD overexpression at Ascl1+ stage leads primarily to differentiation of progenitors into non-neuronal sustentacular cells. Statistical analysis based on arcsine-transformed values of the percentage data; unpaired two-tailed t-test; n=3 biological replicates. Data shown as mean±s.e.m. At 7 dpi, the total number of recombined cells considered for percentage analysis in the control group was 947.3±40.4 and in the mutant group was 90±7.
Fig. 9.
Fig. 9.
Ectopic expression of NICD at the Neurog1+ stage diverts neuronal precursors towards basal VSN fate. (A) Neurog1CreERT2/R26tdTom and Neurog1CreERT2/R26NICD pups were injected with tamoxifen at P1 and perfused at 7 and 14 dpi. (Ai) Expected results show that NICD overexpression at Neurog1+ stage may drive progenitors towards the basal VSN fate. (B-E) Immunofluorescence anti tdTom/Meis2/Tfap2e in Neurog1CreERT2-traced control pups and Neurog1CreERT2/R26NICD mutant pups at 14 dpi. Panels B and C highlight tdTom/Meis2 staining and panels D and E highlight tdTom/Tfap2e (AP-2ε) staining. Arrows show traced Tfap2e+ basal VSNs and arrowheads show Meis2+ apical VSNs in both control and inducible mice. (F,G) Quantification of percentage traced tdTom+ cells or GFP+ cells at 7 dpi and 14 dpi that are Meis2+, Tfap2e+ VSNs or Meis2/Tfap2e double negative cells in control and NICD mice. Statistical analysis based on arcsine-transformed values of the percentage data; unpaired two-tailed t-test; n=3 biological replicates. Data shown as mean±s.e.m. At 7 dpi, the average number of recombined cells in the control group was 368.1±23.8 and in the mutant group it was 128.3±35.2. At 14 dpi, the average number of recombined cells in the control group was 509±46.6 and in the mutant group it was 148.5±20.7.

Similar articles

Cited by

References

    1. Artavanis-Tsakonas, S., Rand, M. D. and Lake, R. J. (1999). Notch signaling: cell fate control and signal integration in development. Science 284, 770-776. 10.1126/science.284.5415.770 - DOI - PubMed
    1. Ayaz, F. and Osborne, B. A. (2014). Non-canonical notch signaling in cancer and immunity. Front. Oncol. 4, 345. 10.3389/fonc.2014.00345 - DOI - PMC - PubMed
    1. Aydin, B., Kakumanu, A., Rossillo, M., Moreno-Estellés, M., Garipler, G., Ringstad, N., Flames, N., Mahony, S. and Mazzoni, E. O. (2019). Proneural factors Ascl1 and Neurog2 contribute to neuronal subtype identities by establishing distinct chromatin landscapes. Nat. Neurosci. 22, 897-908. 10.1038/s41593-019-0399-y - DOI - PMC - PubMed
    1. Benedito, R. and Duarte, A. (2005). Expression of Dll4 during mouse embryogenesis suggests multiple developmental roles. Gene Expr. Patterns 5, 750-755. 10.1016/j.modgep.2005.04.004 - DOI - PubMed
    1. Bonnefont, J. and Vanderhaeghen, P. (2021). Neuronal fate acquisition and specification: time for a change. Curr. Opin. Neurobiol. 66, 195-204. 10.1016/j.conb.2020.12.006 - DOI - PMC - PubMed

Publication types