. 2022 Sep 15;33(11):ar100.
doi: 10.1091/mbc.E22-02-0057. Epub 2022 Jun 29.

Phosphorylation of the small heat shock protein HspB1 regulates cytoskeletal recruitment and cell motility

Affiliations

Phosphorylation of the small heat shock protein HspB1 regulates cytoskeletal recruitment and cell motility

Laura M Hoffman et al. Mol Biol Cell. .

Abstract

The small heat shock protein HspB1, also known as Hsp25/27, is a ubiquitously expressed molecular chaperone that responds to mechanical cues. Uniaxial cyclic stretch activates the p38 mitogen-activated protein kinase (MAPK) signaling cascade and increases the phosphorylation of HspB1. Similar to the mechanosensitive cytoskeletal regulator zyxin, phospho-HspB1 is recruited to features of the stretch-stimulated actin cytoskeleton. To evaluate the role of HspB1 and its phosphoregulation in modulating cell function, we utilized CRISPR/Cas9-edited HspB1-null cells and determined they were altered in behaviors such as actin cytoskeletal remodeling, cell spreading, and cell motility. In our model system, expression of WT HspB1, but not nonphosphorylatable HspB1, rescued certain characteristics of the HspB1-null cells including the enhanced cell motility of HspB1-null cells and the deficient actin reinforcement of stretch-stimulated HspB1-null cells. The recruitment of HspB1 to high-tension structures in geometrically constrained cells, such as actin comet tails emanating from focal adhesions, also required a phosphorylatable HspB1. We show that mechanical signals activate posttranslational regulation of the molecular chaperone, HspB1, and are required for normal cell behaviors including actin cytoskeletal remodeling, cell spreading, and cell migration.


Figures
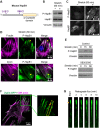
FIGURE 1:
FIGURE 1:
p38-dependent HspB1 phosphorylation and cytoskeletal response. (A) Diagram of murine HspB1 depicting phosphorylation targets of Ser15 and Ser86, and the alpha-crystallin domain. (B) Western immunoblot analysis of fibroblast cells subjected to 60 min uniaxial cyclic stretch shows increased phosphorylation of Ser 86-HspB1, with Total HspB1 and vinculin loading control, quantified in Supplemental Table S1. (C) Immunolocalization of Phospho-Ser86 HspB1 and Total HspB1 in unstretched and stretch-stimulated cells shows stretch-stimulated increase in phospho-HspB1 along with cytoskeletal distribution of HspB1. Uniaxial stretch vector in the horizontal direction is indicated by double-headed arrow of 50 µm scale. (D) Fluorescence confocal microscopy (top row) of F-actin (phalloidin, magenta) and phospho-HspB1 (green) following stretch-stimulation of a WT fibroblast shows accumulation of phospho-HspB1 at the ends of actin SFs (yellow arrowhead). Immunofluorescence microscopy (bottow row) of zyxin (magenta) and phospho-HspB1 (green) in a stretch-stimulated cell shows partial overlap of zyxin and HspB1 (yellow arrowhead). (E) Western immunoblot analysis of phospho-Ser86-HspB1 stretch response (0–15 m–60 m) in control cells and in cells preincubated with 10 µM p38 inhibitor SB203580, with vinculin loading controls. Stretch-stimulated phospho-HspB1 is blocked by the p38 inhibitor. (F) WT cells transfected with zyxin-GFP (green), seeded on fibronectin-coated coverslips and incubated with SiR-actin dye (magenta) were acquired on a spinning disk confocal microscope and are shown as maximum intensity projections from deconvolved images. Inset is magnified zyxin-GFP signal with boxed region of interest and yellow arrowhead indicating start point. (G) Kymograph of the 20-micron boxed region at 2-min intervals shows zyxin-GFP flux in WT cell over 10-min time frame.
FIGURE 2:
FIGURE 2:
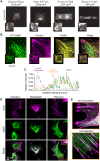
Zyxin and HspB1 response in cells on micropatterned substrates and with actomyosin contractility. (A) Immunolocalization of cytoskeletal protein Zyxin in WT cells on micropatterned fibronectin squares and rectangles shows distribution to high-tension corners and edges, especially on a 47 µm × 47 µm square (2209 µm2 island). Insets show a higher magnification view of lower left corner of cells. (B) Confocal microscopy of immunolocalized HspB1 (green) in WT cell adhered to 47 µm × 47 µm square fibronectin island and co-stained for vinculin (magenta) and F-actin (yellow), and including the Merged color image. Insets show the entire cell with magnified corner (boxed in yellow). (C) Intensity line profile (white bracket on Merge image) going from cell exterior toward the cell center in 1-µm increments is presented to illustrate the subcellular distribution. HspB1 (solid green line) is shifted away from vinculin focal adhesion (dashed magenta line) and coincident with the actin filament (dashed yellow line). (D) Confocal microscopy of Zyxin distribution (magenta, top row) and HspB1 distribution (green, middle row) in cells Untreated, Blebbistatin-treated (50 µM 30 min), and Blebbistatin wash-out 3 h Recovery conditions. Almost all Recovery cells acquired in 3 datasets had Zyxin cytoskeletal distribution (125/130 acquired cells) while evident HspB1 localization was detected in a more limited distribution and a smaller number of Recovery cells (38/114 cells). (E) Top inset shows a Zyxin distribution (magenta) to apparent comet tails with no detectable HspB1 co-localization and Bottom inset shows a Zyxin (magenta) distribution to apparent comet tails with detectable HspB1 (green) co-localization. In the merged image magenta and green overlap makes a white signal. Scale bar 20 µm.
FIGURE 3:
FIGURE 3:
Cell-based model system for evaluating HspB1 function. (A) HspB1 immunoblot of parental WT and CRISPR/Cas9 HspB1-null cells, followed by “rescue” constructs of WT HspB1, nonphosphorylatable Ser15,86A and phosphomimetic Ser15,86E HspB1s expressed in the HspB1-null cells, with vinculin loading control. (B) Widefield microscopy of immunofluorescent localization of the 3 HspB1 rescue constructs in cells on fibronectin-coated coverslips detects diffuse cytoplasmic distribution of HspB1. F-actin images (phalloidin) of the same cells are shown below. (C) Maximum intensity projections of confocal microscopy images of HspB1 immunolocalization (HspB1, green) and vinculin (magenta) in HspB1-null cells expressing the three rescue constructs of WT HspB1 and phosphomutant S15,86A and S15,86E HspB1s, on 47 µm × 47 µm micropattern islands. Insets show zoom Merge image (lower left boxed corner) cytoskeletal distribution of HspB1 detectable in WT and S15,86E HspB1 but not with S15,86A HspB1. Cytoskeletal distribution of HspB1 observed in 40% of WT HspB1 rescue cell images, 3% of S15,86A HspB1 rescue cell images, and 38% of S15,86E HspB1 rescue cell images. (D) Intensity line profiles from cell exterior toward interior (brackets) of vinculin (dashed magenta line) and HspB1 (solid green line). Scale bar 20 microns.
FIGURE 4:
FIGURE 4:
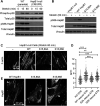
HspB1 affects cell spreading in a phosphodependent manner. (A) immunofluorescence microscopy of cells spread on glass coverslips coated with 10 µg/ml fibronectin. Subcellular distribution of HspB1 (top row, cytoplasmic) and vinculin (bottom row, FA) in WT and HspB1-null cells, and in null cells expressing the WT HspB1 rescue construct. (B) Graph of cell area measurements shows the decreased cell spread in HspB1-null cells is rescued by expressing WT HspB1 rescue construct. (C) immunofluorescence localization of HspB1 (top row) in HspB1-null cells, and in null cells expressing the rescue constructs for WT HspB1 and nonphosphorylatable S15,86A HspB1 and phosphomimetic S15,86E HspB1. Vinculin immunofluorescent localizations in same cells (bottom row). (D) Graph of cell area measurements show increased cell spreading in cells expressing WT and S15,86E HspB1, but no difference between HspB1-null cells and cells expressing S15,86A HspB1. Scale bar of 20 microns for widefield fluorescent images. Graphs are mean with standard deviations and unpaired t tests were used to determine p-values of **p < 0.01, ***p < 0.001.
FIGURE 5:
FIGURE 5:
Uniaxial cyclic stretch elicits actin remodeling in cells that express WT but not S15,86A HspB1. (A) Western immunoblot analysis of stretch-stimulated (15%, 0.5 Hz, 15 and 60 min) WT and HspB1-null cells. Phospho-p38 and PhosphoS86-HspB1 antibody signals are above the corresponding total antibody signals and a vinculin loading control. (B) Immunoblot analysis of unstretched and stretch-stimulated (15% 0.5 Hz 60 min) HspB1-null cells and cells expressing the rescue constructs for WT; S15,86A; and S15,86E HspB1s. PhosphoS86-HspB1 is elevated in stretch-stimulated WT HspB1 and is not detectable in the phosphomutant HspB1s, although they are all comparably expressed as detected by Total HspB1 antibody. Vinculin is shown as loading control. Immunoblot quantification is included in Supplemental Table S1. (C) Phalloidin-stained stretch-stimulated (15% 0.5 Hz 60 min) HspB1-null cells and cells expressing the rescue constructs for WT; S15,86A; and S15,86E HspB1s. Reorientation of actin perpendicular to the stretch vector (20 µm double-headed arrow) is maintained but actin thickening is variable. (D) Graph of SFTI measurements on the phalloidin-stained cells show the most robust actin SFs in cells expressing the WT and phosphomimetic S15,86E HspB1. Actin response between HspB1-null cells and cells expressing the nonphosphorylatable S15,86A HspB1 was similar. Graphs are mean with standard deviations and unpaired t tests were used to determine p values of **p < 0.01, ***p < 0.001. (E) Confocal microscopy of HspB1 immunolocalization in stretch-stimulated HspB1-null cells expressing WT; S15,86A; and S15,86E HspB1s. Cytoskeletal distribution of HspB1 is detectable in WT and S15,86E HspB1 (arrowheads) but not with S15,86A HspB1. In this imaging data set HspB1 cytoskeletal distribution was detected in 53% WT rescue cells (20/38), 10% S15,86A rescue cells (2 possible/20), and 47% S15,86E rescue cells (8/17). Double-headed arrow of 20 micron scale shows uniaxial stretch vector in the horizontal direction.
FIGURE 6:
FIGURE 6:
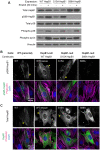
Stretch response of single-site mutants S15A and S86A HspB1. (A) Western immunoblot analysis of HspB1-null cells expressing WT and single-site mutants S15A and S86A HspB1. The stretch-stimulated (15% 0.5 Hz 60 min) phosphorylation of Ser86 HspB1 persists in S15A mutant and is not detected in S86A mutant. Stretch-stimulated phosphorylation response is intact for other proteins (p38 and zyxin) in the single-site mutant S15A and S86A cells. Vinculin control shows equal loading. (B) Immunofluorescence localization of stretch-stimulated pS86-HspB1 (top row) to the cytoskeleton (yellow arrowhead) is detected in WT parental cells and in HspB1-null cells expressing WT and S15A HspB1 and is absent for S86A HspB1. Merged images (bottom row) of pS86-HspB1 (green), F-actin (magenta), and DAPI (blue) are included for these maximum intensity projections. In imaging data set pS86-HspB1 cytoskeletal distribution was detected in 37% of WT (57 cells), 30% of WT rescue (37 cells), 32% of S15A rescue (34 cells), and none detected in S86A rescue (22 cells). (C) Immunofluorescence localization of Total HspB1 signal in stretch-stimulated cells. Cytoskeletal distribution of WT HspB1s and S15A HspB1 (yellow arrowhead). Only diffuse cytoplasmic distribution was detected for S86A HspB1. Merged images (bottom row) of Total-HspB1 (green), F-actin (magenta), and DAPI (blue) are included for these maximum intensity projections from a stack of confocal images. In imaging data set Total HspB1 cytoskeletal distribution was detected in 36% of WT (47 cells), 29% of WT rescue (31 cells), 20% of S15A rescue (25 cells), and none detected in S86A rescue (20 cells). Uniaxial stretch vector is presented in the horizontal direction, designated with a double-headed arrow of 20-µm scale.
FIGURE 7:
FIGURE 7:
HspB1-dependent regulation of cell motility requires phosphorylation. (A) Brightfield images of cells at the beginning and end of 18 h edge migration time course for HspB1-null cells alone or expressing WT HspB1 and phosphomutant S15,86A and S15,86E HspB1s. Border of starting edge and of migrated cells is demarcated with a white dashed line. Scale bar 100 microns. (B) Graph of migration distance at 18 h is shown for HspB1-null cells and cells expressing WT HspB1 and phosphomutant S15,86A and S15,86E HspB1s. Graph is mean with standard deviations and unpaired t tests were used to determine p values. ***p < 0.001 or n.s., not statistically significant. (C) Western immunoblot of cells seeded for migration assays shows expression of the three rescue construct HspB1s, with vinculin loading control.
FIGURE 8:
FIGURE 8:
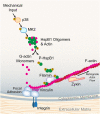
Model of mechanical stress stimulation on HspB1, FA, and F-actin filaments. Using our own data and building on published data from others (see Discussion), we propose a molecular model for HspB1 in the context of mechanical stress. Mechanical input activates the p38 MAPK pathway resulting in phosphorylation of HspB1, which disrupts oligomers of HspB1 with monomeric actin. G-actin monomers are then available for incorporation into focal adhesion-anchored F-actin filaments. Phospho-HspB1 is recruited to tension-dependent cytoskeletal structures and may interact with FilaminC. Also included are vinculin as a foundational component of integrin-based FA and zyxin as a fiducial marker moving out of FA along actin filaments in a retrograde flow.

Similar articles

Cited by

References

    1. Anderson CA, Kovar DR, Gardel ML, Winkelman JD (2021). LIM domain proteins in cell mechanobiology. Cytoskeleton (Hoboken) 78, 303–311. - PMC - PubMed
    1. Anderson TW, Vaughan AN, Cramer LP (2008). Retrograde flow and myosin II activity within the leading cell edge deliver F-actin to the lamella to seed the formation of graded polarity actomyosin II filament bundles in migrating fibroblasts. Mol Biol Cell 19, 5006–5018. - PMC - PubMed
    1. Aratyn-Schaus Y, Oakes PW, Gardel ML (2011). Dynamic and structural signatures of lamellar actomyosin force generation. Mol Biol Cell 22, 1330–1339. - PMC - PubMed
    1. Arber S, Hunter JJ, Ross J Jr, Hongo M, Sansig G, Borg J, Perriard JC, Chien KR, Caroni P (1997). MLP-deficient mice exhibit a disruption of cardiac cytoarchitectural organization, dilated cardiomyopathy, and heart failure. Cell 88, 393–403. - PubMed
    1. Arrigo AP (2017). Mammalian HspB1 (Hsp27) is a molecular sensor linked to the physiology and environment of the cell. Cell Stress Chaperones 22, 517–529. - PMC - PubMed

Publication types

MeSH terms